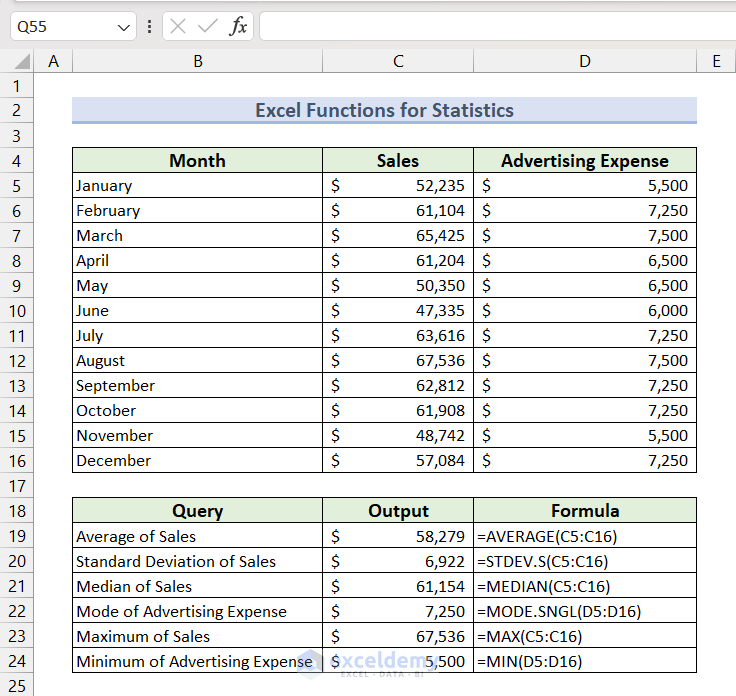
In this article, we will present 111 Excel functions for statistics and 10 practical examples to apply some of these functions. We will also discuss the 2 most common Excel tools for statistics. Here’s an overview of some of the statistics functions you can use on a sales dataset.
Download the Practice File
You may download the following file and follow along.
111 Excel Functions for Statistics in Alphabetical Order
Excel has more than 450 functions for various purposes. Among them, the following 111 formulas are the most common and crucial for statistical uses.
| Function | Purpose |
|---|---|
| AVEDEV | Calculates the average of absolute deviations of its argument numbers from their mean. |
| AVERAGE | Computes the arithmetic average of its argument numbers. |
| AVERAGEA | Returns the arithmetic average of its arguments. The arguments can be numbers, texts, or logical operators. Text and FALSE values are evaluated as 0 whereas TRUE values are evaluated as 1. |
| AVERAGEIF | Calculates the average of all the cells in its argument range that meet a single criterion. |
| AVERAGEIFS | Returns the average of all the cells in its argument range based on multiple criteria. |
| BETA.DIST | Returns the Beta distribution’s probability density function or cumulative distribution function. |
| BETA.INV | Calculates the inverse of the cumulative distribution function for a given Beta distribution. |
| BINOM.DIST | Calculates the probability of a certain number of successes in a fixed number of independent trials using the Binomial distribution. |
| BINOM.DIST.RANGE | Computes the sum of the probabilities of a range of successes in a fixed number of trials. |
| BINOM.INV | Returns the smallest value for which the cumulative Binomial distribution is greater than or equal to a given criterion. |
| CHISQ.DIST | Calculates the probability density function or cumulative distribution function of the Chi-squared distribution. |
| CHISQ.DIST.RT | Returns the one-tailed (right tail) probability of the Chi-squared distribution. |
| CHISQ.INV | Computes the inverse of the cumulative distribution function of a given left-tailed Chi-squared distribution. |
| CHISQ.IVT.RT | Computes the inverse of the cumulative distribution function of a given right-tailed Chi-squared distribution. |
| CHISQ.TEST | Performs a Chi-squared test of independence to determine whether the null hypothesis is TRUE or FALSE. |
| CONFIDENCE.NORM | Uses Normal distribution to return the confidence interval for a population mean. |
| CONFIDENCE.T | Uses Student’s t-distribution to return the confidence interval for a population mean. |
| CORREL | Computes the correlation coefficient between two given data sets. |
| COUNT | Counts the number of numeric values in a list of arguments. |
| COUNTA | Returns the count of non-blank cells in a given range. |
| COUNTBLANK | Returns the count of blank cells in a given range. |
| COUNTIF | Counts the cells in its argument range that meet a single criterion. |
| COUNTIFS | Counts the cells in its argument range based on multiple criteria. |
| COVARIANCE.P | Computes population covariance, the average of the products of deviations for each data point pair between two given data sets. |
| COVARIANCE.S | Computes the sample covariance between two data sets. |
| DEVSQ | Calculates the sum of squares of deviations from the sample mean for its argument points. |
| EXPON.DIST | Calculates the probability density function or cumulative distribution function of the Exponential distribution. |
| F.DIST | Computes the probability density function of the F-distribution to determine whether two given data sets have different degrees of diversity. |
| F.DIST.RT | Returns the right-tailed F-distribution for two given data sets. |
| F.INV | Computes the inverse of the cumulative distribution function of the F-distribution. |
| F.INV.RT | Computes the inverse of the right-tailed probability density function of the F-distribution. |
| F.TEST | Performs a two-tailed F-test to compare variances of two given data sets. |
| FISHER | Calculates the Fisher transformation at any given numeric value x where -1<x<1. |
| FISHERINV | Computes the inverse of the Fisher transformation. |
| FORECAST | Uses Linear Regression to predict a future value based on historical data. |
| FORECAST.ETS | Uses the Exponential Tripple Smoothing algorithm to predict a future value based on historical data. |
| FORECAST.ETS.CONFINT | Returns the confidence interval of any future prediction for a specific date. The future predictions are based on the Exponential Tripple Smoothing algorithm. |
| FORECAST.ETS.SEASONALITY | Computes the seasonality (length of repetitive pattern) for any forecast based on the ExponentialTripple Smoothing Algorithm. |
| FORECAST.ETS.STAT | Uses Time Series Forecasting to return statistical information of a forecast based on a specified statistic type. |
| FORECAST.LINEAR | Uses Linear Regression to predict a future value based on existing historical data. |
| FREQUENCY | Returns count of how often values occur within a range of values in a vertical array. |
| GAMMA | Computes the Gamma function value of a given number. |
| GAMMA.DIST | Returns the Gamma distribution’s probability density function or cumulative distribution function. |
| GAMMA.INV | Calculates the inverse of the cumulative distribution function for a given Gamma distribution. |
| GAMMALN | Computes the Natural Logarithm of a specified number’s Gamma function. |
| GAMMALN.PRECISE | Computes the Natural Logarithm of a specified number’s Gamma function using higher precision. |
| GAUSS | Calculates the probability that a member of a standard normal population will fall between the mean and z standard deviations from the mean. The returned value is 0.5 less than the standard normal cumulative distribution. |
| GEOMEAN | Returns the Geometric Mean of an array of positive numbers. |
| GROWTH | Predicts exponential growth based on existing data. |
| HARMEAN | Returns the Harmonic Mean of an array of numbers. |
| HYPGEOM.DIST | Returns the Hypergeometric distribution value of a finite population. |
| INTERCEPT | Calculates the y-axis intercept of the linear regression line based on known x and y values. |
| KURT | Calculates the kurtosis of a data set to characterize the relative peakedness or flatness of a distribution compared with the normal distribution. |
| LARGE | Returns the k-th largest value in an argument array. |
| LINEST | Computes Slope, Intercept, and other parameters of a linear trend. |
| LOGEST | Calculates the parameters of an Exponential Regression curve. |
| LOGNORM.DIST | Calculates the probability density function or cumulative distribution function of the Lognormal distribution. |
| LOGNORM.INV | Computes the inverse of the cumulative distribution function of a given left-tailed Lognormal distribution. |
| MAX | Returns the maximum value from a range or an array. |
| MAXA | Returns the maximum value from a list of arguments that can include numbers, names, text, or logical values. |
| MAXIFS | Returns the maximum of all the values in its argument range based on multiple criteria. |
| MEDIAN | Computes the median of a set of numbers. |
| MIN | Returns the minimum value from a range or an array. |
| MINIFS | Returns the minimum of all the values in its argument range based on multiple criteria. |
| MINA | Returns the minimum value from a list of arguments that can include numbers, names, text, or logical values. |
| MODE.MULT | Returns an array of the most frequently occurring values in a range of data. |
| MODE.SNGL | Returns the most frequently occurring value in a range of data. |
| NEGBINOM.DIST | Computes the Negative Binomial distribution’s probability density function or cumulative distribution function. |
| NORM.DIST | Returns the probability density function or cumulative distribution function of the Normal distribution for a specified mean and standard deviation. |
| NORM.INV | Calculates the inverse of the cumulative distribution function for a given Normal distribution with a specified mean and standard deviation. |
| NORM.S.DIST | Returns the probability density function or cumulative distribution function of the standard Normal distribution with a mean of 0 and standard deviation of 1. |
| NORM.S.INV | Computes the inverse of the standard normal cumulative distribution function (has a mean of 0 and standard deviation of 1). |
| PEARSON | Computes the Pearson correlation coefficient between two data sets. |
| PERCENTILE.EXC | Calculates the k-th percentile of a data set excluding the data points at both ends of the dataset where 0<k<1 |
| PERCENTILE.INC | Calculates the k-th percentile of a data set including the data points at both ends of the dataset where 0<k<1. |
| PERCENTRANK.EXC | Calculates the relative rank of a value in a data set, excluding the value itself. |
| PERCENTRANK.INC | Calculates the relative rank of a value in a data set, including the value itself. |
| PERMUT | Computes the number of permutations for a given number of items that can be selected from the total number of items. |
| PERMUTATIONA | Computes the number of permutations for a given number of items (with repetitions) that can be selected from the total number of items. |
| PHI | Returns the density function’s value of a Standard Normal distribution (has a mean of 0 and standard deviation of 1). |
| POISSON.DIST | Computes the probability density function or cumulative distribution function of the Poisson distribution. |
| PROB | Calculates the probability that values in a range are between two limits based on a set of values and associated probabilities. |
| QUARTILE.EXC | Calculates the k-th quartile of an argument data set, excluding the quartile value. |
| QUARTILE.INC | Calculates the k-th quartile of an argument data set, including the quartile value. |
| RANK.AVG | Returns the rank of a value in a data set (the average of the ranks is returned for ties). |
| RANK.EQ | Returns the rank of a value in a data set (the top rank is returned for ties). |
| RSQ | Computes the coefficient of determination (square of the Pearson product moment correlation coefficient). |
| SKEW | Returns the skewness (the amount of asymmetry of a distribution around its mean) of a data set’s distribution. |
| SKEW.P | Returns the skewness (the amount of asymmetry of a distribution around its mean) of a population. |
| SLOPE | Calculates the slope of the linear regression line specified by argument x and y values. |
| SMALL | Returns the k-th smallest value in an argument array. |
| STANDARDIZE | Normalizes a value based on mean and standard deviation to return a standardized z-score. |
| STDEV.P | Returns the standard deviation of a population while ignoring text and logical values. |
| STDEV.S | Returns the standard deviation of a sample while ignoring text and logical values. |
| STDEVA | Returns the standard deviation of a sample including numbers, text, and logical values. |
| STDEVPA | Returns the standard deviation of a population including numbers, text, and logical values. |
| STEYX | Computes the standard error of the forecasted y-value for each x-value in the regression. |
| T.DIST | Calculates the probability density function or cumulative distribution function of the left-tailed Student’s t-distribution. |
| T.DIST.2T | Returns the probability density function or cumulative distribution function of the two-tailed Student’s t-distribution. |
| T.DIST.RT | Calculates the probability density function or cumulative distribution function of the right-tailed Student’s t-distribution. |
| T.INV | Computes the inverse of the cumulative distribution function of a given left-tailed Student’s t-distribution. |
| T.INV.2T | Computes the inverse of the cumulative distribution function of a given two-tailed Student’s t-distribution. |
| T.TEST | Performs a t-test to compare means of two samples. |
| TREND | Returns values in a linear trend by fitting a straight line using known x and y values. |
| TRIMMEAN | Calculates the mean of a data set after removing a certain percentage of outliers from both ends. |
| VAR.P | Returns the variance of a population while ignoring text and logical values. |
| VAR.S | Returns the variance of a sample while ignoring text and logical values. |
| VARA | Computes the variance of a sample including numbers, text, and logical values. |
| VARPA | Computes the variance of a population including numbers, text, and logical values. |
| WEIBULL.DIST | Returns Weibull distribution’s probability density function or cumulative distribution function. |
| Z.TEST | Calculates the P-value of a one-tailed Z-test to compare two sample means. |
10 Practical Examples to Apply Excel Functions for Statistics
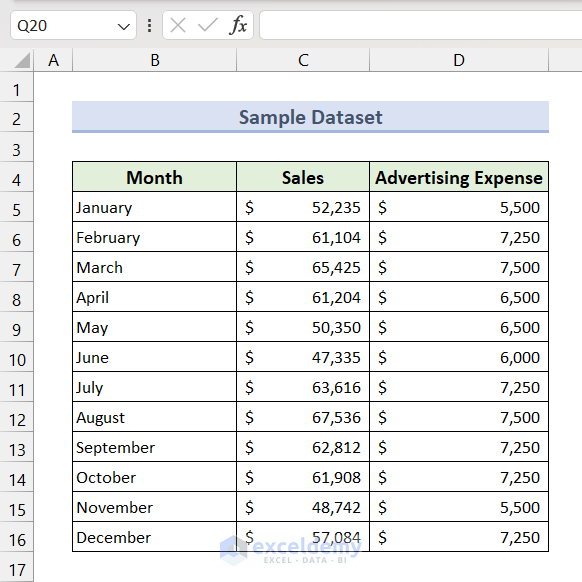
We will use the following dataset to showcase the most common statistical functions. It contains Sales values and Advertising Expenses for different months.
Method 1 – Calculate the Average
- Select Cell D18 and insert the following formula, then press the Enter key.
=AVERAGE(C5:C16)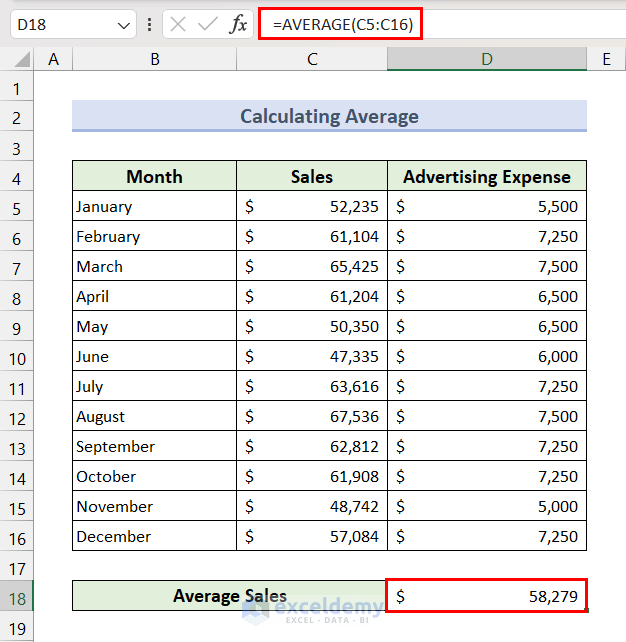
We can also filter cells based on a condition before averaging using the AVERAGEIF function.
- Select Cell D18 and insert the following formula, then press the Enter key.
=AVERAGEIF(D5:D16,">6000",C5:C16)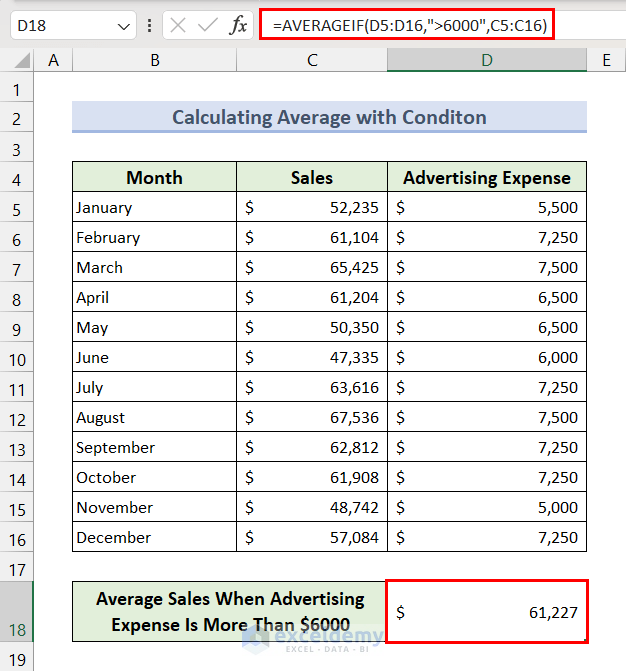
Method 2 – Determine the Standard Deviation
- Select Cell D18 and insert the following formula, then press the Enter key.
=STDEV.S(C5:C16)
Read More: How to Calculate Sigma in Excel
Method 3 – Calculate Variance
- Select Cell D18 and insert the following formula, then press the Enter key.
=VAR.S(D5:D16)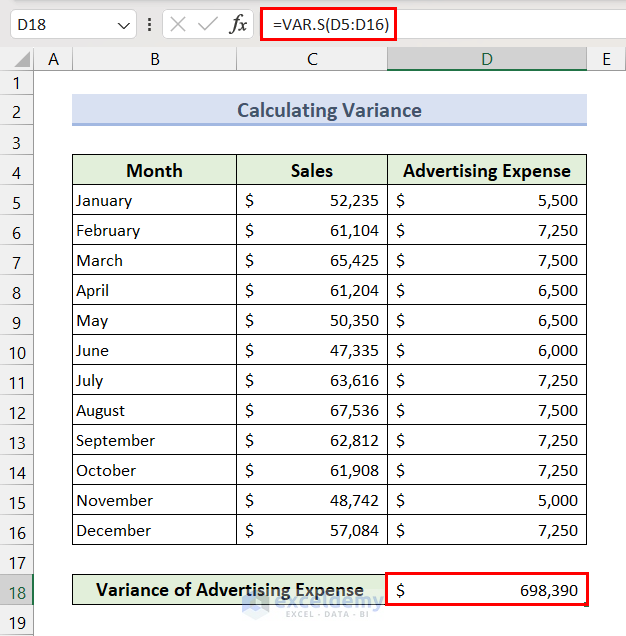
Method 4 Calculate the Median
The median is the midpoint of a frequency distribution.
- Apply the following formula in the result cell:
=MEDIAN(C5:C16)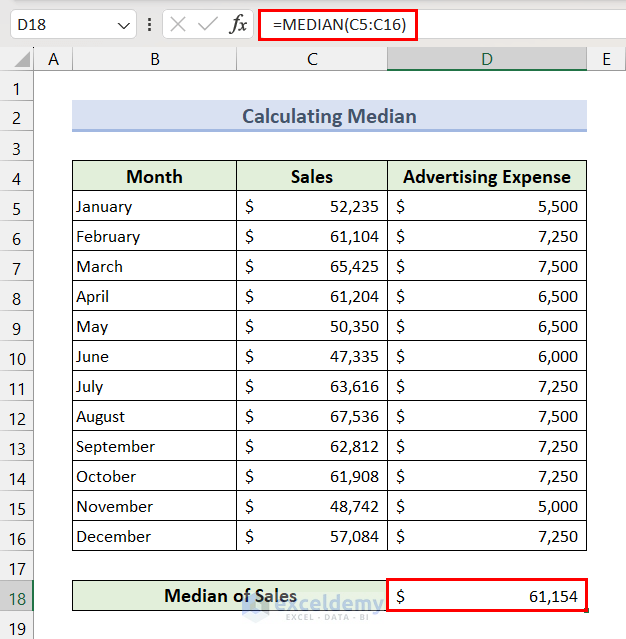
Method 5 – Find the Most Frequently Occurring Value
Use the MODE.SNGL function.
- Apply the following formula in the result cell:
=MODE.SNGL(D5:D16)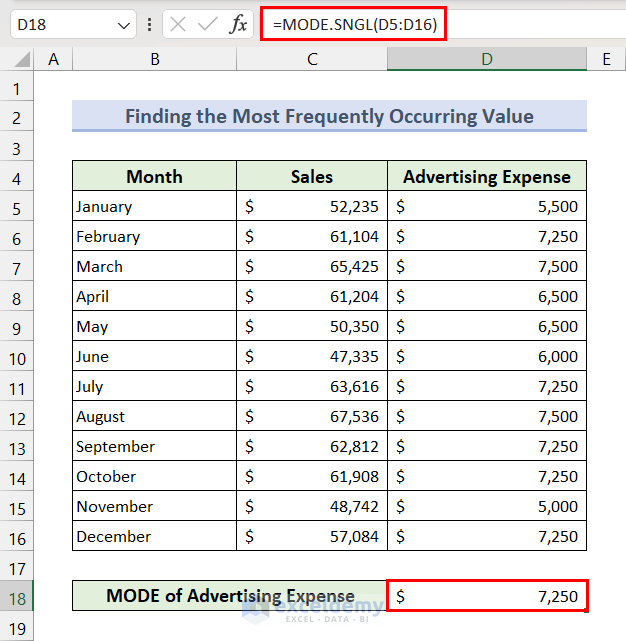
Read More: How to Find Mean, Median, and Mode on Excel
Method 6 – Count Cells
- Apply the following formula in the result cell:
=COUNT(D5:D16)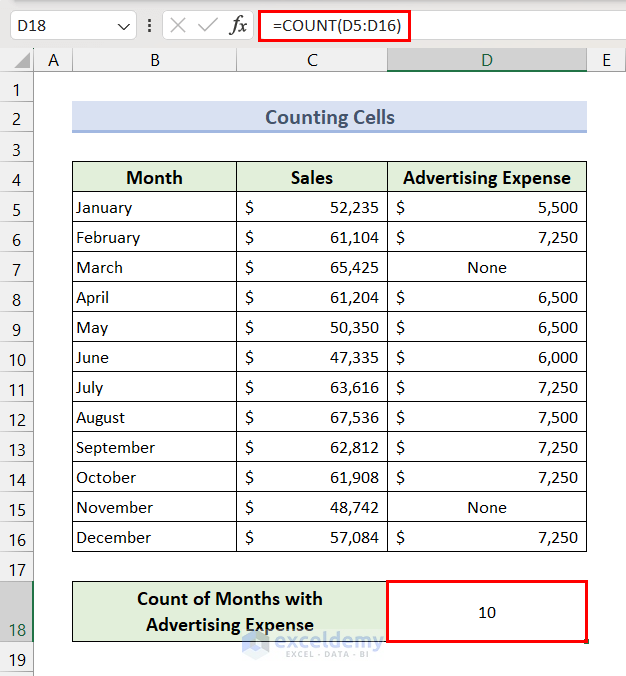
If we require counting cells with numbers, text, or logical values, then we can use the COUNTA function. It returns the number of non-blank cells in a range.
- Apply the following formula in the result cell:
=COUNTA(D5:D16)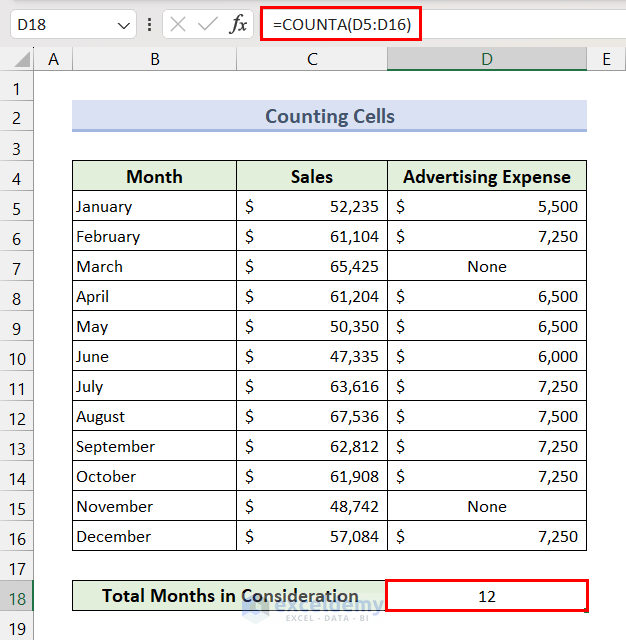
We can filter which cells to count by applying one or multiple conditions. Here, we will apply the COUNTIFS function to count months where sales in more than $50,000 and advertising expense is less than $7000.
- Apply the following formula in the result cell:
=COUNTIFS(C5:C16,">50000",D5:D16,"<7000")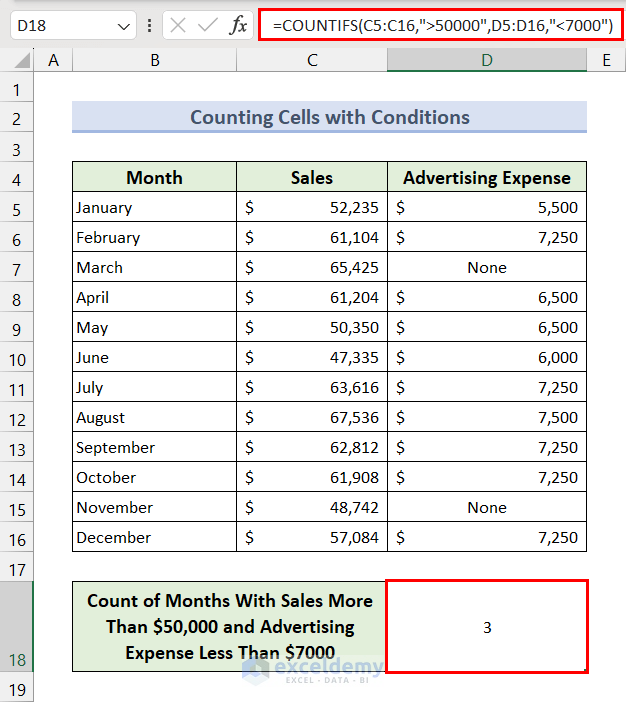
Method 7 – Calculate Quartile and Quartile Deviation
Quartile Deviation values are often used for examining the spread of a data range about a central value (mean or average). Here, we will use the QUARTILE.INC function to determine Quartile and Quartile Deviation of sales.
- We have to determine the First Quartile (Q1) value.
- Apply the following formula in the result cell D18:
=QUARTILE.INC(C5:C16,1)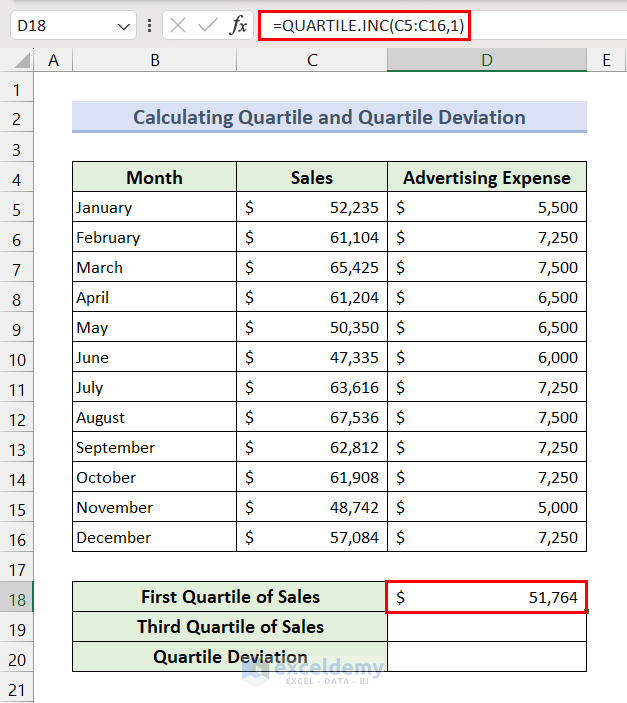
- For the third quarterly value, apply the following formula in D19:
=QUARTILE.INC(C5:C16,3)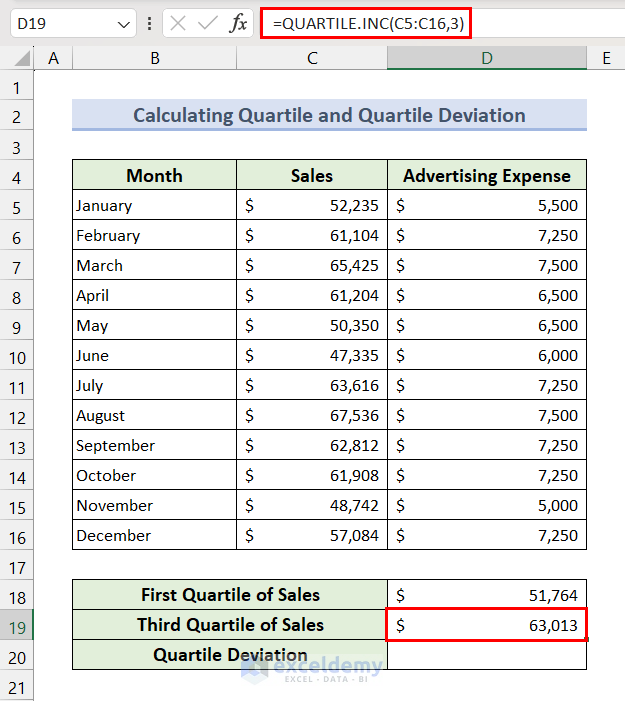
- For the Quartile Deviation value, apply the following formula in D20:
=(D19-D18)/2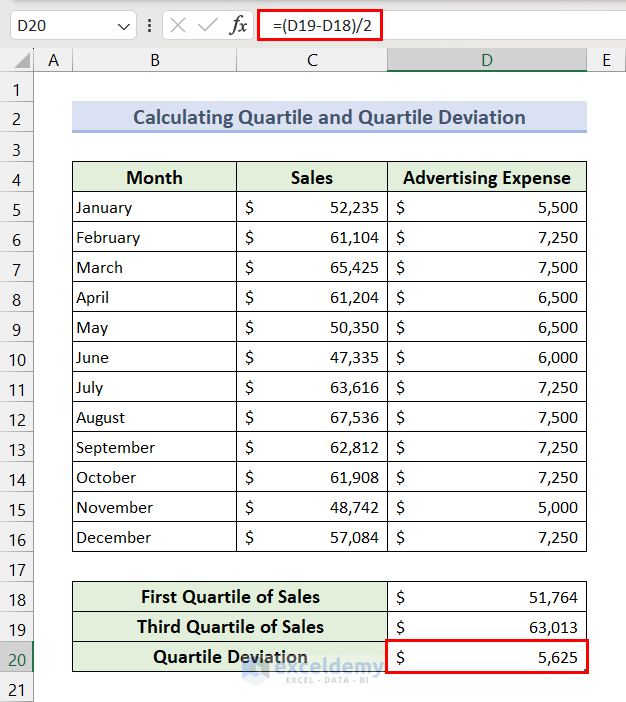
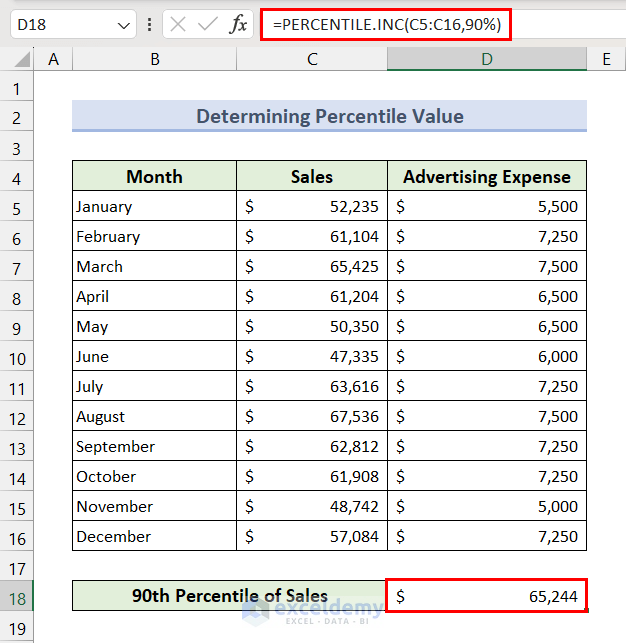
Method 8 – Determine Percentile Value
Percentile values are particularly useful when you need to understand how a particular data point compares to the rest of the data distribution. Here, we’ll use the PERCENTILE.INC function to determine the 90th percentile of sales.
- Insert the following formula in Cell D18 and press the Enter key:
=PERCENTILE.INC(C5:C16,90%)
Method 9 – Determine Maximum and Minimum Values
- Select cell D18, insert the following formula, and press Enter to get the maximum value from the range:
=MAX(C5:C16)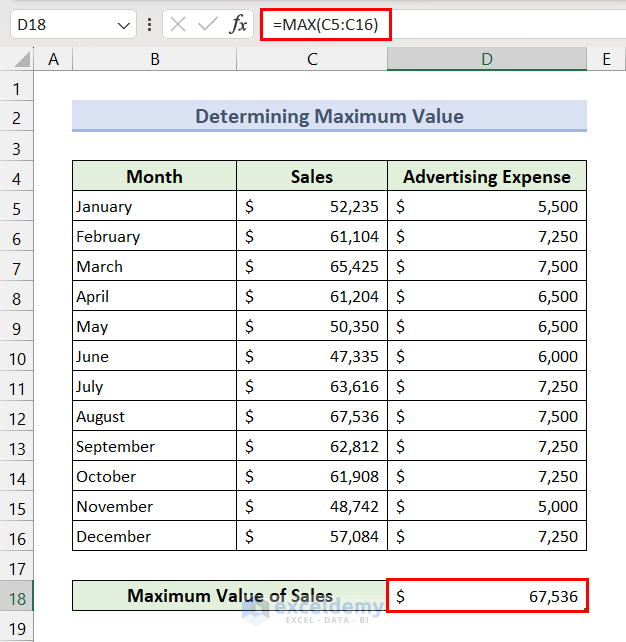
We can also use the LARGE function to determine the maximum value. Apart from the largest value, it can also return the second, third, or other largest values.
- Select cell D18, insert the following formula, and press the Enter key for the third-highest value.
=LARGE(C5:C16,3)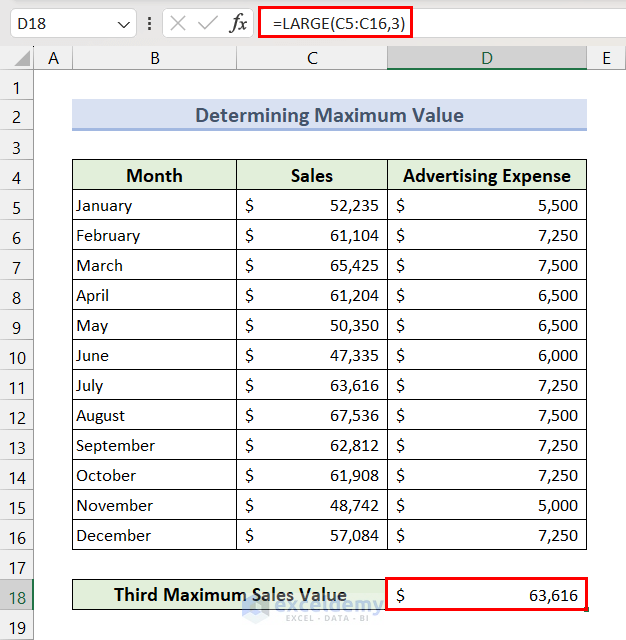
We can apply the MIN function to calculate the minimum value in a data set.
- Insert the following formula in Cell D18 and press the Enter key to determine the smallest advertising expense.
=MIN(D5:D16)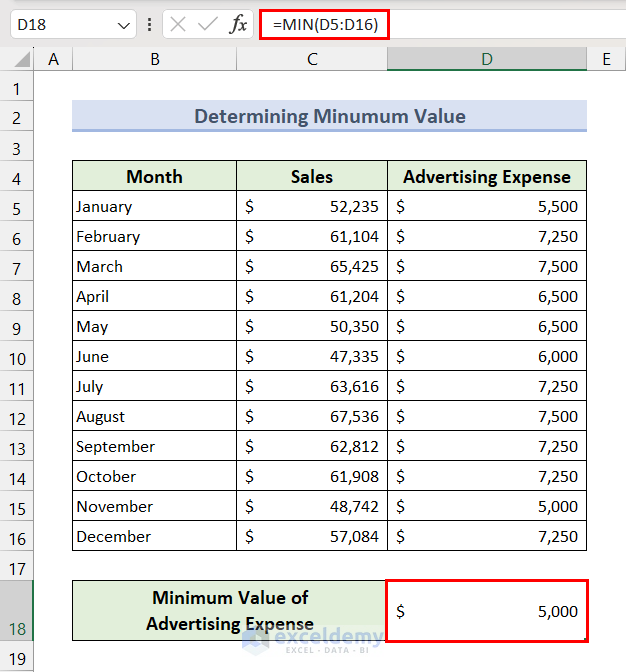
To get the second, third, or other smallest values, we can use the SMALL function.
- Select Cell D18, insert the following formula, and press the Enter key to get the second smallest value of advertising expense.
=SMALL(D5:D16,2)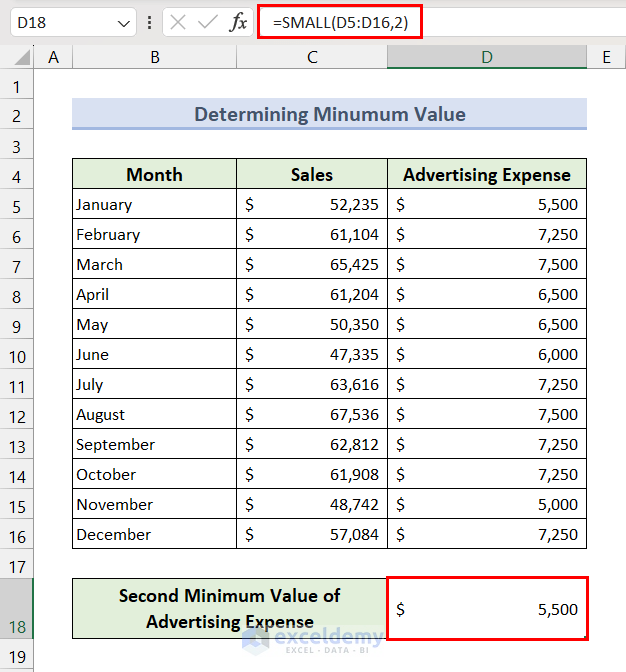
Read Mode: MAX vs MAXA vs LARGE and MIN vs MINA vs SMALL Functions in Excel
Method 10 – Find a Correlation Between Two Columns
We will check the correlation between advertising expense and sales values by using the CORREL function.
- Select cell D18, insert the following formula, and press the Enter key:
=CORREL(C5:C16,D5:D16)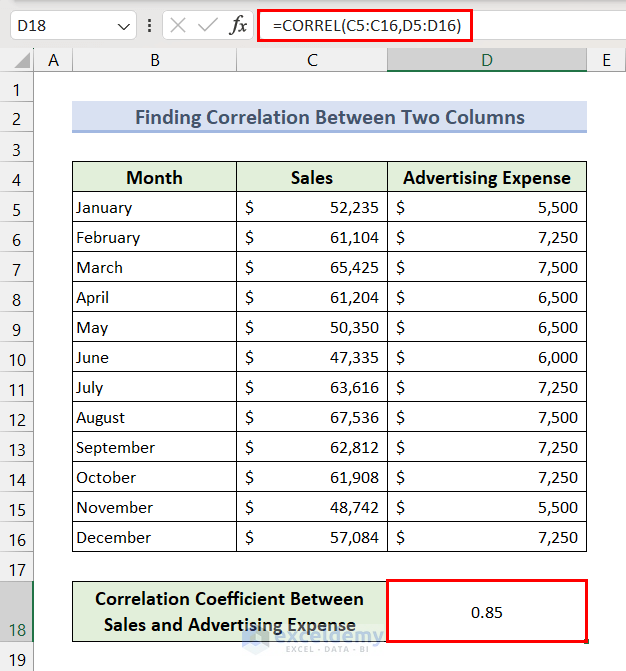
As the output (correlation coefficient) is closer to 1, we can say there is a positive correlation between advertising expenses and sales.
2 Most Common Statistical Tools in Excel and Their Uses
Case 1 – The Regression Tool
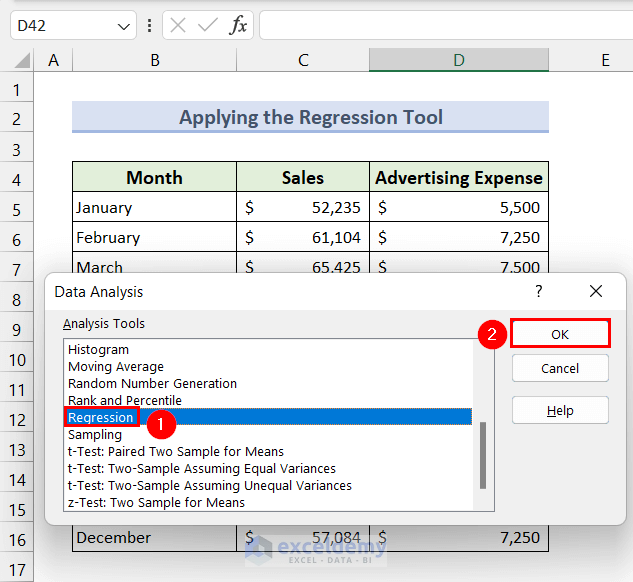
- Go to the Data tab and click on the Data Analysis option from the Analyze menu.
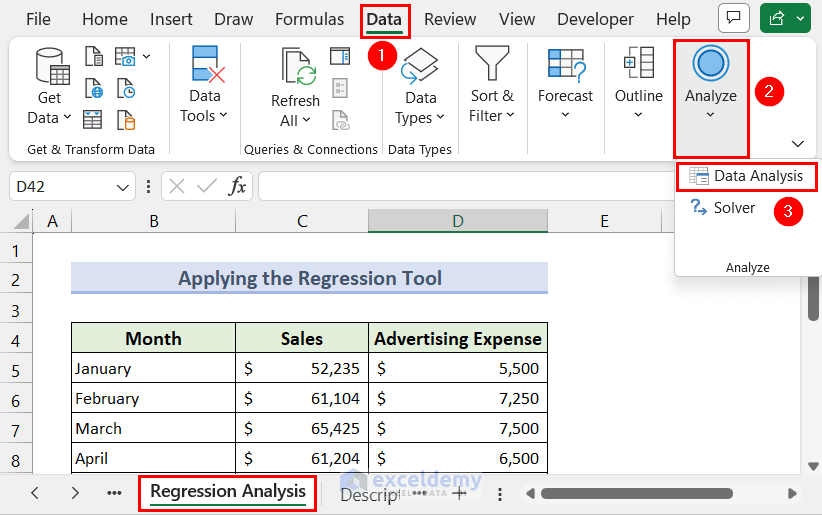
- The Data Analysis dialogue box will pop up.
- Scroll down and select the Regression option.
- Click the OK button.
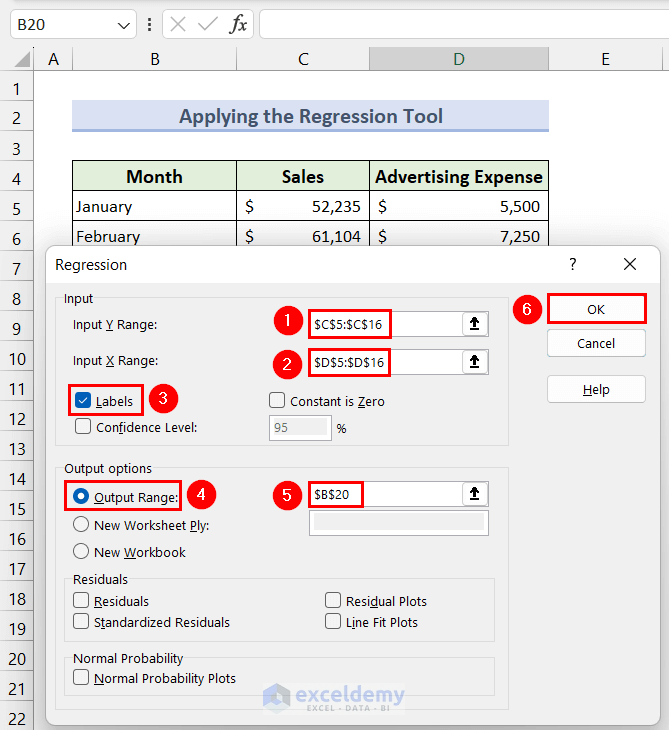
- The Regression dialog box will appear.
- Set the Input Y Range to C5:C16 and Input X Range to D5:D16.
- Check the checkbox for Labels.
- Click the radio button of the Output Range option and set it to Cell B20.
- Click the OK button.
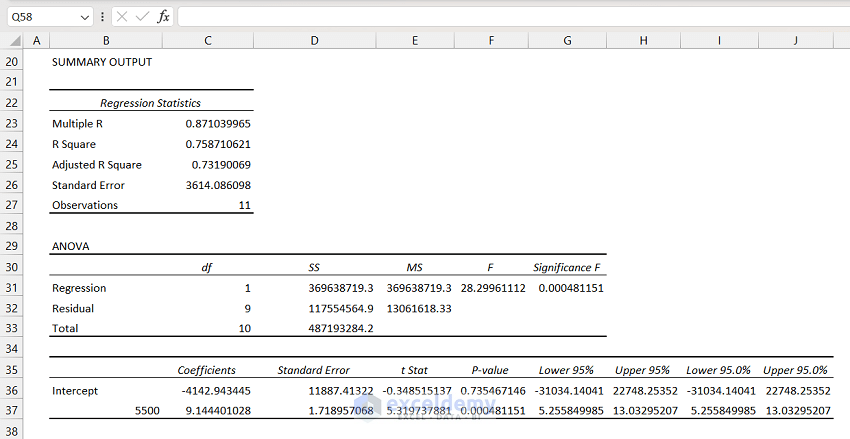
- The following output will appear. It contains a summary of the Regression Analysis.
Read More: How to Find Critical Value in Excel
Case 2 – The Descriptive Statistics Tool
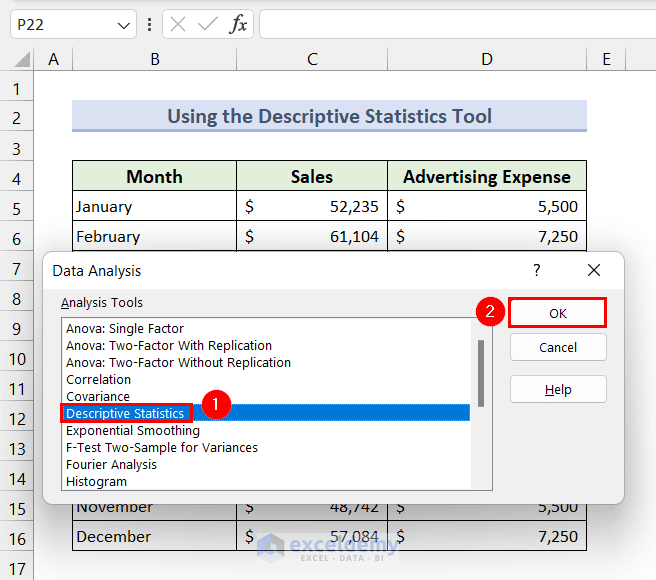
- Go to the Data tab and select the Data Analysis option from the Analyze menu.
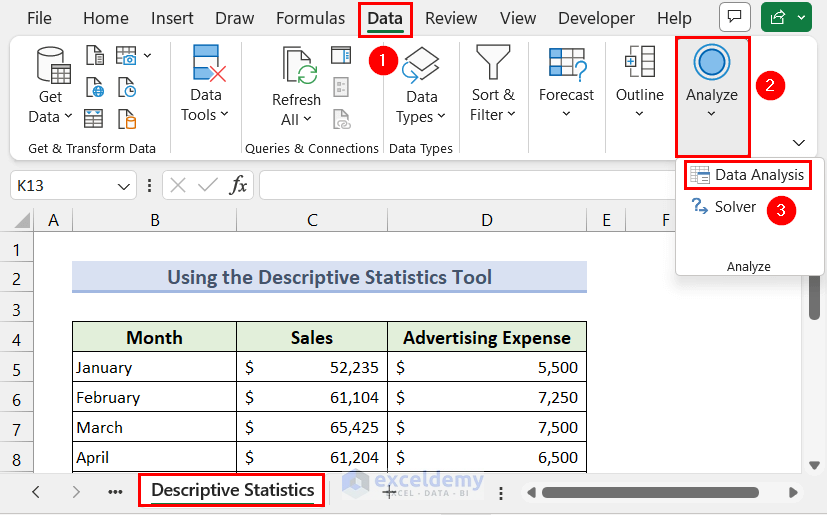
- The Data Analysis dialogue box will pop up. Scroll down and select the Descriptive Statistics option.
- Click the OK button.
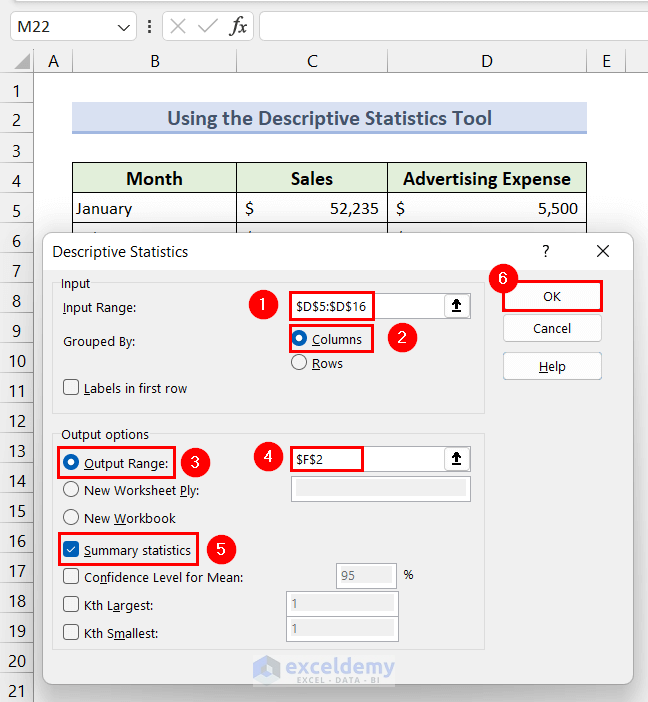
- The Descriptive Statistics dialog box will appear.
- Set the Input Range to D5:D16 (advertising expenses).
- Set the Grouped by option to Column.
- Click the radio button of the Output Range option and set it to F2.
- Check the Summary statistics option.
- Click the OK button.
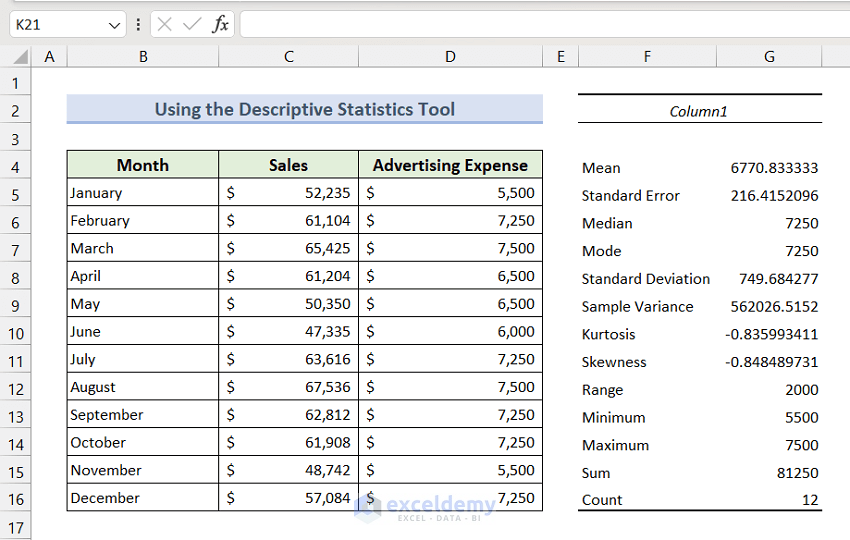
- All descriptive statistics measures for the advertising expenses will appear.
Things to Remember
- Many Excel functions were introduced in Excel 2010, Excel 2016, and Excel 365 versions. Some of the listed functions may not be available in older versions.
- If the Data Analysis ToolPak is not available in Analyze menu of the Data tab, load it from the following directory:
File >> Options >> Add-ins >> Excel Add-ins >> Go >> Analysis ToolPakFrequently Asked Questions
What is the advantage of using Excel for statistical analysis?
Excel has various built-in functions and tools for statistics. These are suitable for quick analyses, data exploration, and basic statistical calculations without requiring specialized statistical knowledge.
How to calculate Margin Percentage in Excel?
To calculate Margin Percentage, we require Revenue (total sales) and Margin (difference between Revenue and Cost of Items Sold) values. Assuming Revenue and Margin values are in Columns C and D respectively, we can apply the following formula to calculate Margin Percentage in Excel.
=(D2/C2)We may also need to apply the Percent Style formatting from the Number menu of the Home tab.
What is the difference between CORREL and PEARSON functions?
In Excel, both the CORREL and PEARSON functions can calculate the correlation coefficient between two sets of data. There is actually no functional difference between these functions, and we can use them interchangeably.
How can I handle missing data and outliers in Excel for statistical analysis?
Excel has functions like IF and FILTER to clean unwanted data. Several Excel functions such as AVERAGEIF, COUNTIF, MAXIFS, MINIFS, TRIMMEAN, etc. can also clean unwanted data and handle outliers. Other functions like TREND, GROWTH, FORECAST, etc. can predict data to handle missing data.
Excel for Statistics: Knowledge Hub
- Bootstrapping in Excel
- Bootstrapping Spot Rates in Excel
- How to Resample Time Series in Excel
- Calculate Margin of Error in Excel
- Scaling Formula in Excel
- Tally in Excel
- Confidence Interval in Excel
- Excel Interpolation
- How to Extrapolate Data in Excel
- How to Create a Survey in Excel
- Excel Demographic Data
- How to Calculate Median in Excel
- Anova in Excel
- How to Perform Regression Analysis in Excel
<< Go Back to Learn Excel
Get FREE Advanced Excel Exercises with Solutions!

Thank you Seemanto, for all the efforts and energy put in. Very useful content and article.
Hello Jerrel,
You are most welcome. Thanks for your feedback and appreciation. Glad to hear our content is udeful to you. Keep learning Excel with ExcelDemy.
Regards
ExcelDemy
I never seen so much precise and useful information about excel data analysis. Thank you so much for your efforts. I love your article very much
Hello Rutaba Fazeel,
I’m really glad you found the article helpful! Thank you for your kind words—it means a lot. If you’d like to explore more tips and discussions, feel free to join our ExcelDemy Forum.
Here you can share ideas and ask questions anytime.
Regards,
ExcelDemy