What Are the Sources for Sample Excel Data for Analysis?
- Online platforms: Various online database platforms such as government websites or public databases are the most common data sources for analysis. This type of data is available in xlsx or CSV file format. You can also use various Excel functions and features to import data from these platforms.
- Built-in Excel Samples: If you go to the Home option of the File tab, you will find various built-in templates. These templates come with some built-in data that we can use for analysis.
- Data Generation Tools: Some online platforms help you generate fictional data when you provide your necessary variable or field names. After generating the required data, you can copy the data and paste it into your worksheet.
11 Ideal Excel Datasets for Analysis
Example 1 – Supermarket Sales Data
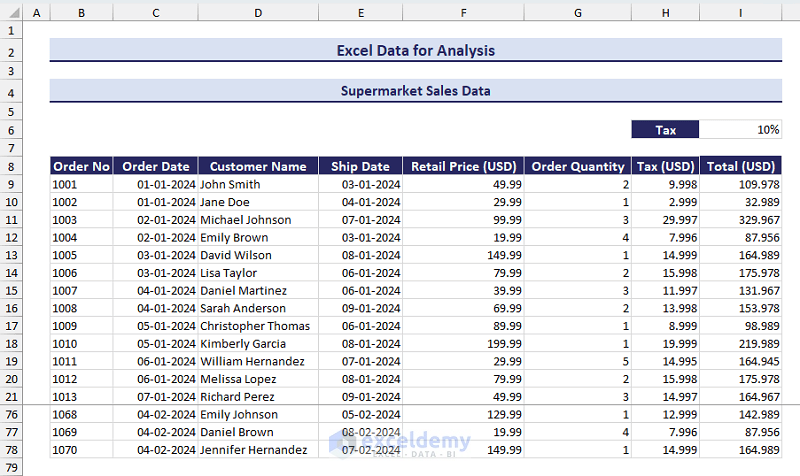
The Supermarket sales data provides details on customers, products, and various specifications for each customer order:
- Order No. – A distinct identifier for every order.
- Order Date – The date on which an order is placed.
- Customer Name – The name of the customer who placed the order.
- Shipment Date – The date on which an order is shipped to the customer.
- Retail Price – The price of the product sold.
- Order Quantity – The number of products ordered by a customer in a single order.
- Tax – A percentage of the purchase price paid to the government.
- Total – Total price including tax paid by the customer.
You can preview the supermarket sales data in the image below:
Here is a list of data analysis tasks you can practice with this dataset in Excel:
- Task 1: Calculate average spending, average order quantity, and average shipment days for an order.
- Task 2: Find the top 5 customer names and total values (based on total spending).
- Task 3: Filter the date based on months and calculate the order quantity and average shipment days for each month. Then, show these in a column or bar chart.
- Task 4: Apply conditional formatting to highlight customers who made repeated purchases in a specified period.
Download the Sample Dataset
Example 2 – Employee Management Data
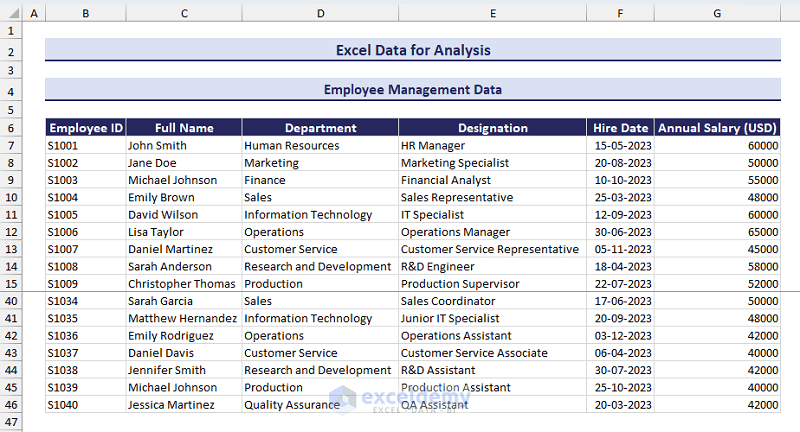
An employee management database contains various information about employees:
- Employee ID
- Full Name
- Department
- Designation
- Hire Date
- Annual Salary
Here is a preview of the employee management data:
Here are some data analysis tasks that you can practice for this dataset:
- Task 1: Determine the average annual salary across all departments and for specific departments. Then, highlight the departments with the highest and lowest average salary.
- Task 2: Find the top 5 employees based on the highest salary values.
- Task 3: Show the salary distribution by designation for each department in a dynamic chart.
- Task 4: Create a search box to find the employees who were hired in a specific month, after a specific date, or in a specified period.
Download the Sample Dataset
Example 3 – Project Management Data
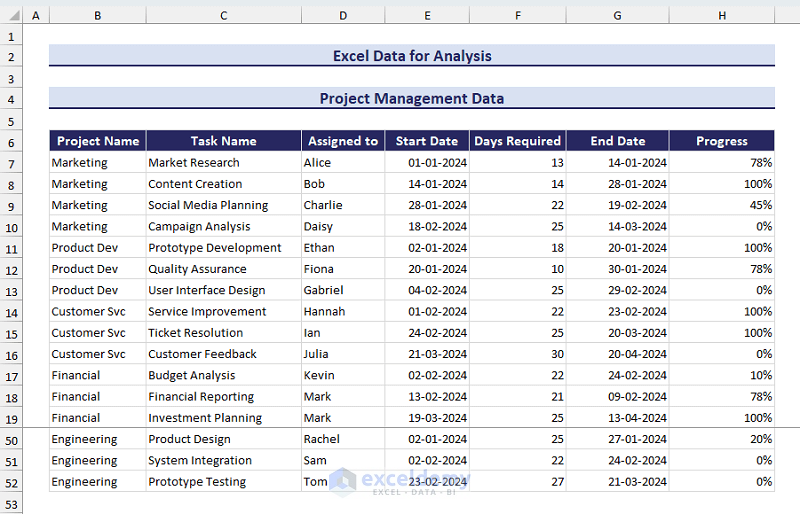
Project management datasets contain various information related to the tasks of every project:
- Project Name
- Task Name
- Assigned to
- Start Date
- Days Required
- End Date
- Progress
The following image shows a preview of our given project management dataset:
Here are some data analysis tasks to practice from the given project management dataset:
- Task 1: Determine the overall progress of each project and show it in a dynamic gauge chart.
- Task 2: Highlight or filter the tasks that are behind schedule based on the current date and task end dates.
- Task 3: Create a dynamic Gantt chart to show the timeline of each task of a project.
Download the Sample Dataset
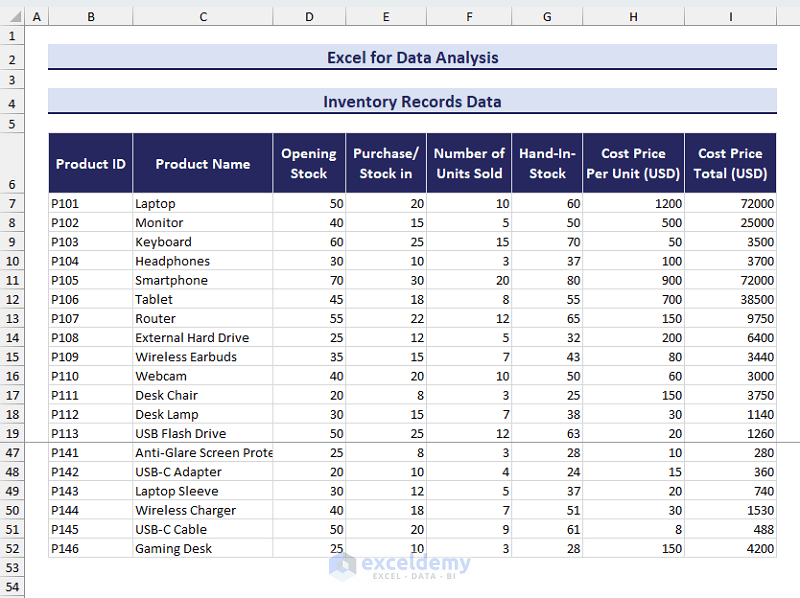
Example 4 – Inventory Records Data
An inventory record dataset is suitable for data analysis practice. It contains comprehensive information on stock levels available and adjustments:
- Product ID – A distinct identifier for each product in the inventory.
- Product Name – Description of the product
- Opening Stock – Quantity of the product available at the beginning of a specific period.
- Purchase/Stock-in – Quantity of the product added to the inventory during the specified period.
- Number of Units Sold – Quantity of the product sold during the specified period.
- Hand-in-Stock – Quantity of product remaining in the inventory after sales.
- Cost Price Per Unit – Cost of each unit product.
- Cost Price Total – Total cost of the hand-in-stock products, calculated by multiplying the cost price per unit value and hand-in-stock quantity.
Here is a preview of the inventory records dataset:
To practice data analysis with this inventory records dataset in Excel, you can complete the following tasks:
- Task 1: Calculate the turnover rate (units sold/stock-in) for each product. Then apply conditional formatting to highlight products with the highest and lowest turnover rates.
- Task 2: Filter or highlight products with low sales and high stock levels.
- Task 3: Filter or highlight products that need immediate purchase/stock-in.
Download the Sample Dataset
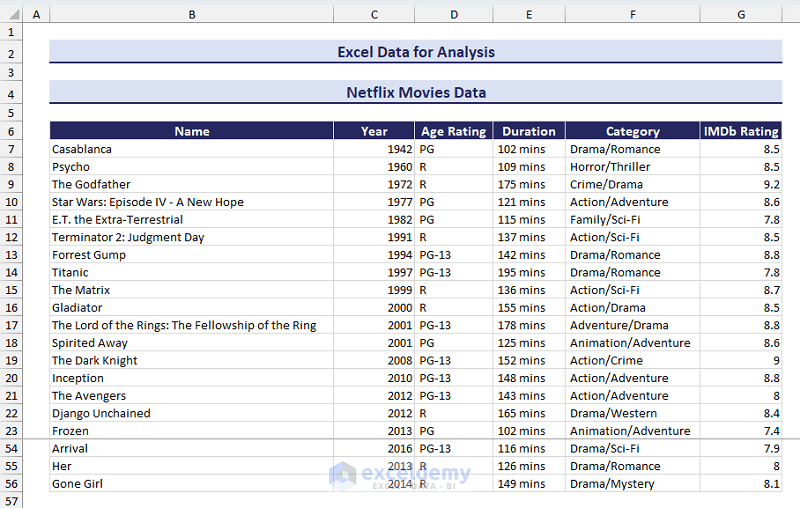
Example 5 – Netflix Movies Data
The movie dataset provided in this section contains the following variables:
- Movie Name
- Release Year
- Age Rating
- Duration
- Category
- IMDb Rating
Here is a preview of the movie dataset:
You can complete the following tasks to practice data analysis for this dataset:
- Task 1: First, find out the average IMDb rating of movies for each genre. Then, plot a column chart or bar chart to compare the average IMDb ratings. Finally, highlight the genre with the highest IMDb rating.
- Task 2: Find the top 5 movies and IMDb ratings.
- Task 3: Filter the data based on decades and find which movies have the highest IMDb rating in each decade.
- Task 4: Calculate the correlation between movie duration and IMDb rating.
Download the Sample Dataset
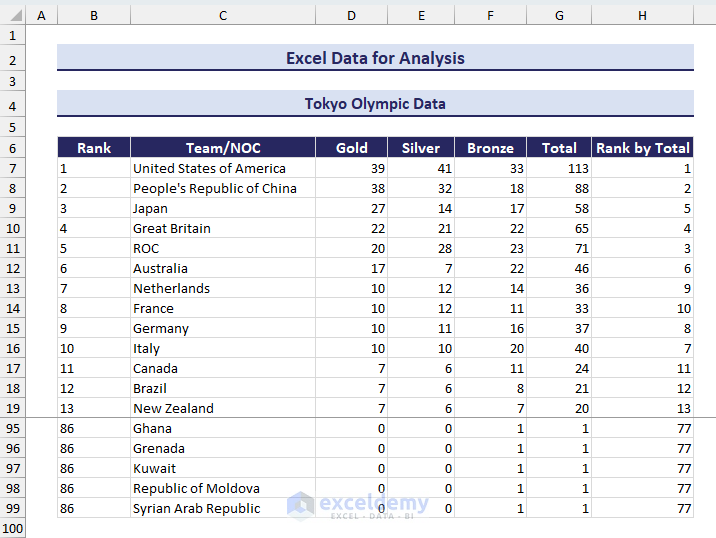
Example 6 – Tokyo Olympics Data
We have the Ranking of each team, Team names, and the count of Gold, Silver, Bronze, and Total medals. You can preview the dataset in the following image:
Here is a list of data analysis tasks that you can perform with this dataset:
- Task 1: Show the distribution of gold, silver, and bronze medals for each country in a chart.
- Task 2: Highlight the teams that have a different ranking based on gold medals and total medals. Show the difference between these in a chart.
Download the Sample Dataset
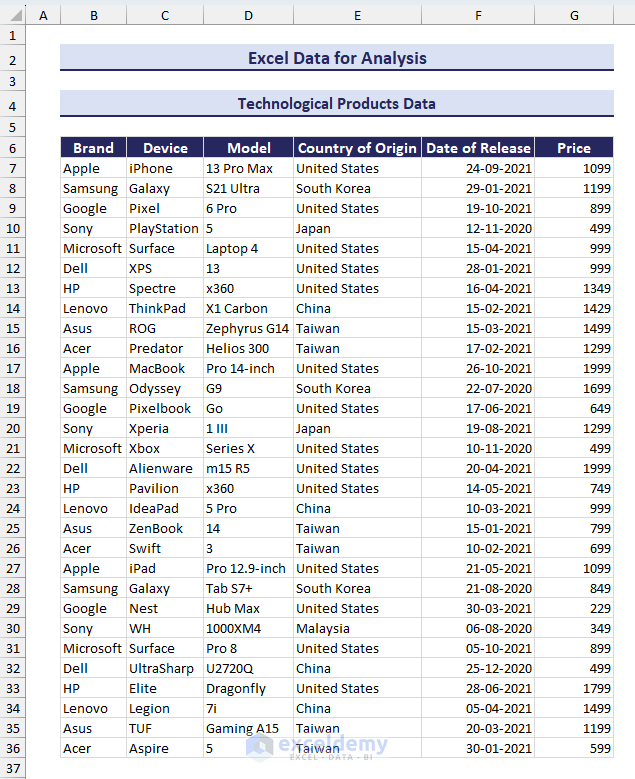
Example 7 – Technological Product Data
The technological product data provided in this section contains the following variables:
- Brand
- Device
- Model
- Country of Origin
- Date of Release
- Price
Here is a preview of the technological product dataset:
Here are some data analysis tasks that you can perform with the given technological products Excel dataset:
- Task 1: Find all the unique brand names. Then, find the most expensive device from each brand.
- Task 2: Find the list of unique origin countries. Then, calculate the average price of products originating from these countries. Finally, highlight the country with the highest-priced products on average.
- Task 3: Create a search box to find all products within a specified price range.
- Task 4: Calculate the average price of products for each brand. Then, show the average prices in a column or bar chart.
Download the Sample Dataset
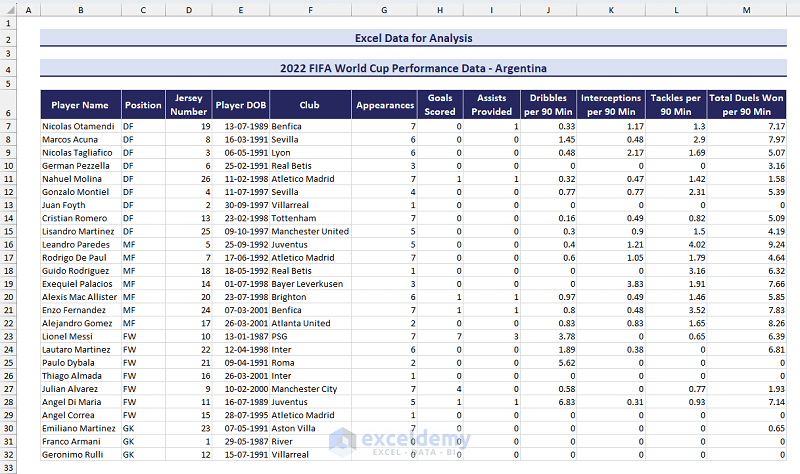
Example 8 – 2022 FIFA World Cup Performance Data
In our sample dataset, we have listed information on each player from the 2022 FIFA World Cup-winning Argentina team:
- Player Name
- Position
- Jersey Number
- Player Date of Birth
- Club
- Appearances
- Goals Scored
- Assists Provided
- Dibbles per 90 Min
- Interceptions per 90 Min
- Tackles per 90 Min
- Total Duels Won per 90 Min
You can preview the dataset from the image below:
Here are some data analysis tasks that you can practice from the dataset given in this section:
- Task 1: Filter the unique playing positions and calculate the average number of goals scored for each position. Then, visualize the data using a column or bar chart.
- Task 2: Filter the players into various age groups (e.g. older than 30, between 25 and 30, under 25) and calculate the performance difference in terms of goals scored and defensive contributions.
- Task 3: Determine the correlation between the player’s age and the number of goals scored or assists provided.
- Task 4: Determine the correlation between player’s jersey number and their performance parameters.
Download the Sample Dataset
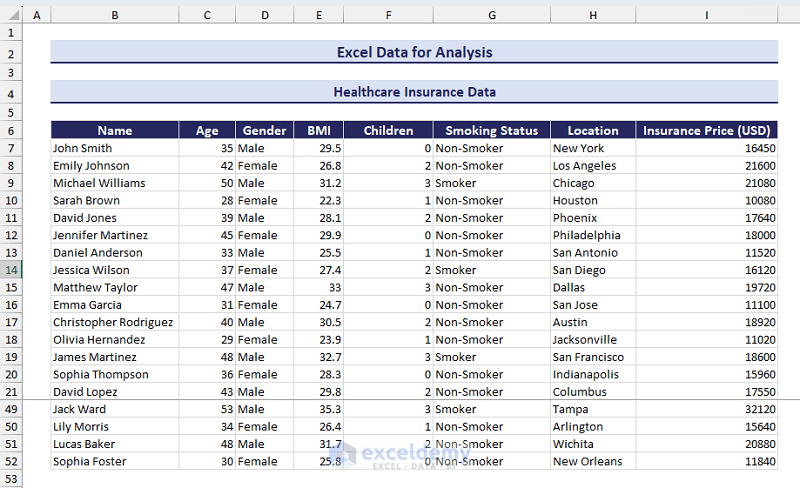
Example 9 – Healthcare Insurance Data
The cost of healthcare insurance varies based on a customer’s current age, BMI, smoking habits, and more:
- Name
- Age
- Gender
- BMI
- Children
- Smoking Status
- Location
- Insurance Price
The following image provides a preview of the healthcare insurance data for analysis:
To enhance your data analysis skills with this dataset, you can solve the following tasks:
- Task 1: Determine the insurance price difference for smokers vs non-smokers.
- Task 2: Determine the correlation between (i) BMI and insurance price and (ii) number of children vs insurance price.
- Task 3: Calculate the average insurance price based on locations. Use conditional formatting to highlight the location with the highest insurance price.
Download the Sample Dataset
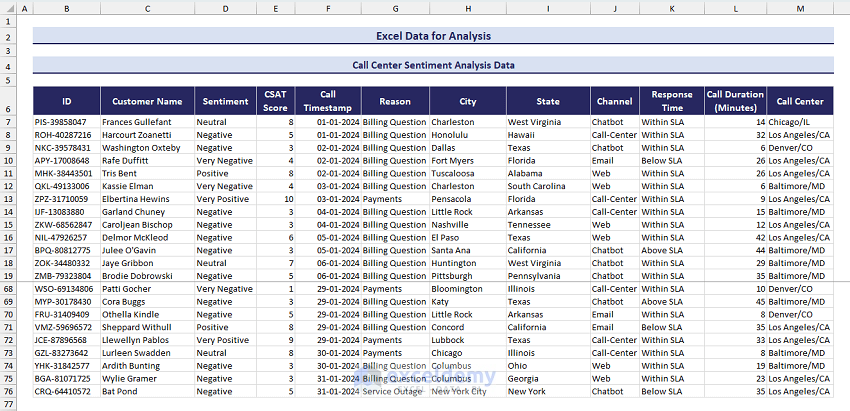
Example 10 – Call Center Sentiment Analysis Data
While providing various types of customer services, call centers receive a wide variety of feedback from customers. The collection of such feedback and customer details makes an ideal dataset for data analysis. We have included the following information:
- ID
- Customer Name
- Sentiment
- CSAT Score
- Call Timestamp
- Reason
- City
- State
- Channel
- Response Time
- Call Duration
- Call Center
You can preview the call center sentiment analysis data in the following image:
You can try the following data analysis tasks using the provided call center sentiment analysis data:
- Task 1: Calculate the percentage of customers for each type of sentiment and show it in a column or bar chart.
- Task 2: Determine the average call duration for each type of sentiment and different channels. Visualize the data using two charts.
- Task 3: Calculate the correlation between CSAT score and call duration.
Download the Sample Dataset
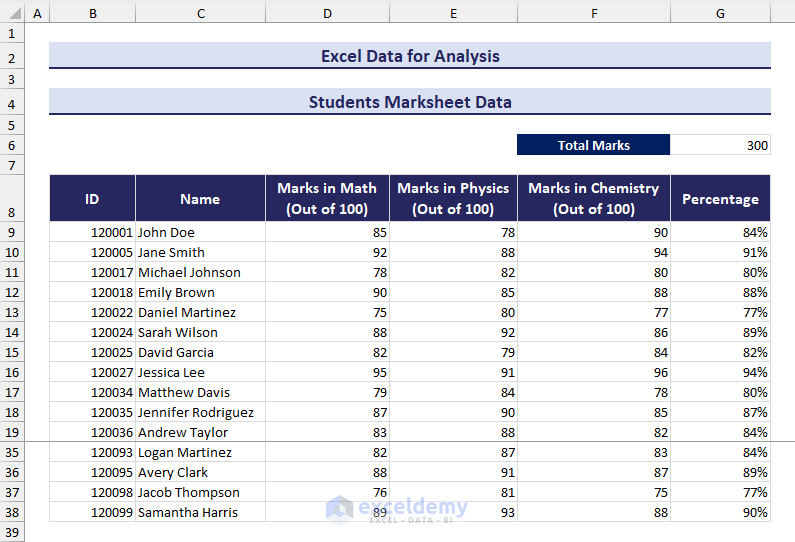
Example 11 – Student Marksheet Data
A student’s marksheet dataset usually contains general information about students and their obtained marks in different examinations. We’ve put a simplified dataset that includes the following:
- ID
- Name
- Marks in Mathematics
- Marks in Physics
- Marks in Chemistry
- Percentage
The following image shows a preview of the student’s marksheet data:
You can practice the data analysis tasks listed below with this dataset to enhance your data analysis skills in Excel:
- Task 1: Filter or highlight the top 5 rows based on the highest percentages.
- Task 2: Create a dynamic gauge chart to show the percentage of a student.
- Task 3: Filter the students who are good in mathematics (scored 80 or more) but bad in Physics (scored 60 or lower).
Download the Sample Dataset
Tips for Organizing Data for Analysis in Excel
- Make a copy of the original data. This will allow you to start from scratch if you make an unintentional mistake.
- Use meaningful column headers for your dataset. This will help in analyzing the content of columns.
- Unmerge all merged cells. Merged cells often create problems while applying Excel formulas and features.
- Freeze the first row (the one with column headers) if you are using a large dataset.
- Clean the data by removing leading or trailing spaces and deleting unnecessary rows and columns.
<< Go Back to Learn Excel
Get FREE Advanced Excel Exercises with Solutions!

do you have the solutions to check against the proper way to solve?
Hello,
These datasets are given to use it for practice purpose. Currently we don’t have any solution of the task. But if you want you can send your completed task, we will review it for you.
Regards
ExcelDemy
Thank you so much for your support I couldn’t solve task 4 for Example 2 – Employee Management Data
how I can send me my work on these files
Hello Kholoud,
You’re very welcome! I’m glad you found the resource helpful. Regarding Task 4 for Example 2 – Employee Management Data, could you share more details about the issue you’re facing?
If you’d like, you can upload your work and questions directly to the ExcelDemy forum. This way, I or other community members can take a closer look and assist you further. Here’s the link to the forum: ExcelDemy Forum.
Regards
ExcelDemy
Can I get solutions to the above problems, because I am new to excel and I am currently unable to solve the questions, Please help. Thank you.
Hello Arun,
Thank you for your comment! The exercises are designed for user practice to help strengthen Excel skills through hands-on problem-solving.
If you face any difficulty with a specific task or question, please share the details here; we’ll gladly guide you through the steps to solve it.
Regards,
ExcelDemy
Hello Mam! How are
any tips for freelancing
Hello Hussain khan
Thanks for your question. If you’re interested in freelancing, focus on mastering one skill first rather than trying to learn everything at once. Build a small portfolio with a few real or practice projects, keep learning consistently, and don’t get discouraged if getting your first client takes time.
You can follow this road map to learn Excel from beginning: Learn Excel
Patience and consistency are key. Wishing you all the best on your freelancing journey!
Regards,
ExcelDemy
Thanks for your immediate reply, I have solved the 1st problem task 2 where I can get top 5 values, using large function and their respective names with index match function. But when I am using pivot table to the data which you have given I am getting all 5 different values. Whereas using above two functions. I am getting 1st value different and the 2nd, 3rd, 4th and 5th value as same. Kindly help. Thank you.
Hello Arun,
Great progress—and you’ve spotted exactly why your formula result doesn’t match the PivotTable. The PivotTable is first aggregating Total by Customer Name and then sorting, while your LARGE is working on row-level totals, so duplicates (or multiple orders per customer) cause repeated values.
Here’s a quick fix:
Option 1: One-shot Dynamic Formula (Microsoft 365)
Customer Name in C2:C1000
Total in H2:H1000
In an empty cell:
=LET(
u, UNIQUE(C2:C1000),
s, SUMIF(C2:C1000, u, H2:H1000),
top, SORTBY(HSTACK(u, s), s, -1),
TAKE(top, 5)
)
This returns a 2-column spill with the Top 5 customers and their sum of Total, exactly like the PivotTable.
Option 2: Classic 2-Step (works in older Excel)
Build a helper list of unique names (e.g., list or use Data → Remove Duplicates).
Next to each name use:
=SUMIF($C$2:$C$1000, A2, $H$2:$H$1000)
Sort that helper table by the summed column (Largest to Smallest) and take the top 5.
Regards,
ExcelDemy