This is an overview.
Download Practice Workbook
Download the Excel file and practice.
What Is a Flowchart?
A flowchart is a visual diagram that shows the steps needed to solve a problem or complete a task. It uses different shapes and symbols to represent actions, decisions, and input/output.
Shapes Used in a Flowchart
Use different shapes to create the flowchart:
- Go to the Insert tab >> in Illustrations >> go to Shapes.
- Hover the cursor to get information on each shape.
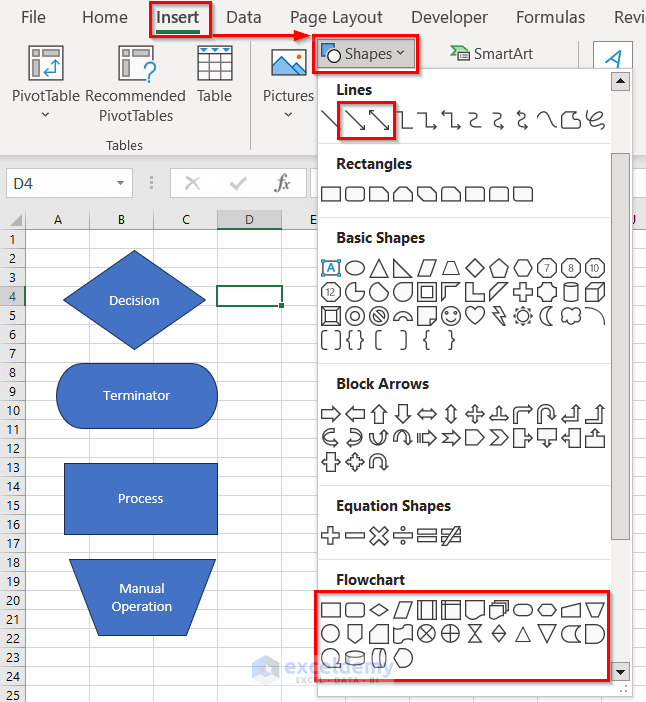
- The flowchart starts with a beginning symbol and ends with an ending symbol, the terminator.
- Actions or tasks are represented by rectangles.
- Decisions are shown as diamonds and involve making choices.
- The Isosceles trapezoid represents a Manual Operation.
- Connectors indicate continuation on another page or section. It is represented by a small circle or rectangle with a letter or number.
- Input/output is represented by parallelograms.
- Arrows connect the symbols and show the flow of the process. (go to the Lines section).
How to Create a Flowchart in Excel:
1. Using Shapes to Create a Flowchart
- Go to the Insert tab >> Illustrations >> Shapes >> Flowchart >>Terminator >> drag your cursor to the target place and insert the Terminator.
- Place the shapes. Here, Terminator >> Decision >> Process >> Terminator.
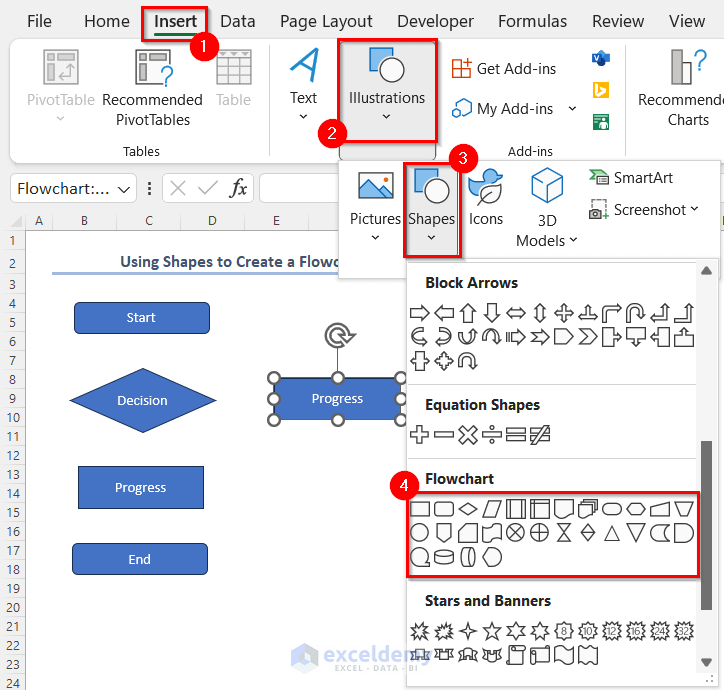
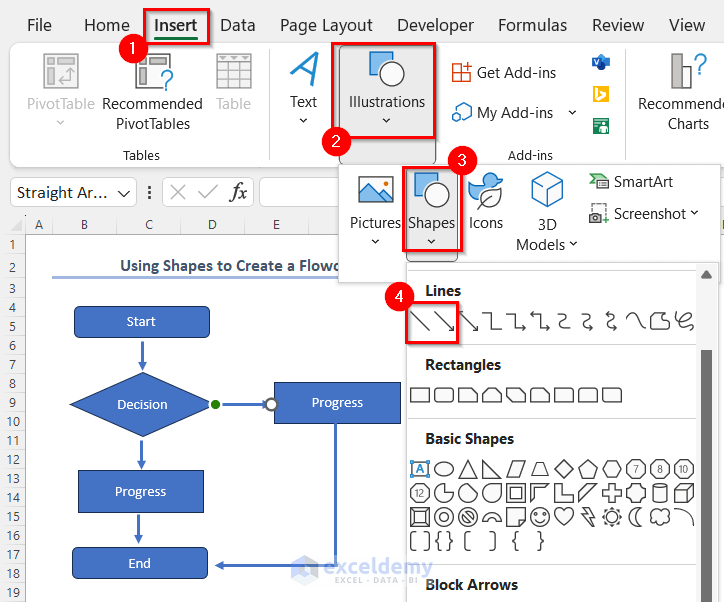
- In the Insert tab >> Illustrations >> Shapes >> Lines >> select Line Arrow >> drag your cursor to show the flow and place the Line Arrow.
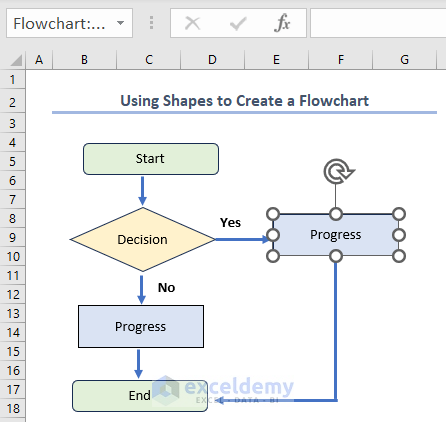
- To change the direction, use Line with the Line Arrow. Below, a Line is used to show the flow from Progress to End.
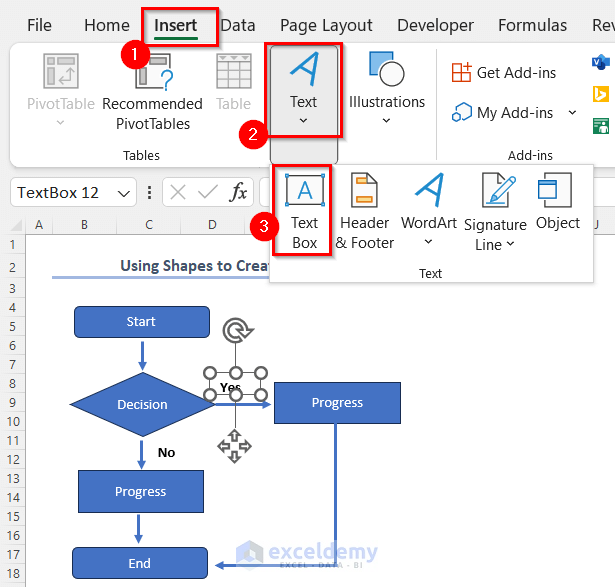
- Go to the Insert tab >> Text >> select Text Box >> insert the box and enter Yes/No.
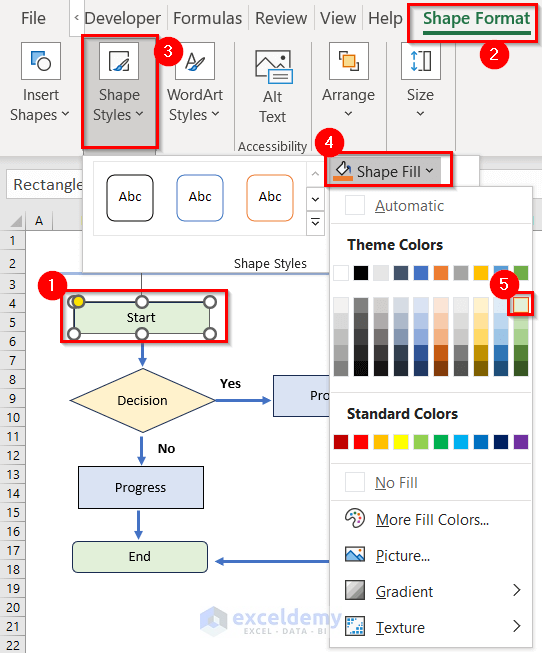
- You can change the shape color.
- Select the shape >> go to Shape Format (Contextual tab) >> Shape Styles >> Shape Fill >> set a color.
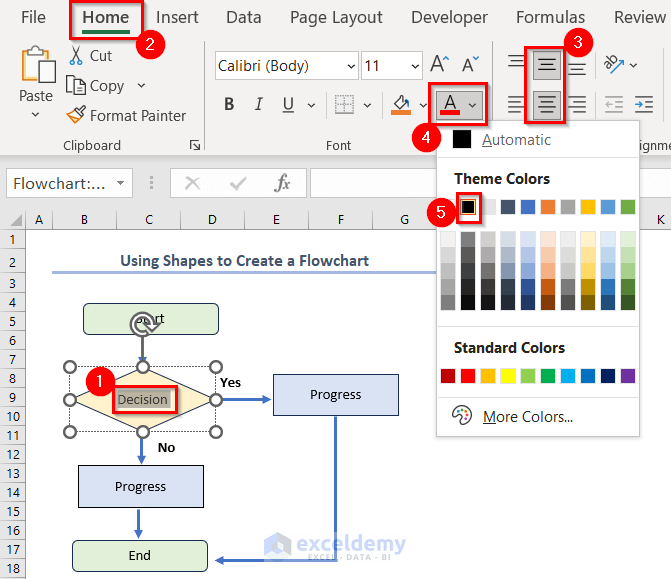
- You can change the Font color.
- Select the text inside the shape >> Home tab >> Alignment >> Middle and Center alignment >> Font >> select Font Color >> change the color.
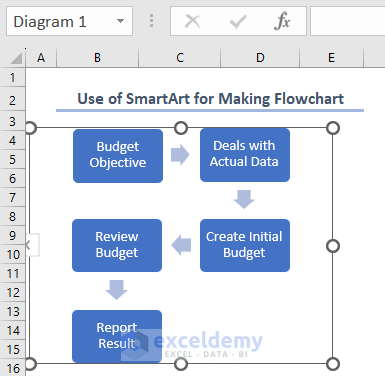
This is the output.
2. Using SmartArt in a Flowchart
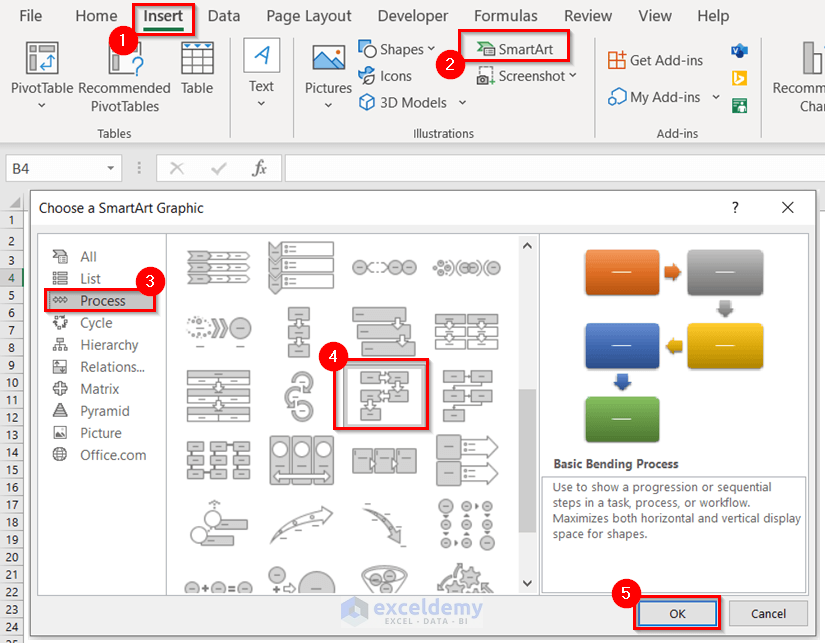
- Go to the Insert tab >> click SmartArt >> in Choose a SmartArt Graphic >> select Process >> choose a type >> click OK.
- Double-click the shape >> enter the steps.
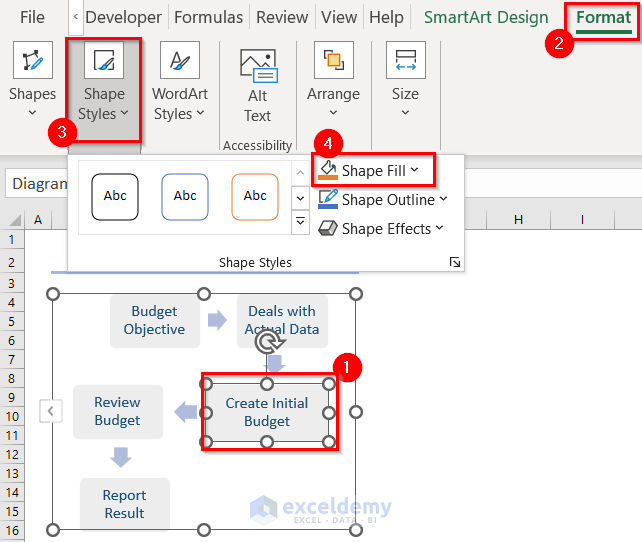
- To change the shape color, click the shape >> Format >> Shape Styles >> Shape Fill >> change the color.
Read More: How to Create a Flowchart in Excel
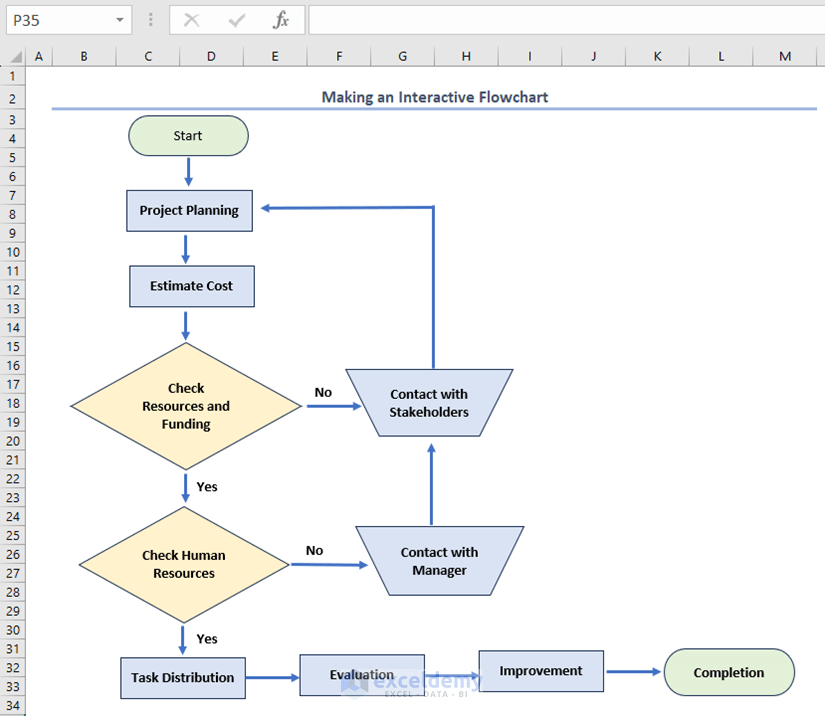
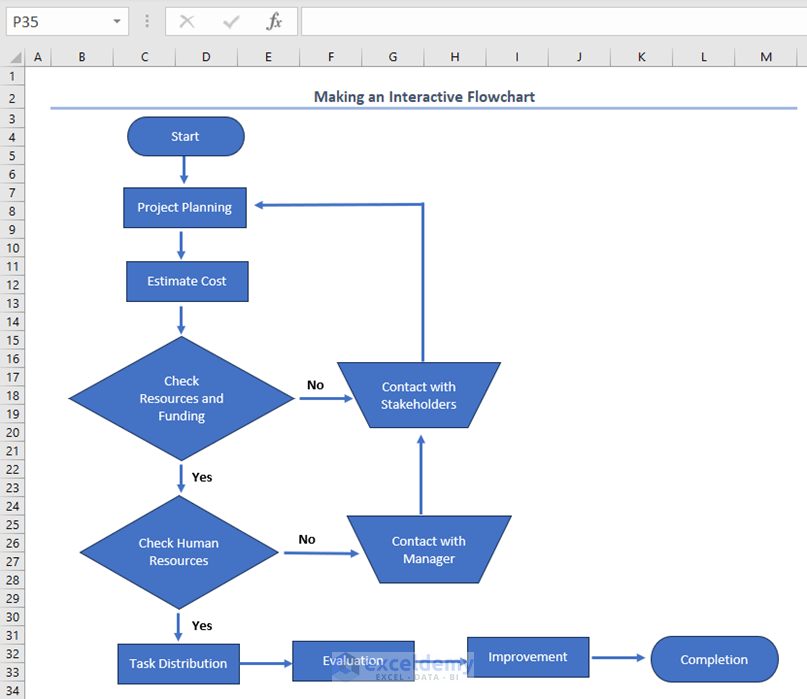
Creating an Interactive Flowchart in Excel
- Go to the Insert tab >> Illustration >> Shapes >> drag the shapes. Keep multiple decision-making options with alternate solutions to make it interactive:
Draw a Swimlane Flowchart in Excel
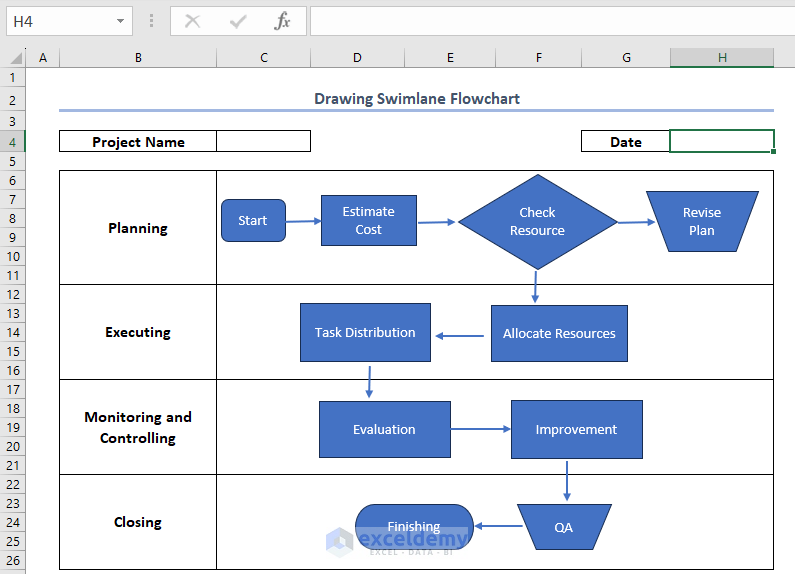
Swimlane flowcharts have different sections with single or multiple steps of the flowchart. These sections specify work distribution among individuals, places, or stages.
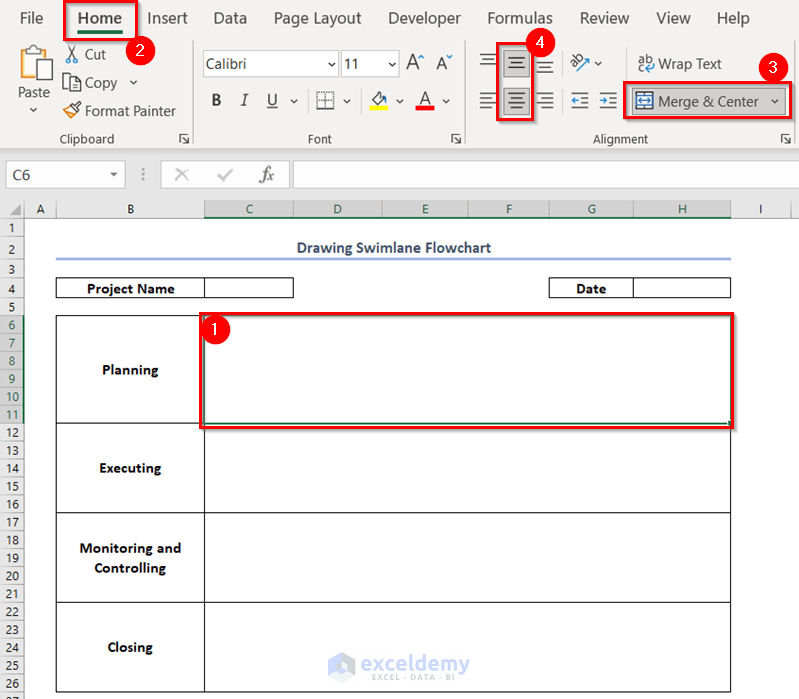
To merge cells and show the steps in a section:
- Select cells >> Home tab >> Alignment >> Merge & Center >> choose Middle and Center alignment.
- Divide work into sections to create your own swimlane flowchart.
- These are sample steps of a project. Keep the steps maintaining the sections. In the Insert tab >> go to Shapes >> use the shapes of the Flowchart segment to draw the flowchart.
Read More: How to Create a Swimlane Flowchart in Excel
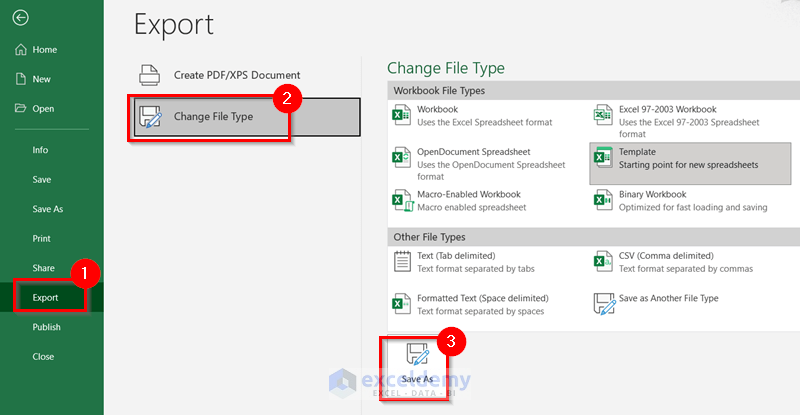
How to Save an Excel Flowchart as a Template
- Go to the File tab >> click Export >> Change File Type >> Save As.
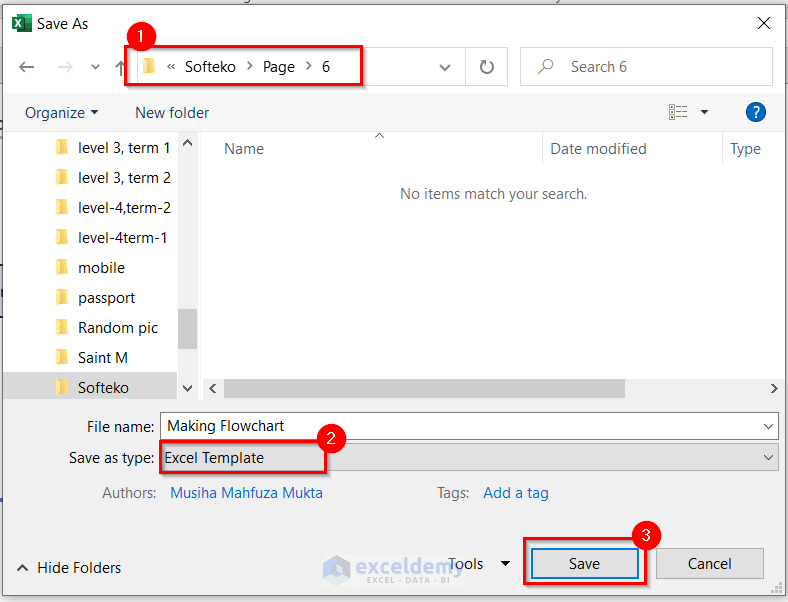
- Set the location >> save as Excel Template >> click Save.
Frequently Asked Questions
1. How do I delete steps from a flowchart in Excel?
Select the shape you want to delete and press DELETE.
3. How do I import a flowchart from Excel into Word?
Select the entire flowchart by pressing CTRL>> press CTRL+C to copy >> go to the Microsoft Word file >> press CTRL+V.
Flowchart in Excel: Knowledge Hub
<< Go Back to Learn Excel
Get FREE Advanced Excel Exercises with Solutions!
