What Is a Swimlane Flowchart?
A Swimlane Flowchart is a dynamic tool. It allocates tasks and defines deadlines in a business process. This particular flowchart gives a visual of the process of a business. It visibly separates task sharing and responsibilities for the sub-processes of a business process.
Components of a Swimlane Flowchart
- Start/End: The oval depicts the beginning and end of any procedure.
- Process: The rectangular boxes in the flowchart show different processes of activity.
- Decision: A diamond shape in the diagram represents the query in the flowchart.
- Input/Output: The parallelogram with curving curves shows data entering and departing the flowchart.
How to Create a Swimlane Flowchart in Excel: Step-by-Step Guideline
STEP 1 – Create Swimlane Containers
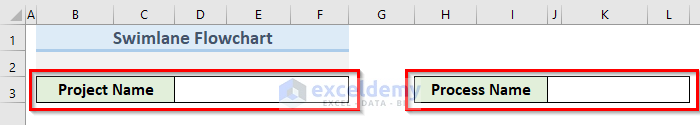
- Create two sections like the following image. The two sections will represent Project Name and Process Name. We will give input in these two sections as per our project.
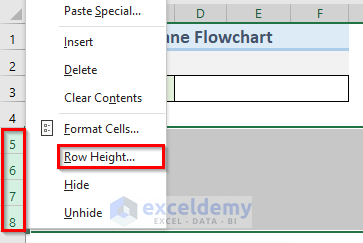
- Select row numbers 5 to 8. Right-click on the selected rows.
- Click on the option Row Height.
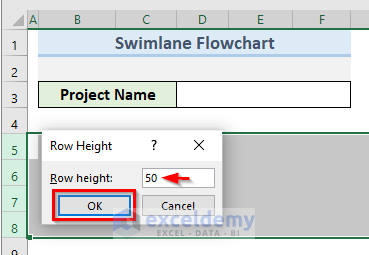
- Set the value 50 in the Row height input field.
- Click on OK.
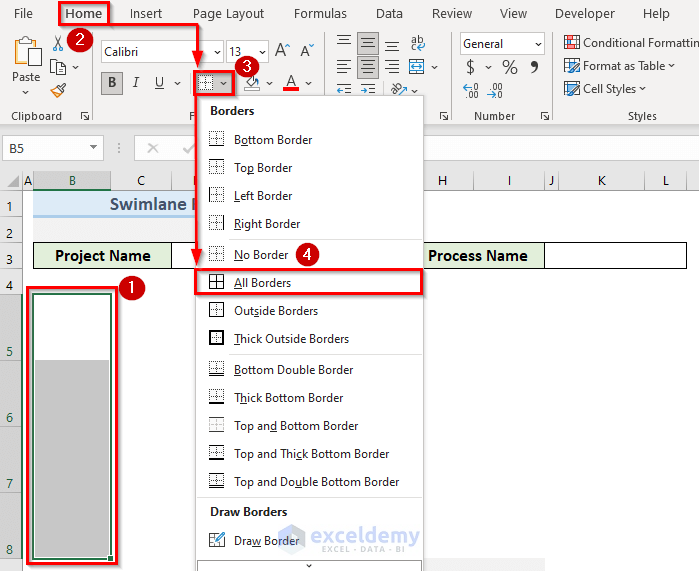
- Select cells B5:B8.
- Go to the Home tab.
- Click on the Borders icon and select All Borders from the drop-down menu.
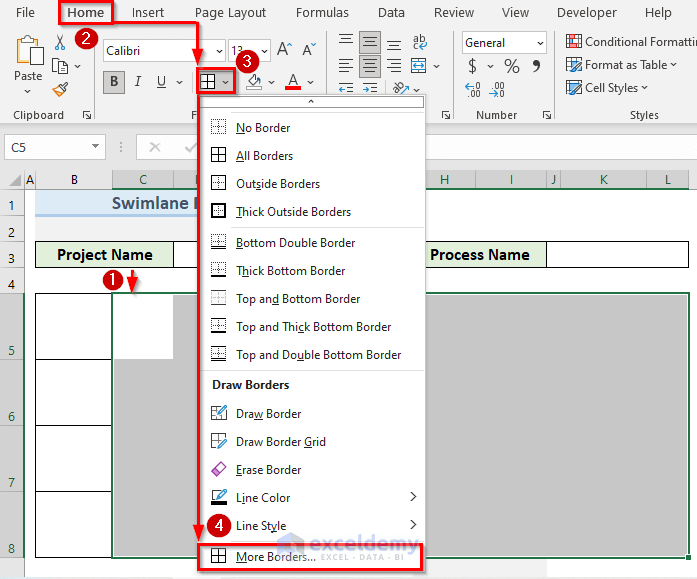
- Select cells C5:L8.
- Go to the Home tab.
- Click on the Borders icon and select More Borders from the drop-down menu.
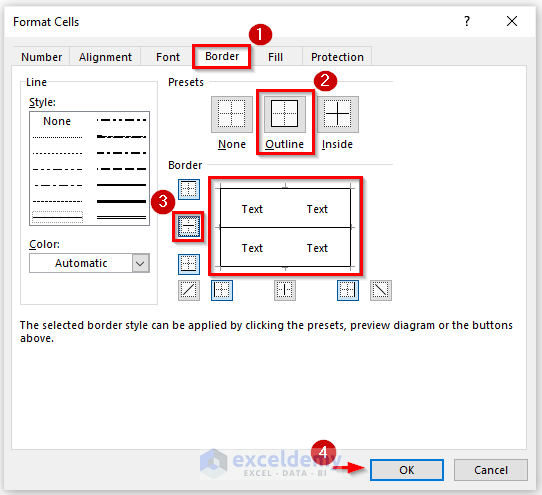
- This will open the Format Cells dialogue box.
- Go to Border.
- Select the border style Outline from the Presets section.
- From the Border section, only select the middle horizontal line.
- Click on OK.
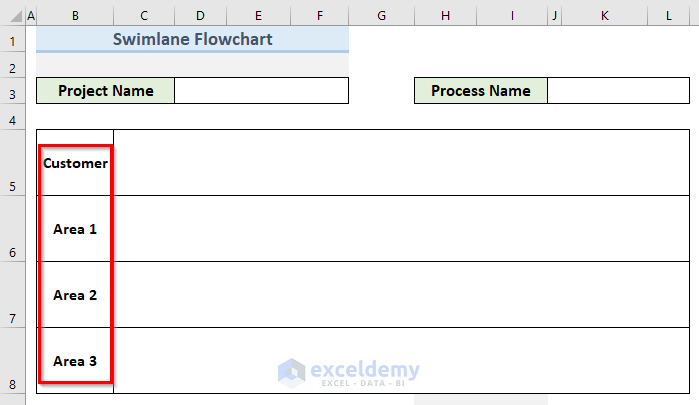
- The outline of our swimlane flowchart is ready.

Read More: How to Create a Flowchart in Excel
STEP 2 – Label Containers
- Select cell B5. Label Customer in that container.
- Name the containers in cells B6, B7, and B8. We put Area 1, Area 2, and Area 3.
STEP 3 – Create a Swimlane Flowchart
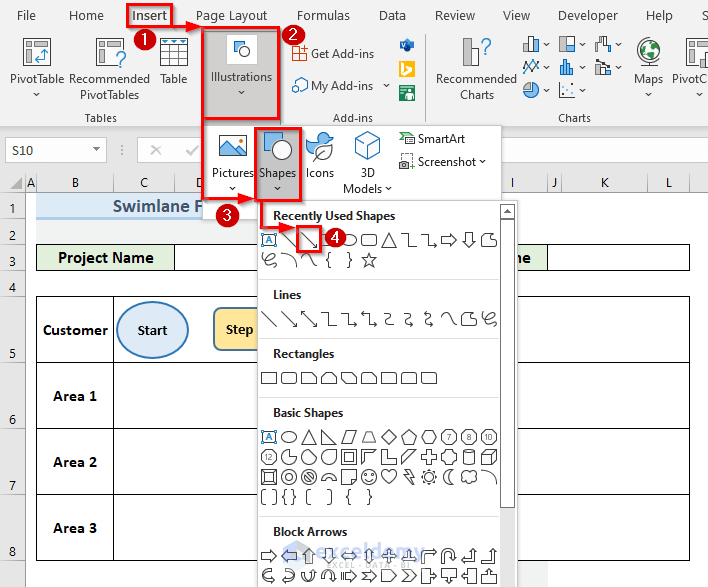
- Go to the Insert tab.
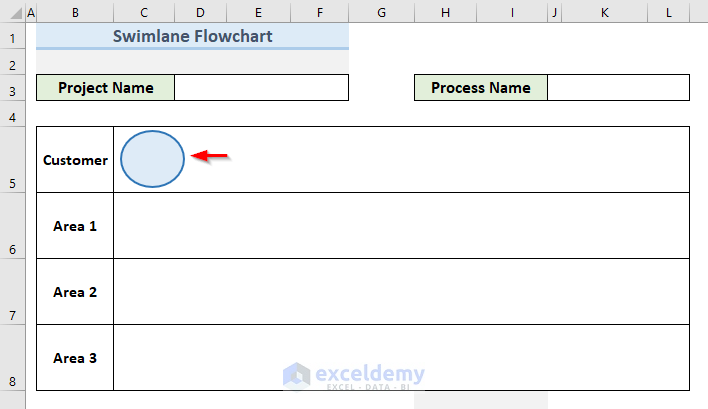
- Select Illustrations, then choose Shapes and pick the Oval shape.
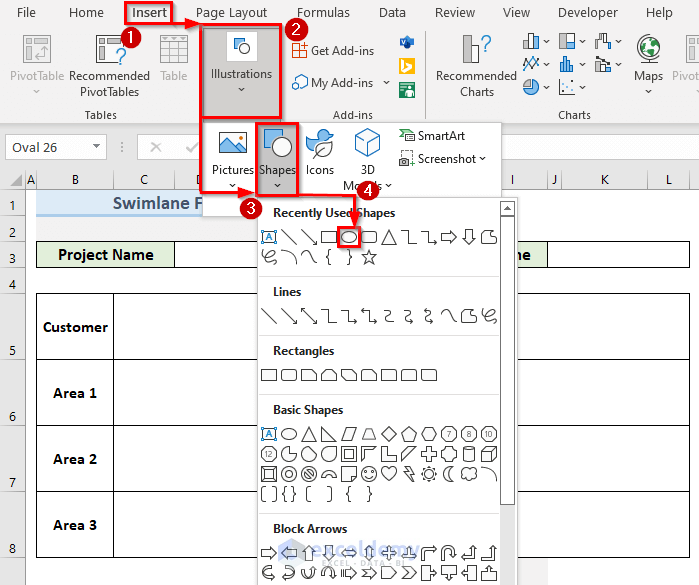
- Click on cell C5 to insert that Oval shape in the Customer container.
- Right-click on the Oval shape in cell C5.
- Select the option Edit Text from the context menu.
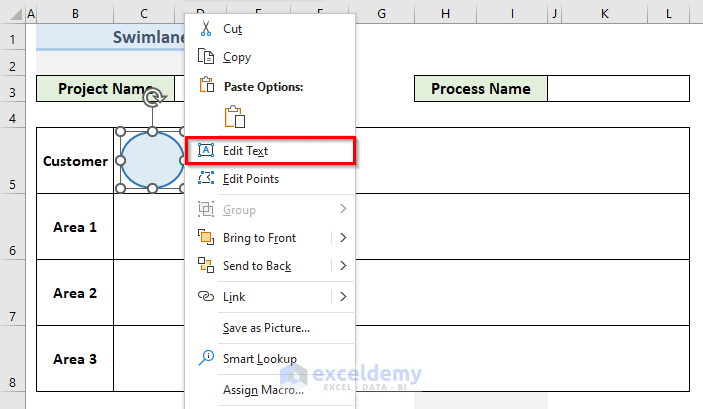
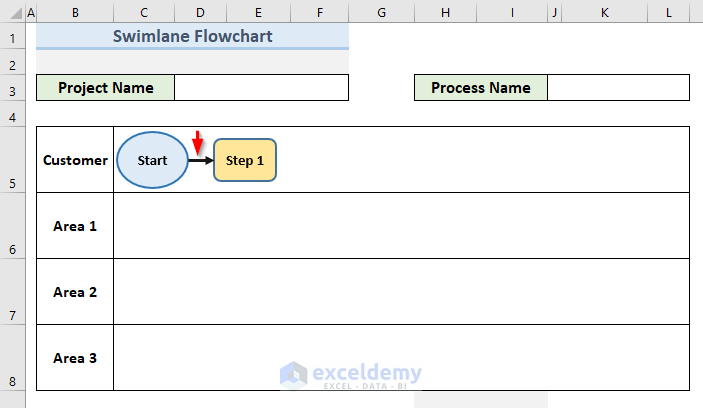
- Type Start in the Oval shape.
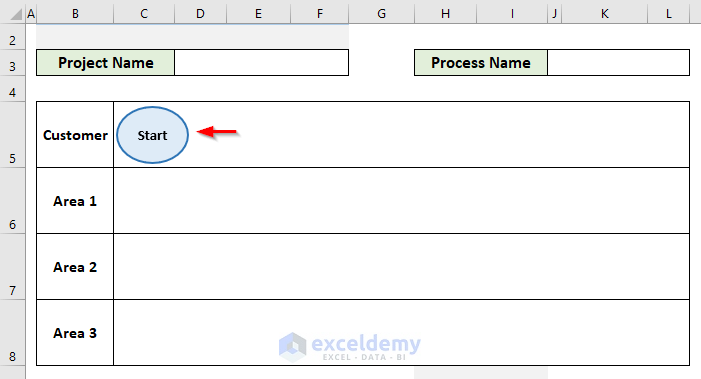
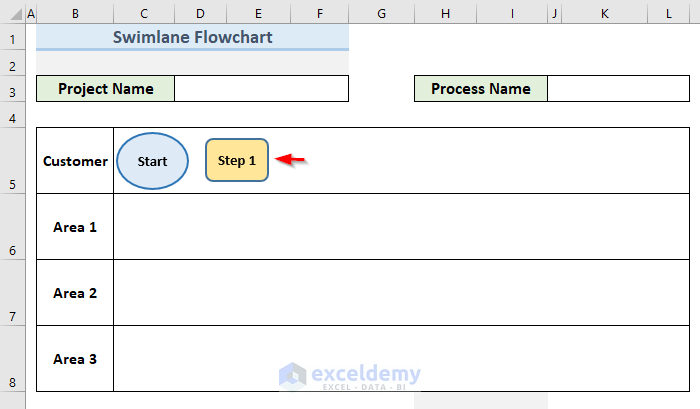
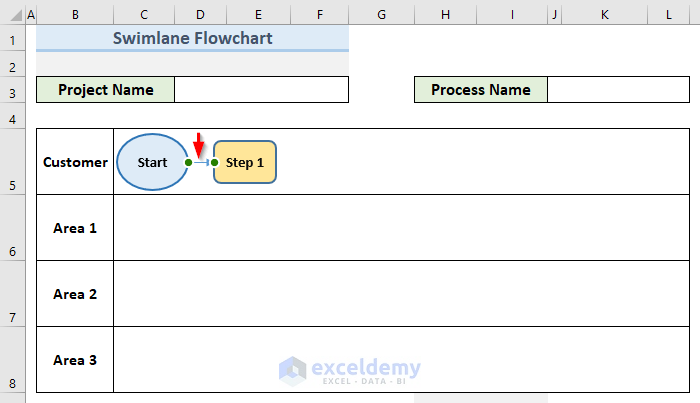
- Insert a ‘Rectangle: Rounded Corners’ beside Start.
- To connect the two shapes, we will insert an arrow.
- Go to Insert Shape.
- Select the Line Arrow shape from the drop-down menu.
- Insert an arrow to connect the Oval shape and Rectangular Shape.
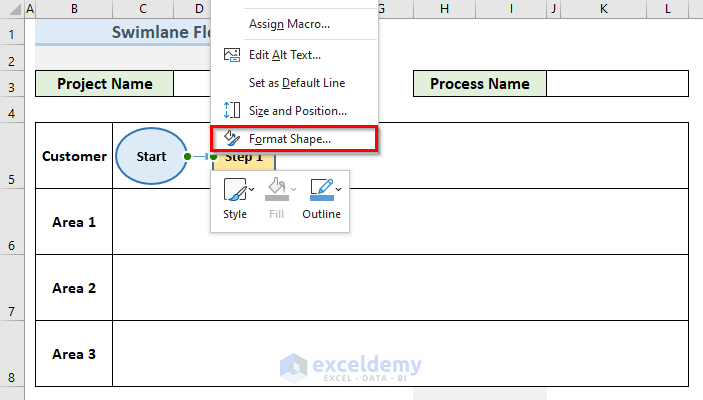
- Right-click on the Line Arrow.
- Select the option Format Shape.
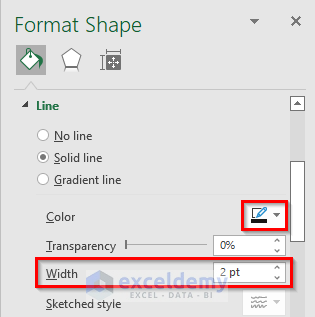
- From the Format Shape box, set the value of width as 2 for Line Arrow.
- Set the color of the Line Arrow to Black.
- We will get the Line Arrow like the following image.
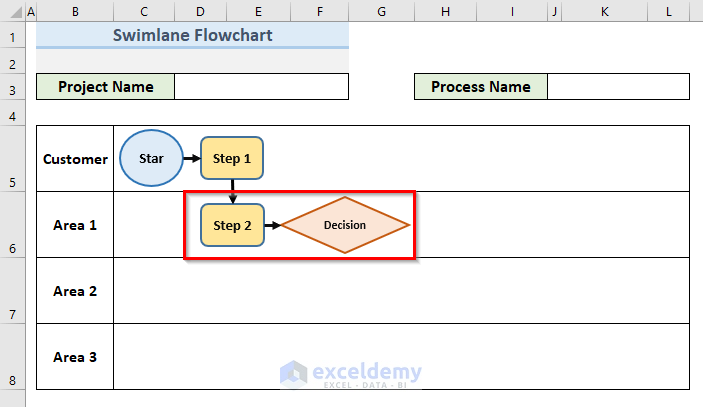
- Insert a ‘Rectangle: Rounded Corners’ shape and Diamond shape in the ‘Area 1’ container.
- Connect the shapes with Line Arrow like the following image.
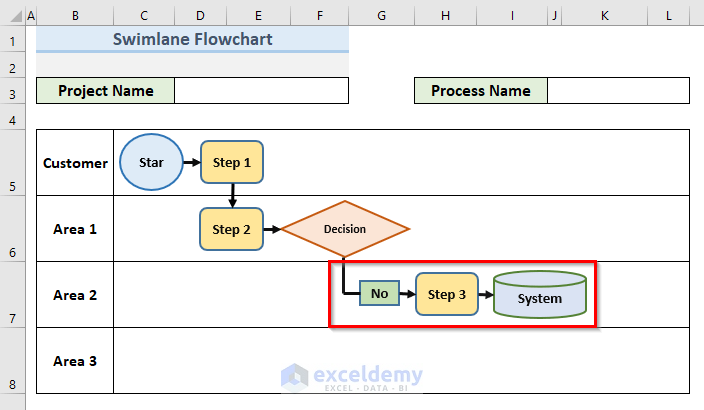
- Go to the ‘Area 2’ container.
- Insert a Rectangle, Rectangle: Rounded Corners, Cylinder shape in that container.
- Rename the shapes No, Step 3, and System
- Connect the shapes with Line Arrow like the image below.
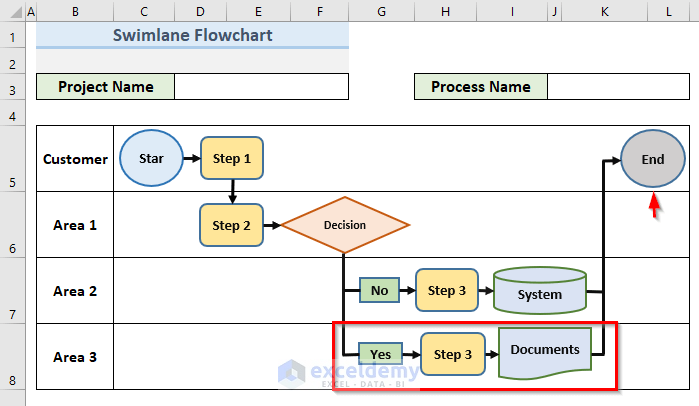
- In container ‘Area 3’ insert a Rectangle, Rectangle: Rounded Corners, Flowchart: Document shape.
- Rename the shapes Yes, Step 3, and Documents.
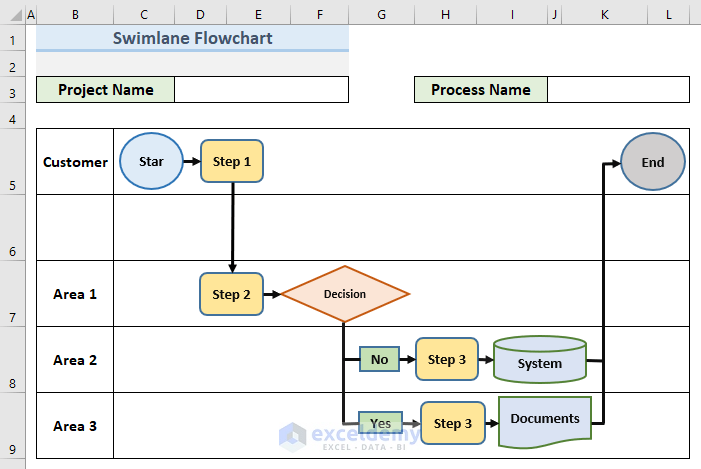
- Create a shape End in ‘container 1’.
- Connect this shape to ‘container 3’ and ‘Container 4’ with Line Arrow.
Read More: How to Make a Yes No Flowchart in Excel
Swimlane Flowchart Adjustability in Excel
STEPS:
- Select Row 6.
- Right-click on the selected row.
- Select the option Insert.
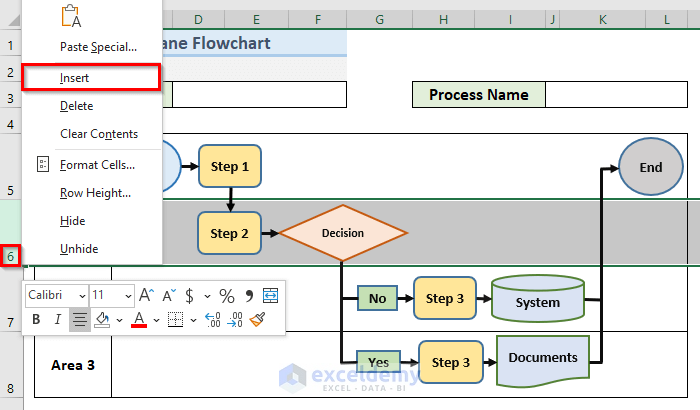
- We get a new row in our swimlane flowchart.
- Everything in the flowchart will adjust like the following image.
Download the Template
Related Articles
<< Go Back to Flowchart in Excel | Learn Excel
Get FREE Advanced Excel Exercises with Solutions!
