Data Analysis with Excel

Build a Cohort Analysis Tool in Excel for Data Science

In this tutorial, we will build a cohort analysis tool in Excel for data science.

Advanced Data Analysis with Statistical Functions and Tools in Excel

This tutorial will dive into Excel's statistical functions and tools for advanced data analysis.

Building a Social Media Analytics Dashboard in Google Sheets

In this article, we will build a social media analytics dashboard in Google Sheets.

Data Model in Excel (A Complete Guide)

  Download Practice Workbook Data Model.xlsx What Is a Data Model in Excel? The Excel Data Model is a special kind of data ...

Create Relationships in Excel (3 Effective Ways)

In Excel, we create relationships between tables that are logically related to each other. It helps us to avoid data redundancy as well as fetching ...

Quick Analysis Tool in Excel (Open and Use)

In this article, we will show you the different features of the Quick Analysis Tool in Excel. There are 5 core features of the Quick Analysis Tool. ...

How to Add Tags in Excel?

In this article, you will learn how to - Merge IF, SEARCH, and ISNUMBER functions to add tags in Excel - Use the Excel Filter option to add tags ...

Rearranging in Excel

Rearranging in Excel: Knowledge Hub How to Rearrange Columns Alphabetically in Excel How to Automatically Rearrange Columns in Excel How ...

Organize Data in Excel: A Complete Guide

We often need to organize data in Excel while working for easy data management, better data analysis, better visualization, and more efficiency. ...

Data Analysis in Excel (A Comprehensive Guideline)

In this article, we will learn how to analyze data in Excel, including: Different Excel functions, such as VLOOKUP, INDEX-MATCH, SUMIFS, CONCAT, ...

Create, Edit, and Delete a Data Table in Excel

This is an overview: Download Practice Workbook Download the practice workbook. Data Table Excel.xlsx What Is a Data Table in ...

How to Perform Excel Data Analysis: Forecasting (3 Easy Ways)

Download Practice Workbook Data Analysis Forecast.xlsx Method 1 - Using Moving Average Method for Forecasting Data Analysis in Excel ...

How to Do Excel Data Analysis Correlation (4 Easy Ways)

Here's a sample example of using the correlation coefficient to analyze data. Download the Practice Workbook Download this practice ...

How to Plot Least Squares Regression Line in Excel (5 Methods)

The Least Squares Regression Line - A Statistical Tool for Analyzing Relationships The least squares regression line is a widely used statistical ...

How to Create a 4-Variable Data Table in Excel (with Easy Steps)

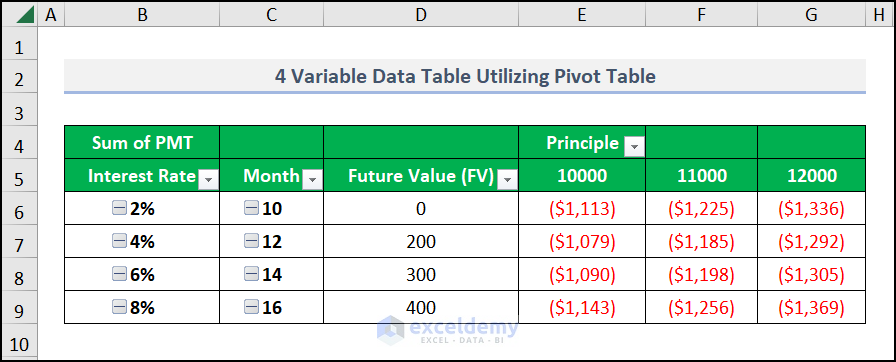
Four variables mean the dataset needs to have 4 independent variables. We will calculate the final output, which is a dependent variable. We have a ...

Close the CTA

Advanced Excel Exercises with Solutions PDF


ExcelDemy
Logo