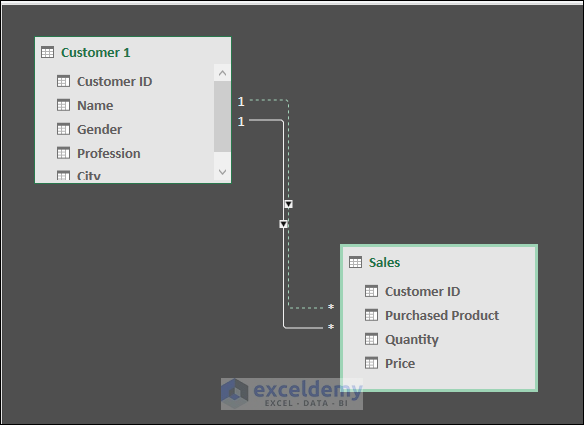
In Excel, we create relationships between tables that are logically related to each other. It helps us to avoid data redundancy as well as fetching data from multiple tables simultaneously. Here’s an example of table relationships.

Download the Practice Workbook
What Are the Types of Data Relationships?
- One-to-One Relationship: Each record in a table connects with exactly one record in another table. In a company, an employee normally has only one manager. This relationship between employee and manager is a one-to-one relationship.
- One-to-Many Relationship: It refers to a connection between two tables where each record in the first table has a connection with multiple records in the second table. But, all the records in the second table can have only one connection with the first table. An ideal example is a teacher teaching in a class. The relationship between the teacher and students is an example of a one-to-many relationship.
- Many-to-Many Relationship: Suppose, the records in the first table are connected to more than one record in the second table and vice versa then it is a many-to-many relationship. The most common many-to-many relationship is the relationship between products and customers. A customer may purchase more than one product. Also, multiple customers may buy the same product. So, the relationship between them is a many-to-many relationship.
How to Create Relationships in Excel
Method 1 – Create Relationships Using a PivotTable
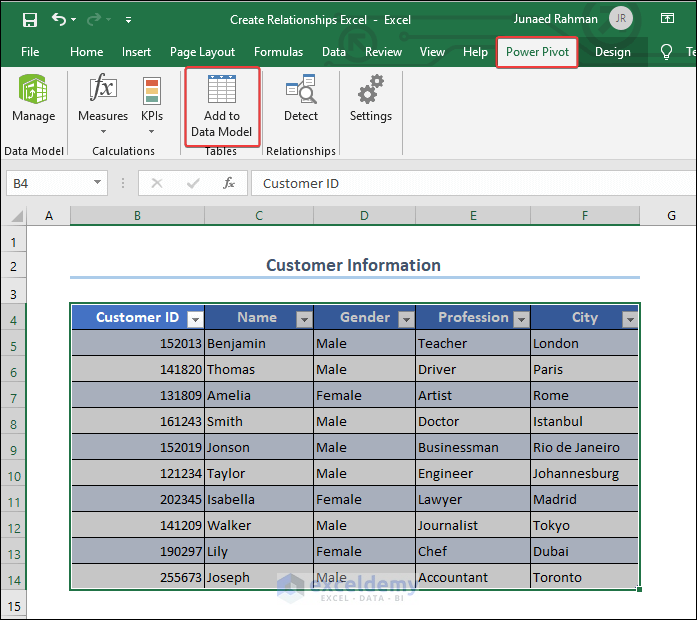
We have 2 tables in our worksheet. The first one contains information about customers and the second one is regarding their purchase information.
- Convert your dataset to a table by pressing Ctrl + T.
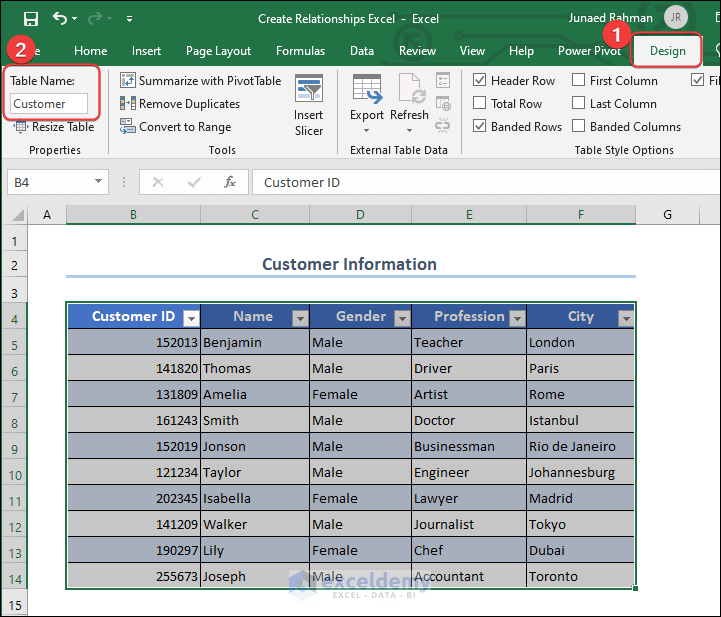
- Go to the Design option in the Quick Access Toolbar. Under the blank space of the Table Name: tab, assign a name to your table like the following image.
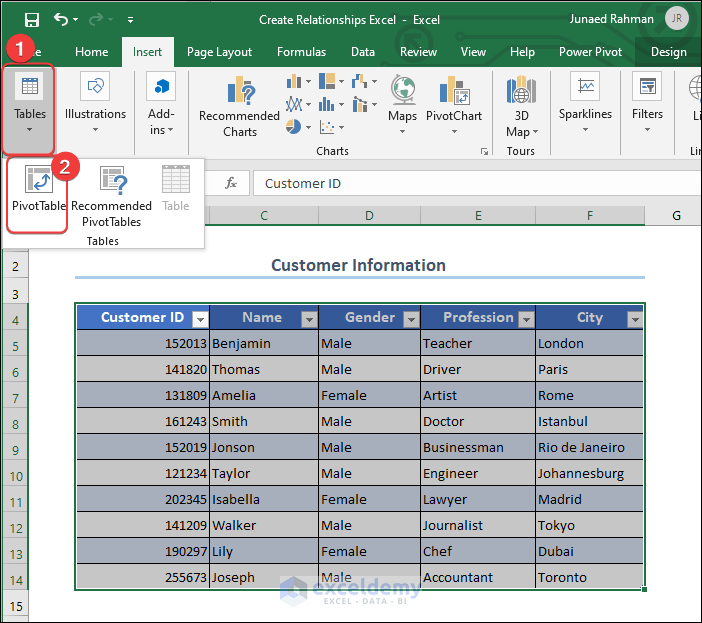
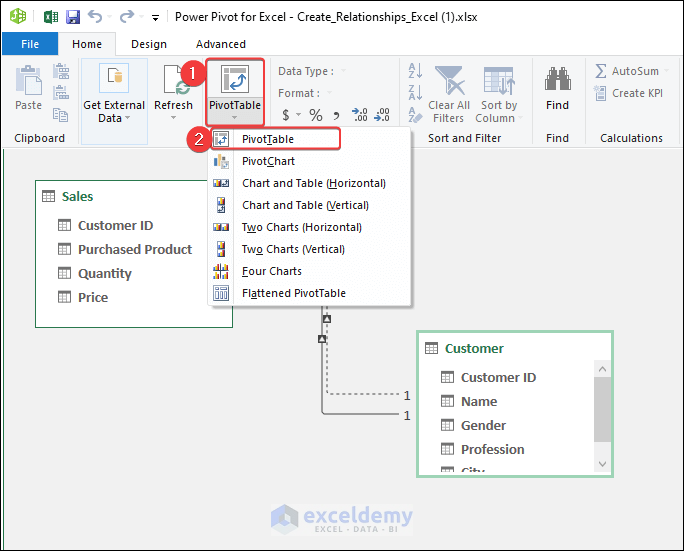
- Click on the Insert tab and then on PivotTable.
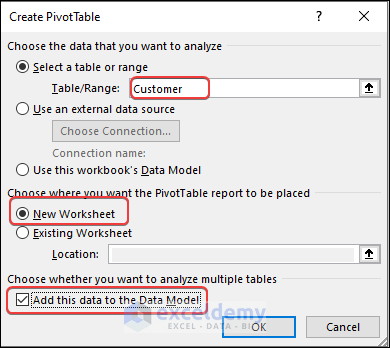
- A dialogue box will appear. Choose the options like the image below in the box and click OK.
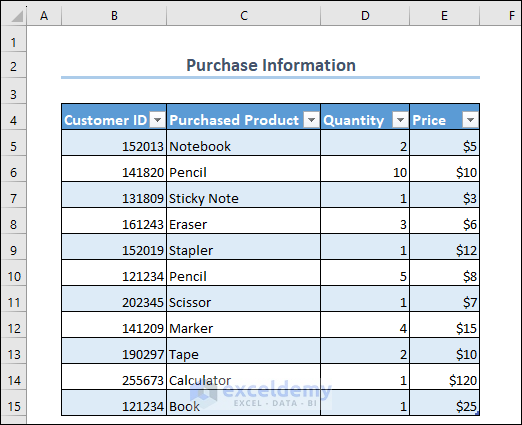
- Add another table to the data model. The other table looks like the following image.
- Go to the PivotTable Fields window. Select the option All in the upper section of the window.
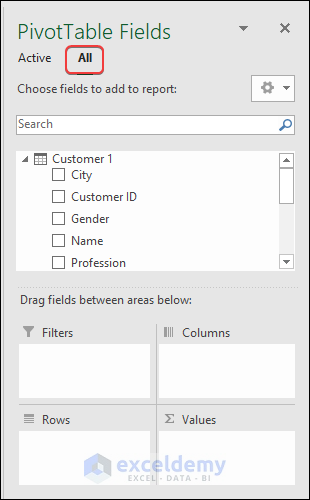
- Drag two columns from two tables; one under the Rows area and another under the Values area.
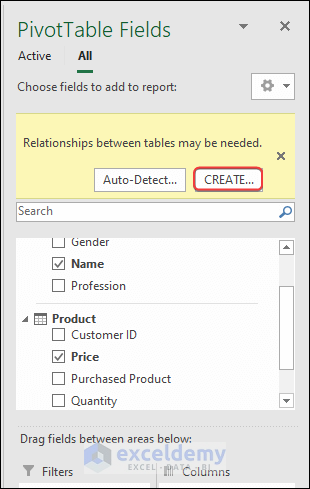
- A user prompt will appear. Pick CREATE from there.
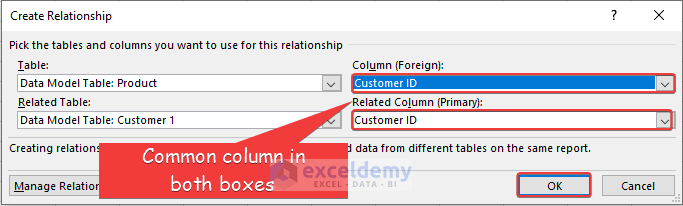
- A dialog box will appear. In Table:, we chose our 1st table Product and in the Related Table: we selected the second table Customer 1. Since the common column was Customer ID, we choose it for the Primary as well as the Foreign Column.
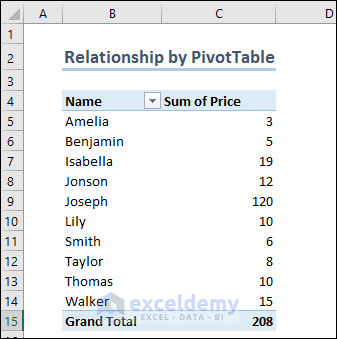
You will find a relationship created between these two tables like the image below.
Method 2 – Build Relationships in Excel Using Power Pivot
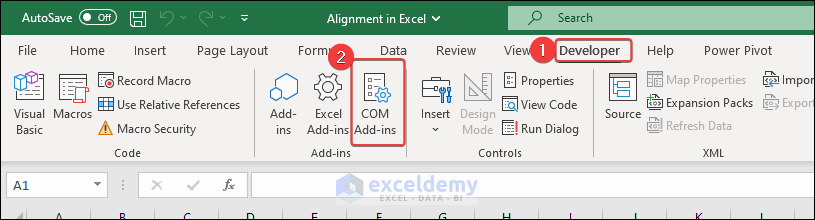
- Go to the Developer tab and select COM Add-ins.
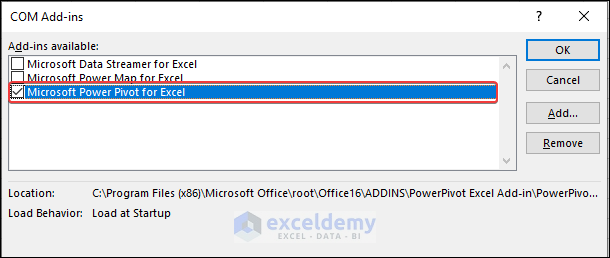
- A new dialog box will appear. Check the Power Pivot option and click OK.
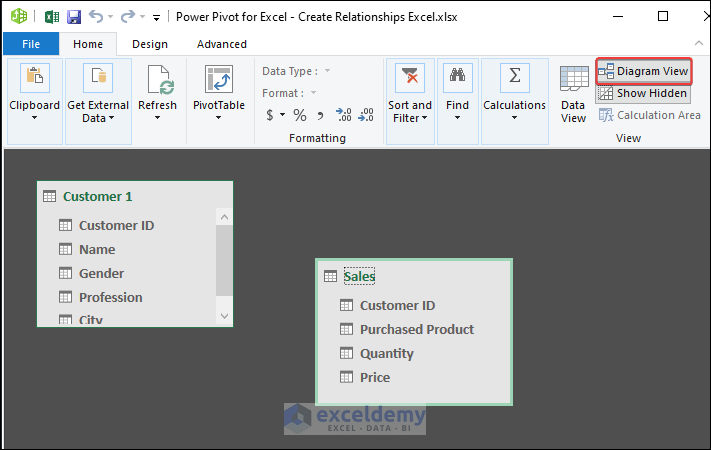
- Add tables in the Data Model like the following image.
- Add the other tables here in the same way. If you click on the Power Pivot for Excel window, you will see that tables are added here.
- Drag and drop the unique field identifier from one table to another.
- You will find the window looking like the image below.
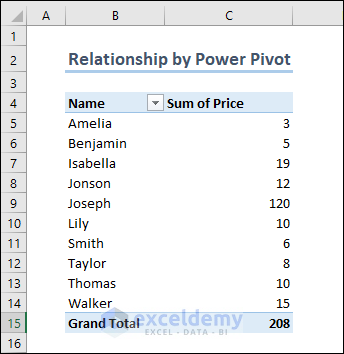
- We will see the output of the relationship we have already created. Follow the image below to create a PivotTable in your worksheet.
- Drag and drop the fields you want to see in the PivotTable.
- Under the Values area, add “Price” in the same process. You will find a PivotTable is created in the worksheet.
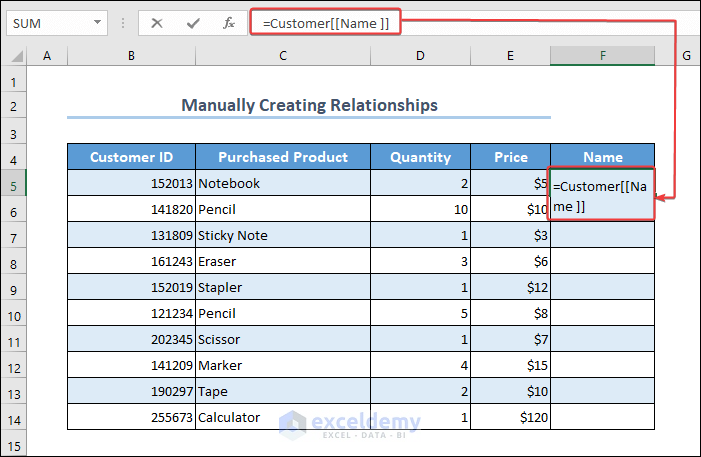
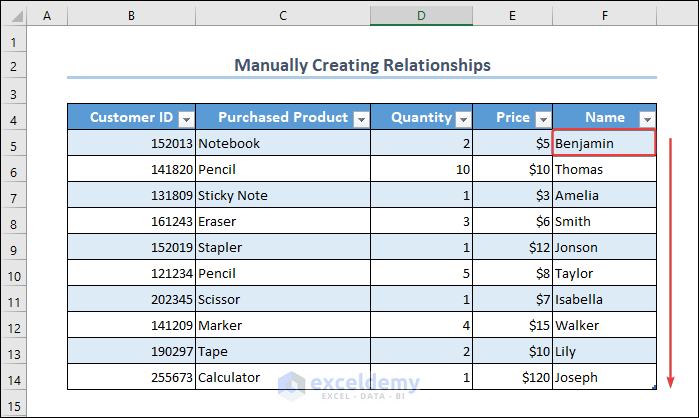
Method 3 – Create Relationships Between Tables Manually
We have two tables in our dataset named “Product” and “Customer”.
- Create a new column named “Name” and write this formula in the first cell.
- Hit Enter and use the AutoFill feature to fill the remaining cells.
Things to Keep in Mind
- Analyze the structure of your data and identify common fields since you will create relationships based on the matching values in the common fields.
- Excel supports different types of relationships. Choose the appropriate one for your dataset.
- When you create relationships with large datasets, it may slow down the program. Use advanced tools like Power Pivot or a relational database to boost your performance.
Frequently Asked Questions
Can I establish relationships between tables from different worksheets or workbooks?
Yes, you can. However, ensure that the desired worksheets or workbooks are accessible as well as they have at least one common field or column.
Are there any alternatives to creating relationships in Excel for managing related data?
There are multiple alternatives to creating relationships in Excel. You may use the combination of VLOOKUP and HLOOKUP functions. Or, you may use INDEX and MATCH functions together. Moreover, you can use Power Query or Database Management System (DBMS) in lieu of creating relationships.
Are there any performance implications when working with large datasets and complex relationships in Excel?
Large datasets and complex relationships require a large memory and high processing power. When you work with this type of dataset, keep this in mind and be careful about your available resources.
Create Relationships in Excel: Knowledge Hub
- How to Create Relationship in Excel with Duplicate Values
- How to Manage Relationships in Excel
- How to Create Data Model Relationships in Excel
- Create Entity Relationship Diagram from Excel
- How to Make One to Many Relationship in Excel
- How to Create Many to Many Relationship in Excel
- How to Create Table from Data Model in Excel
- [Fixed!] Excel Data Model Relationships Not Working
<< Go Back to Data Model in Excel | Learn Excel
Get FREE Advanced Excel Exercises with Solutions!
