What Is a Data Model?
In simple terms, a Data Model enables us to combine information from many tables to create a relational data source within an Excel workbook. Data models are utilized openly in Excel and provide tabular data for PivotTables and PivotCharts.
What Are Power Pivot and Power Query?
Power Query imports the raw data and shapes it (merging columns, removing rows, altering data type, etc.) according to the user’s needs.
In contrast, Power Pivot helps to visualize, perform analyses, and draw conclusions from the dataset.
Excel Data Model vs. Power Query: Main Differences to Know
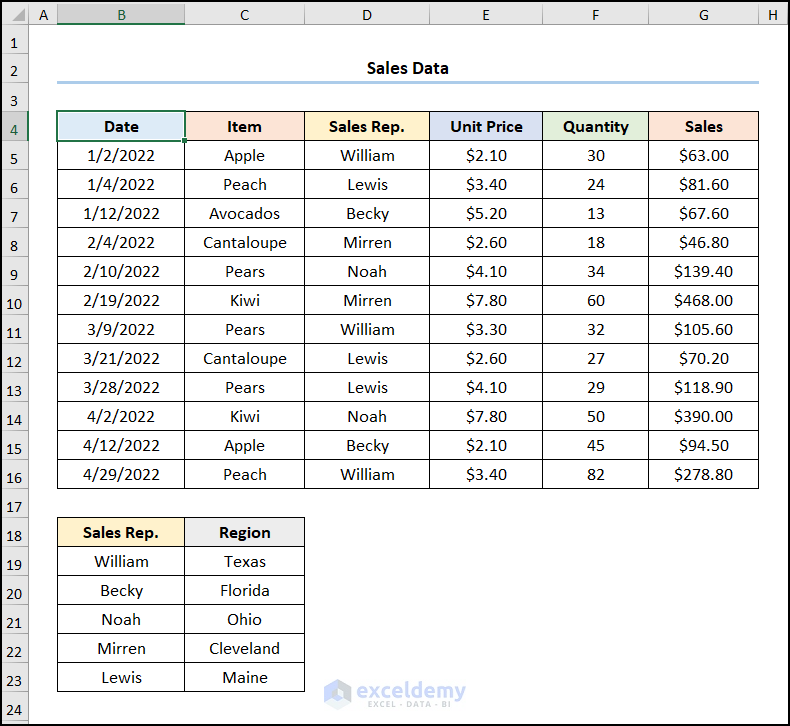
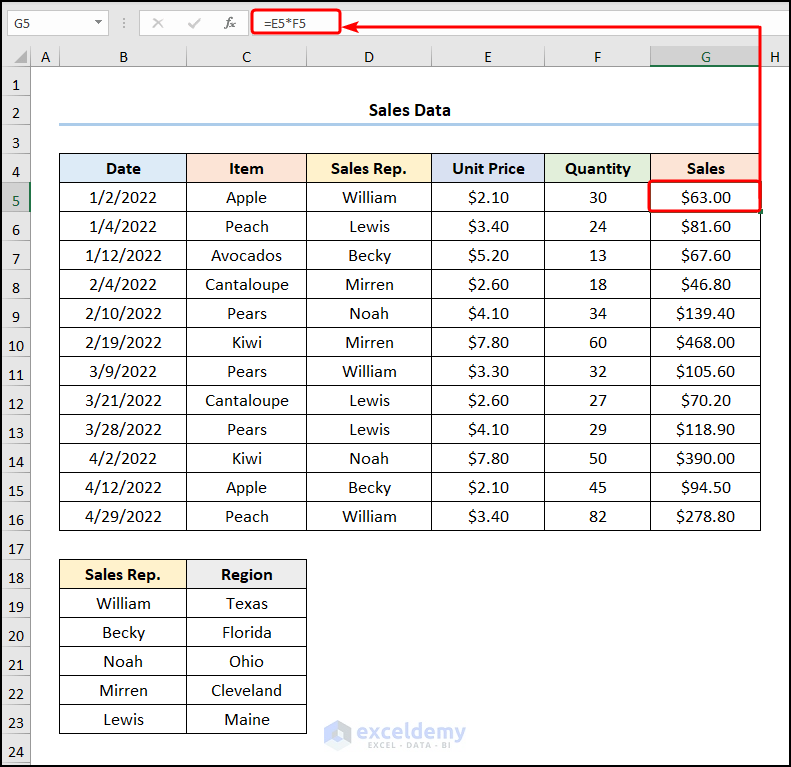
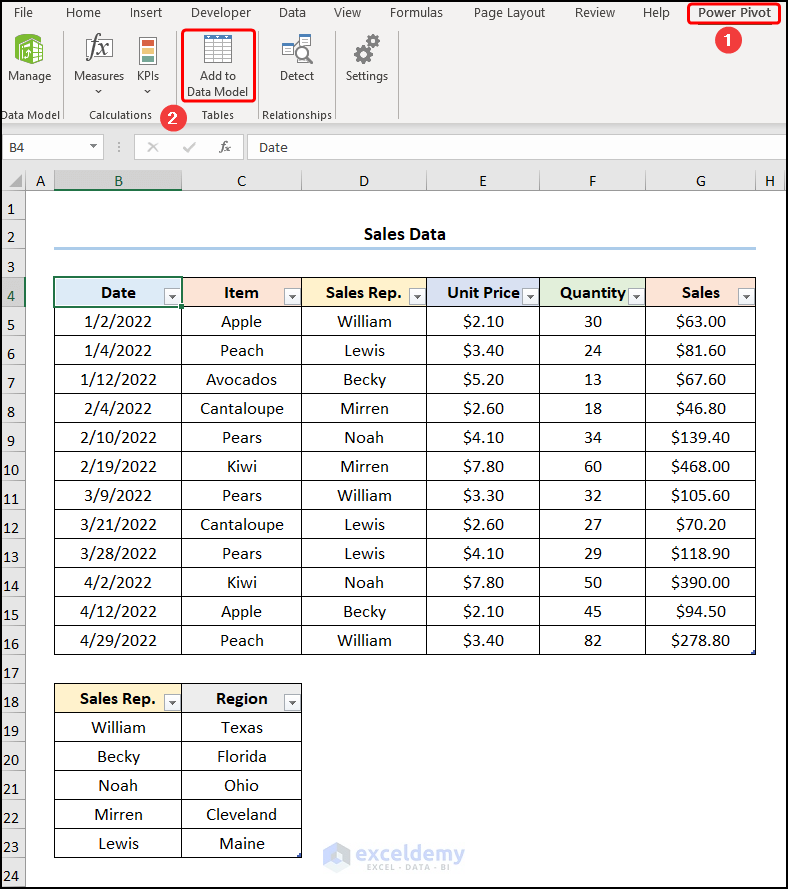
Consider the Sales Dataset in the B4:G16 cells which contains the “Date”, “Item”, the names of the “Sales Rep.”, “Unit Price”, “Quantity”, and “Sales” in USD. Additionally, the dataset below shows the “Region” of each “Sales Rep.” respectively. We’ll use the dataset to demonstrate 5 differences between the Excel data model and Power Query.
Note: Throughout this article, we’ll use Power Pivot to make a data model in Excel and compare this process with Power Query.
Difference 1 – Excel Data Model vs. Power Query: Dataset Location
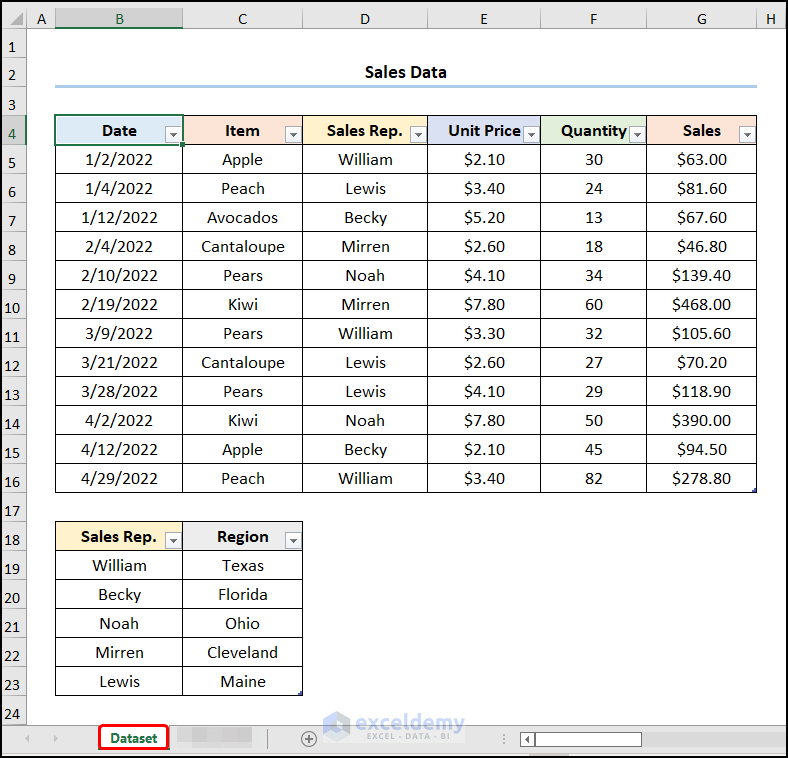
- In the case of Power Pivot (Excel data model), the dataset must be in the same worksheet so it can be prepared and combined further down the pipeline.
- The image below shows the dataset that will be imported using the Power Pivot (Excel data model).
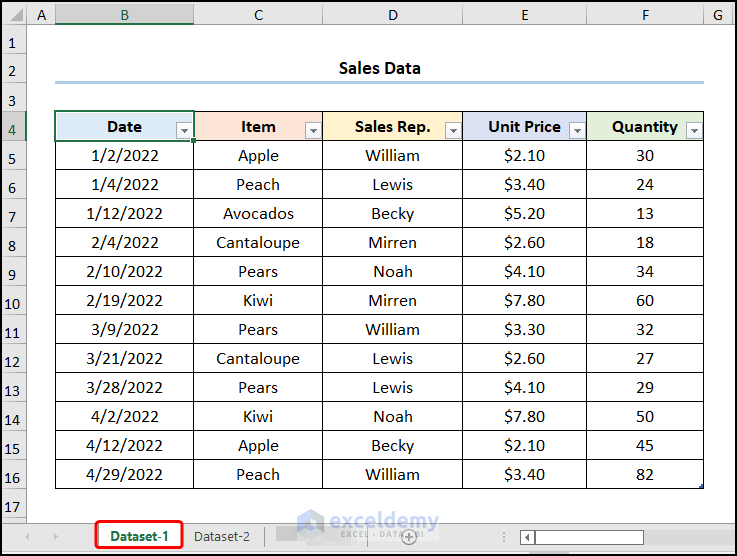
- When using the Power Query editor, the datasets can be in different worksheets. For example, the “Dataset-1” worksheet refers to the “Sales Data” table.
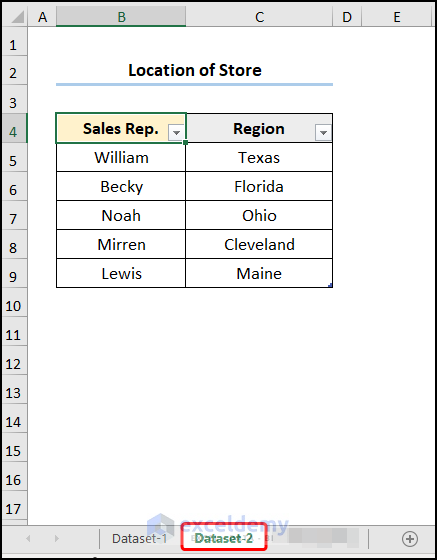
- The “Dataset-2” worksheet points to the “Location of Store” table.
Read More: How to Create a Data Model in Excel
Difference 2 – Excel Data Model vs. Power Query: Transforming Data
Normally, Power Pivot (Excel data model) performs data analysis rather than transformation, so it is better to perform data transformation beforehand.
Data Model:
- Add a “Sales” column and insert the formula given below.
=E5*F5
The E5 and F5 cells represent the “Unit Price” of each item and the “Quantity” sold.
Power Query:
- Go to the Add Column tab and click the Custom Column option.
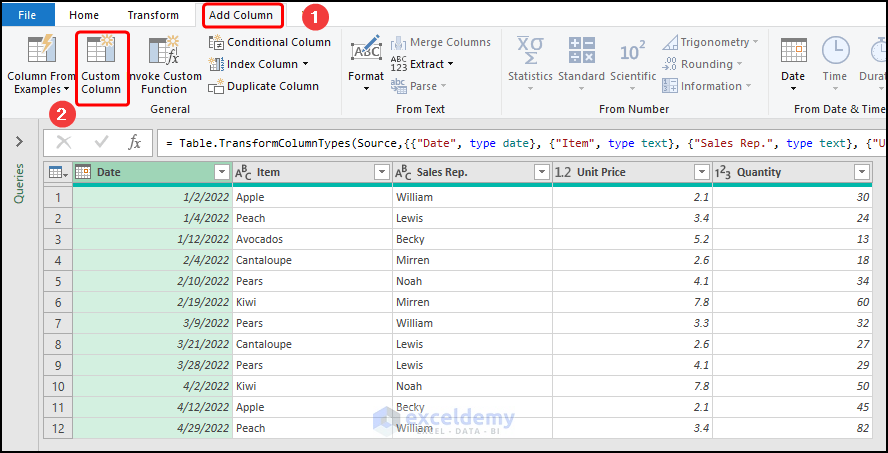
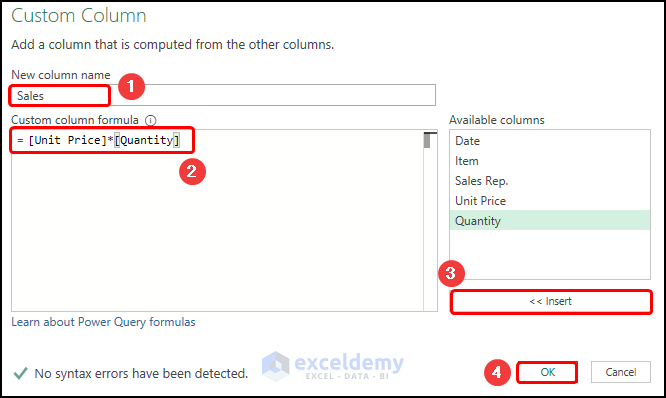
- Enter a name for the column (here it is “Sales”) and construct the equation given below.
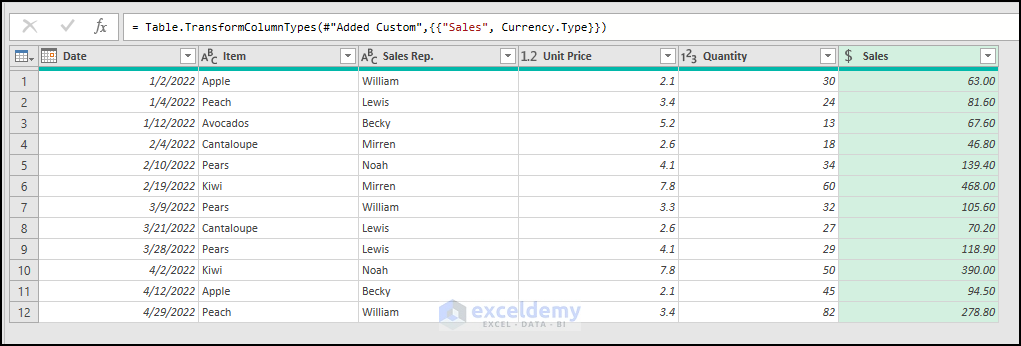
=[Unit Price]*[Quantity]
This adds a new column, as shown in the figure below.
Difference 3 – Excel Data Model vs. Power Query: Loading Dataset
Data Model:
- Move to the Power Pivot tab and press Add to Data Model to import the dataset.
Power Query:
- Click the Close & Load option drop-down and choose Close & Load to.
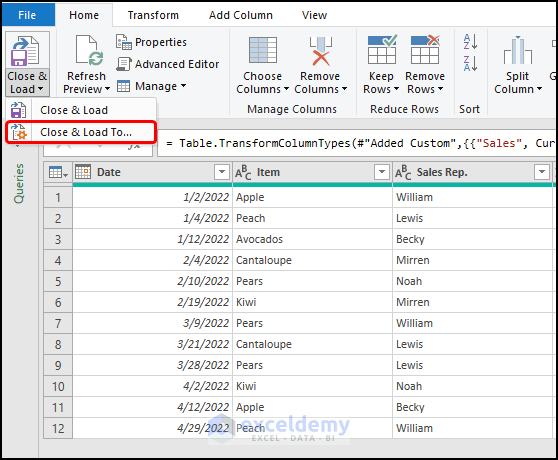
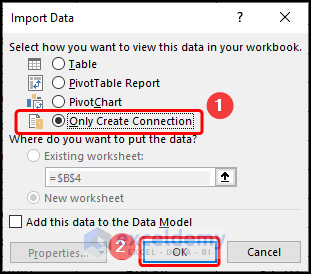
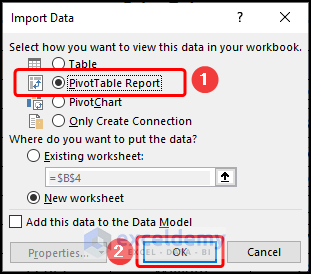
- This opens the Import Data window.
- Check Only Create Connection and press OK.
- Repeat the same process if you want to load multiple datasets.
Difference 4 – Excel Data Model vs. Power Query: Establishing Relationship
Data Model:
- In the Power Pivot window, navigate to Diagram View.
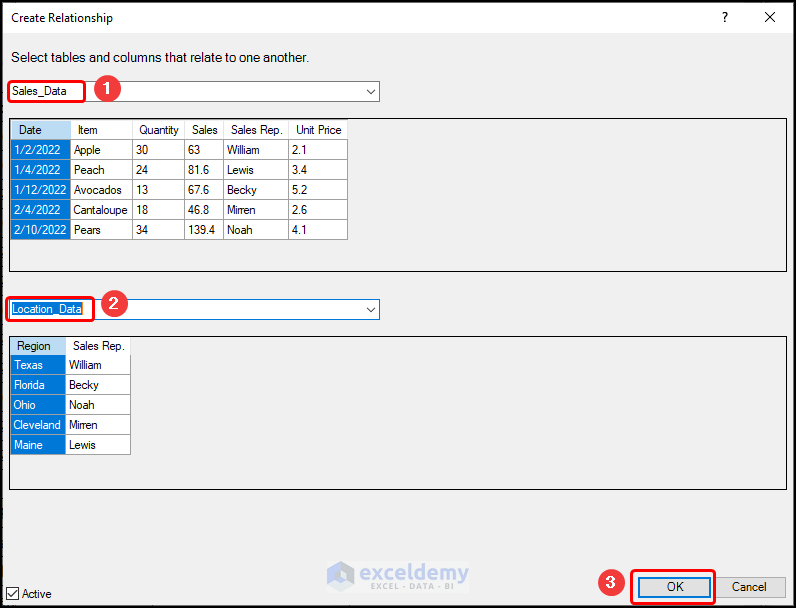
- Right-click and select Create Relationship.
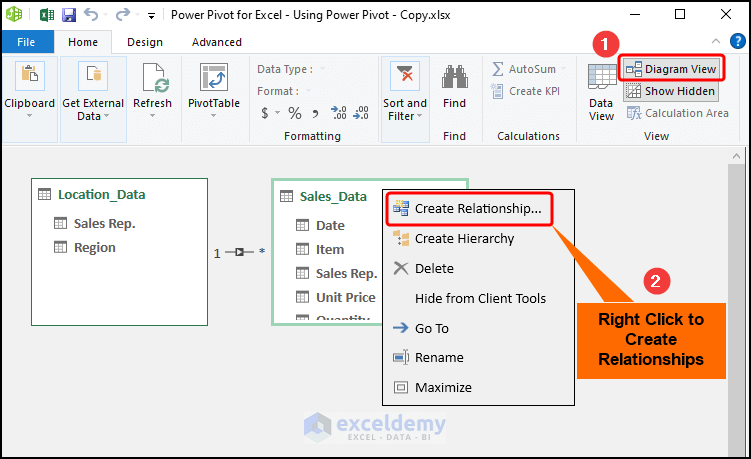
- Choose the tables (in this case, “Sales_Data” and “Location_Data”) and click on OK.
Power Query:
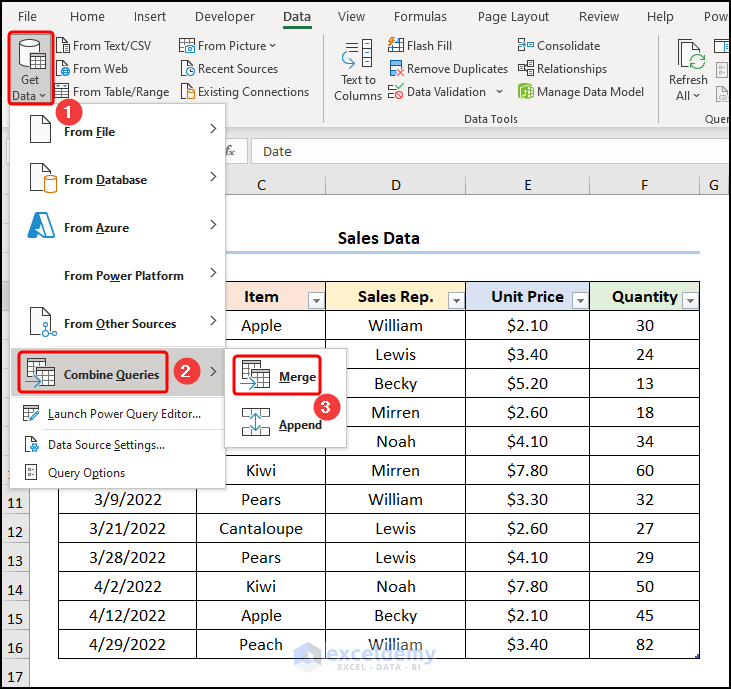
- In the Excel window, go to the Get Data drop-down, choose Combine Queries, and select the Merge option.
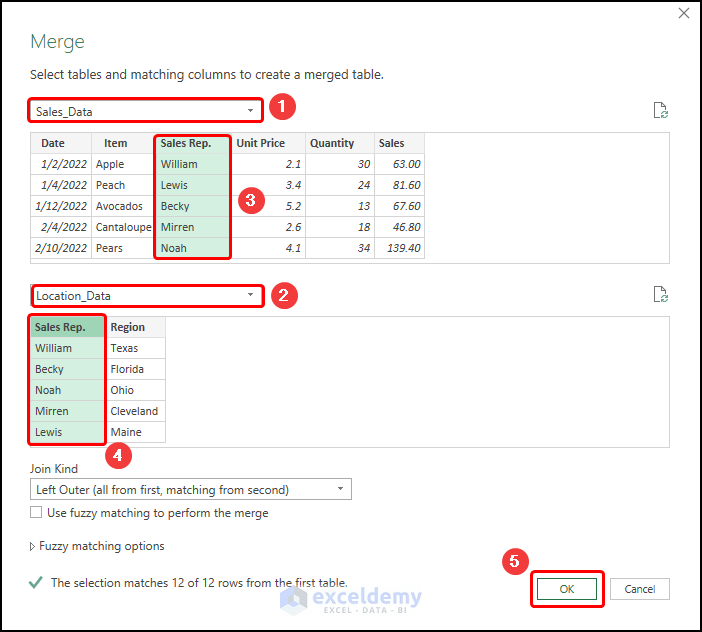
- Enter the table names (“Sales_Data” and “Location_Data”), highlight the common column (“Sales Rep”), and press OK.
Difference 5 – Excel Data Model vs. Power Query: Analyzing Data
Data Model:
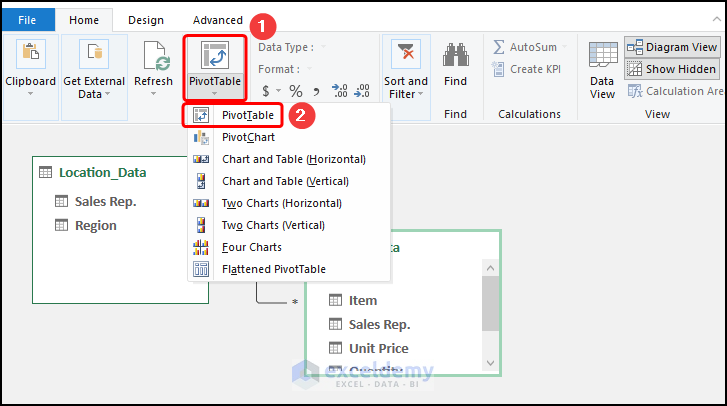
- Go to the PivotTable drop-down and select PivotTable.
Power Query:
- Navigate to the Close & Load to option.
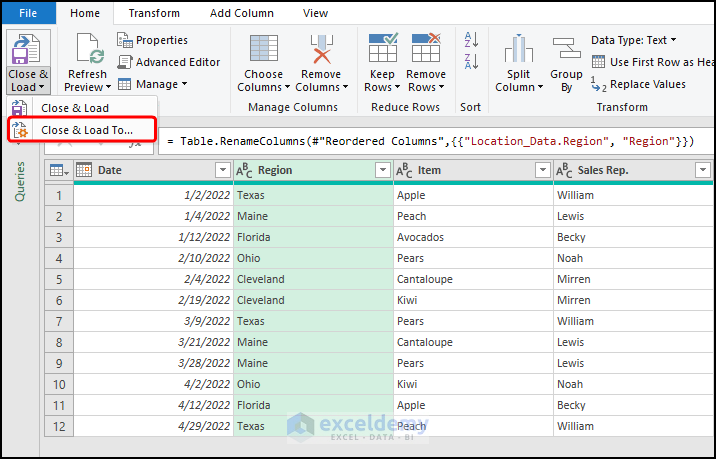
- Check the PivotTable Report option and hit OK to close the window.
Read More: How to Get Data from Data Model in Excel
Download the Practice Workbooks
Related Articles
- How to Remove Table from Data Model in Excel
- How to Update Data Model in Excel
- How to Use Reference of Data Model in Excel Formula
- How to Add Table to Data Model in Excel


Sir, Request to please let me know the difference between excel and power query more illustrations easy language step by step
Hello Vivek,
Sure! Here’s a simple explanation of the difference between Excel and Power Query with an easy step-by-step approach.
Difference Between Excel & Power Query
Excel – A spreadsheet tool used for data entry, calculations, charts, and reports.
Power Query – A data automation tool inside Excel that helps import, clean, and transform data from multiple sources automatically.
Understanding the Difference Between Excel and Power Query
Excel – Manual Data Entry and Analysis
Excel is a spreadsheet tool primarily used for data entry, calculations, and analysis. When working with data in Excel, you often enter values manually or copy and paste them from other sources. After entering data, you can apply formulas, use functions like VLOOKUP or SUMIFS, and create pivot tables to analyze trends.
For example, if you receive monthly sales data in separate Excel files, you may need to manually combine them, remove duplicates, and clean up the data before using it for analysis. This process takes time and needs to be repeated every time new data comes in.
The challenge with Excel is that manual updates are required whenever the data changes, making the process repetitive and time-consuming.
Power Query – Automating Data Import and Cleaning
Power Query is a tool inside Excel designed to automate data import, transformation, and cleaning. Instead of manually entering or copying data, Power Query allows you to connect to multiple sources like databases, CSV files, or websites and automatically transform the data according to predefined steps.
For example, if you receive monthly sales reports in separate files, Power Query can:
1. Import all files from a folder at once.
2. Remove unnecessary columns and filter out unwanted data.
3. Merge data from different sources into a single table.
4. Apply transformations, such as changing formats or splitting text.
5. Load the cleaned data back into Excel for analysis.
Once these steps are set up, Power Query allows you to refresh the data with a single click. This means that whenever new data is added, Power Query will apply the same cleaning steps automatically, saving time and effort.
Regards
ExcelDemy