
Excel is a powerful tool for project management, it offers flexibility and functionality to track tasks, manage timelines, and visualize progress. In this article, we will show how to use Excel for project management. It will cover essential project management tasks you can perform using Excel, including task tracking, timeline management, and reporting.
1. Set Up Your Project Detail
To show key metrics, task progress, deadlines, timeline, and team responsibilities you will need to create a project dashboard. It will provide an overview of your entire project.
Create tabs for different aspects of the project:
- Dashboard: It will contain a summary of the overall project status.
- Tasks: List all the tasks and their status.
- Timeline: To show the project timeline you can project a calendar by using Gantt Chart.
- Resource Managing: List all the required resources and the cost needed for the project.
- Budget: List the information on the budget and actual amount for the projects.
- Team Members: A list of project team members and their roles and assigned tasks.

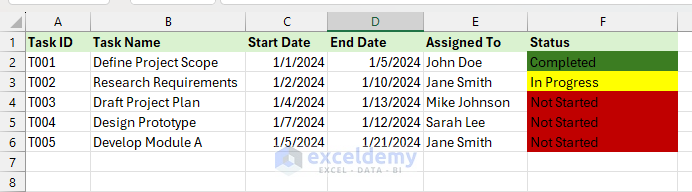
2. Tracking Tasks and Milestones
You will need to track tasks to see the progress of your project. It is crucial to keep your project on track. You can create a simple task tracker with columns for task names, due dates, responsible team members, status, and comments.
Highlight Task Status:
- Completed: Green
- In Progress: Yellow
- Not Started: Red
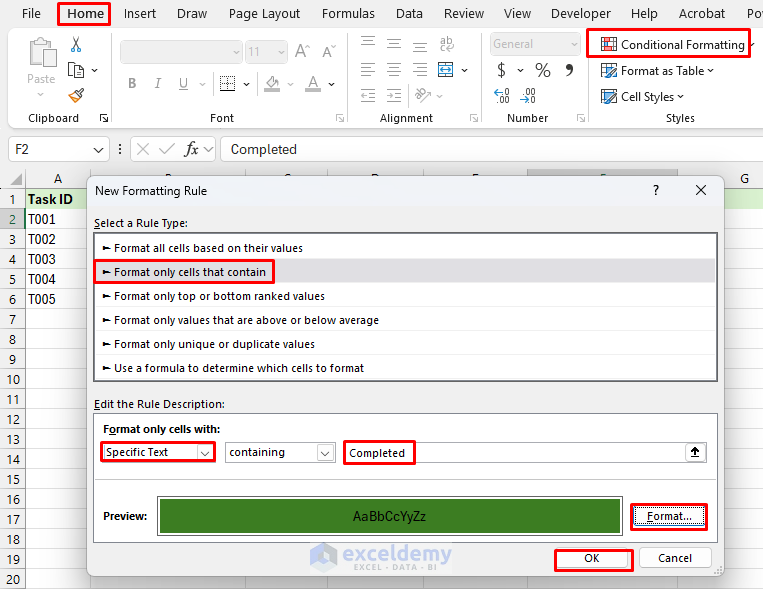
To apply conditional formatting:
- Select the Status column.
- Go to the Home tab >> from Conditional Formatting >> select New Rule.
- Select Rule Type: Format only cells that contain.
- Format only cells with:
- Cell Value: Specific Text >> Containing: Completed >> Format: select Green fill color >> click on OK.
- Cell Value: Specific Text >> Containing: In Progress >> Format: select Yellow fill color >> click on OK.
- Cell Value: Specific Text >> Containing: Not Started >> Format: select Red fill color >> click on OK.
Output:
3. Creating a Gantt Chart for Timeline Management
A Gantt chart is an essential tool for visualizing your project timeline. Excel can help you create a Gantt chart by using conditional formatting to highlight the duration of each task on a timeline.
Set Up the Timeline:
- List the start date of the project in E1 cell to onwards.

Apply Conditional Formatting:
- Select the range of data cells.
- Go to the Home tab >> from Conditional Formatting >> select New Rule.
- Select Rule Type: Use a formula to determine which cells to format.
=AND(E$1>=$C2, E$1<=$D2)
- Format: Select blue fill color >> click on OK.
- Click on OK.

This will create a Gantt chart, visually showing the timeline and progress of each task.

4. Managing Resources
You can track your project resources in Excel to ensure the projects stay within the scope. Managing resources involves efficiently allocating people, tools, and equipment to ensure tasks are completed on time and within budget.
By using Excel formulas, you can manage the resources. Calculate the Total Cost of resources and Cost by Resources.
Formula:
=(DATEDIF(D2, E2, "d")+1) * F2
- The DATEDIF function determines the number of days between the start date in D2 and the end date in E2.
- The “d” parameter ensures the difference is measured in days. Adding +1 includes the end date in the calculation, making the duration inclusive.
- Finally, the result is multiplied by the value in F2, which is Cost Per Day.
Output:

You can calculate Cost by Resources by using the SUMIF function.
Formula:
=SUMIF(B2:B5, "Equipment", F2:F5)
This formula sums the “Equipment” total cost per day.
Output:

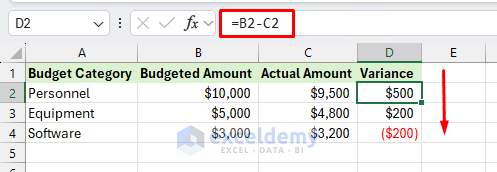
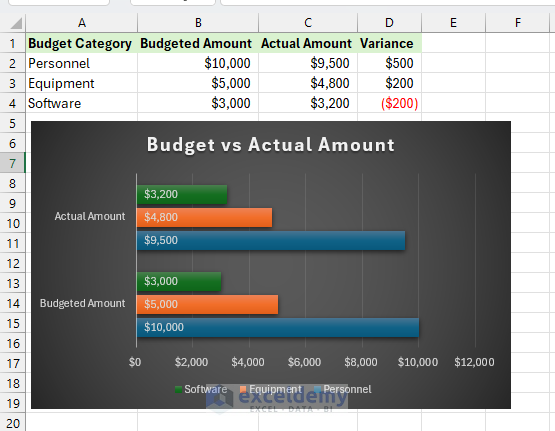
5. Budget Tracker
To track the budget, calculate the difference between the budgeted and the actual amount.
Formula:
=B2-C2
This formula will calculate the variance of the budget and the actual amount.
Output:
Visualize Budget:
- Select the Budget Category, Budgeted Amount, and Actual Amount columns.
- Go to the Insert tab >> from All Charts >> select Bar chart >> click OK.
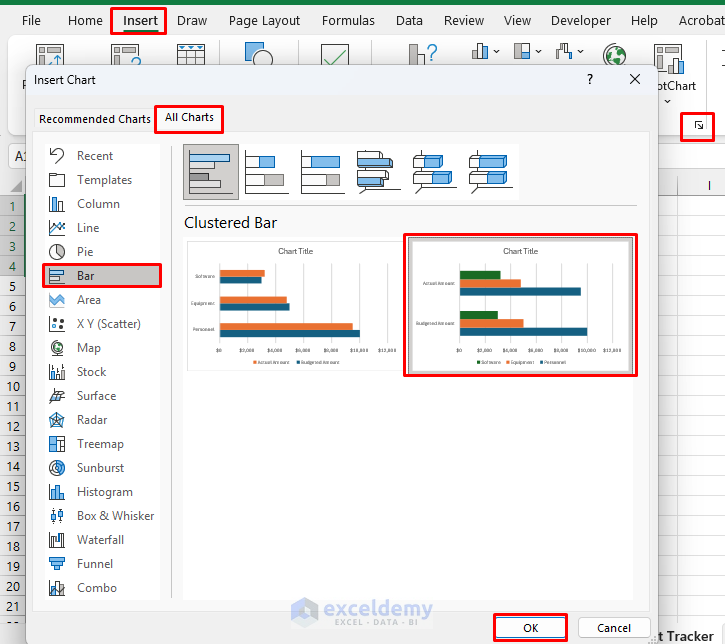
Output:
Format the charts based on your requirements. This chart represents the difference between the budget and the actual amount.
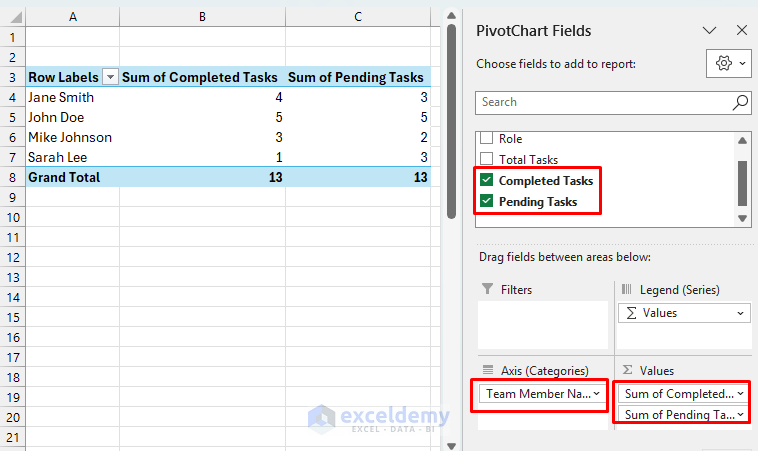
6. Team Member Analysis
You can track the team members’ performance and task completion in Excel.
- Select the data table.
- Go to the Insert tab >> from Pivot Table >> select From Table/Range.
- Select New Worksheet >> click OK.

- Drag the Team Member Name to Rows.
- Drag Completed Tasks and Pending Tasks to Values.
Output:
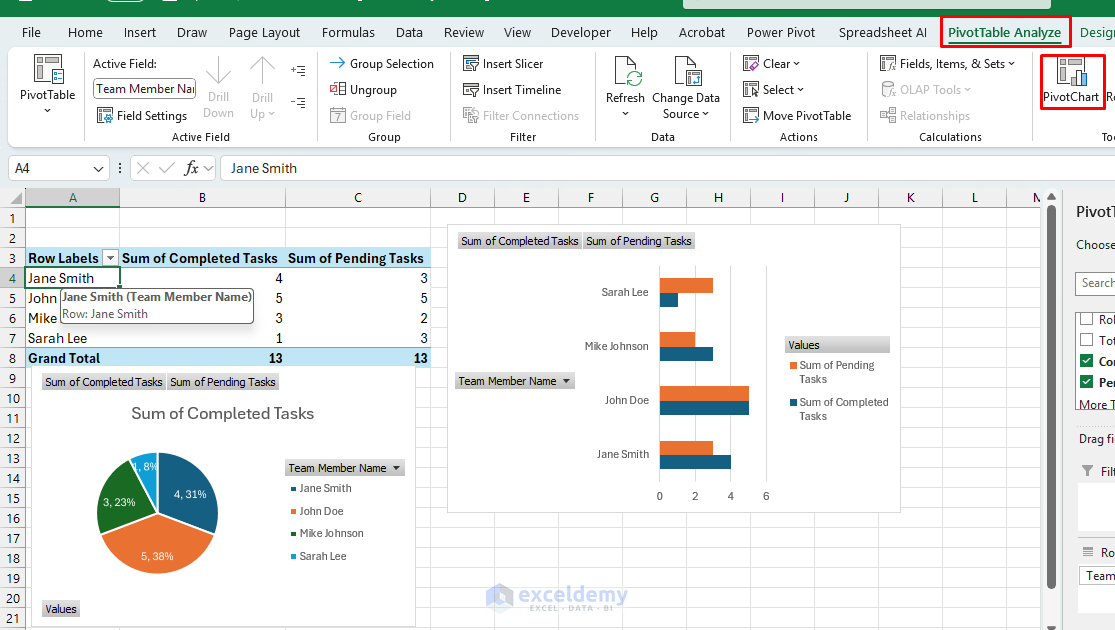
Visualize Team Performance:
To highlight the pivot table data, you can insert a bar or pie chart from the pivot chart.
- Go to the PivotTable Analyze tab >> select PivotChart >> from All Charts >> select Bar and Pie charts.
- Bar chart: Compares completed and pending tasks by team members.
- Pie chart: Shows team contribution percentages.
Tips for Effective Project Management in Excel
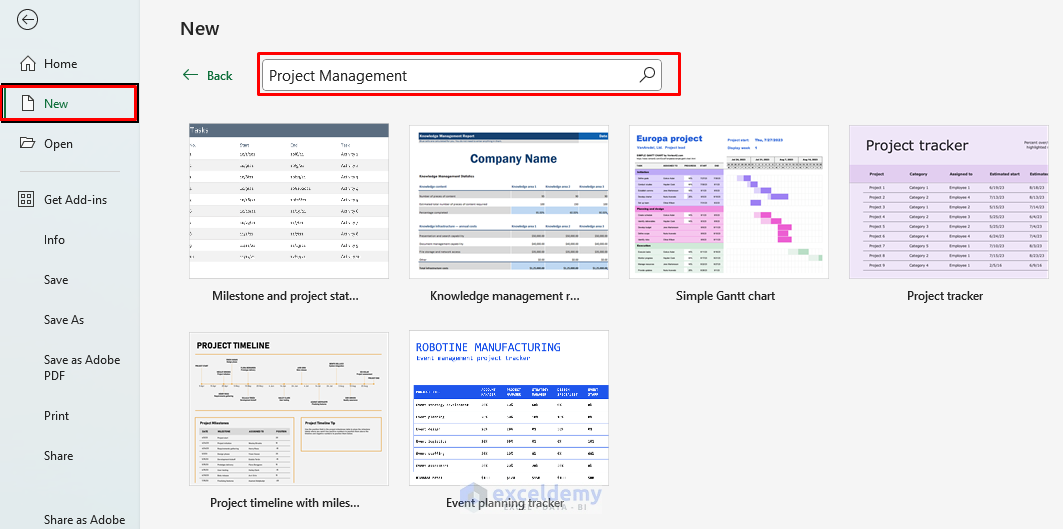
- Download Templates: Download templates from Excel’s template gallery for quick setup.
- Go to the File tab >> select New >> insert project management or project tracker on the search bar >> select any tracker of your choice.
- Automate with Formulas: Use Excel dynamic formulas to keep data up to date as you add new entries.
- Update Regularly: Ensure your project management sheet is accurate by updating it at regular intervals.
Conclusion
Excel offers all the required tools and formulas for efficient project management, from task tracking and budgeting to visualizing project timelines and progress. With a few simple templates and formulas, you can manage your projects effectively, keep track of deadlines, and visualize your project’s status in real-time. By following this guide, you can effectively manage projects in Excel, keeping tasks, timelines, resources, and risks under control.
Get FREE Advanced Excel Exercises with Solutions!
