Create Entity Relationship Diagram from Excel (with Quick Steps)

This article illustrates how to create an Entity Relationship Diagram in Excel. Software like Microsoft Visio, Lucidchart, etc. are great tools for creating entity-relationships diagrams. There is no direct way to create these diagrams in Excel quickly. But you can use the Microsoft Visio add-in to do that in Excel with limited tools. Even then, you need a work or school account for that. So we will use the Insert Shapes feature in Excel instead to create the diagrams. Follow the article to learn how to do that.


Watch Video – Create Entity Relationship Diagram from Excel


What Is an Entity Relationship Diagram?

An Entity Relationship Diagram (ERD), also known as a Database Model, is a visual model or representation of your database schema. As the name suggests, it shows different tables in boxes as entities and the relationships between them. It can be represented as a logical or a physical data model.

Entity Relationship Diagram Components:

An entity relationship diagram consists of three key components: entities, attributes, and relationships.

Entities: An entity can be a unit, object, thing, place, person, or any item within a database with a separate and distinct identity. These are usually the number of tables needed for a database. Each ERD should contain unique entities. Entities are typically represented by rectangular boxes in the diagram.

Attributes: Attributes describe each entity or table. These are the properties of distinct or separate entities. Entities must have attributes.

Relationships: Relationships are the ways in which entities are linked. Cardinality is a term directly linked to showing relationships between entities. It describes how many attributes in one entity can relate to how many attributes in another entity. It is usually expressed as one-to-one, one-to-many and many-to-many. The following picture shows the crow’s foot notations for different cardinalities.


Create Entity Relationship Diagram from Excel: with Quick Steps

Follow the steps below to create an Entity Relationship Diagram in Excel.

📌 Step 1: Prepare Database

  • First, assume you have a database containing three tables in separate worksheets. The tables contain customer information, order details, and product info respectively.

Read More: How to Manage Relationships in Excel


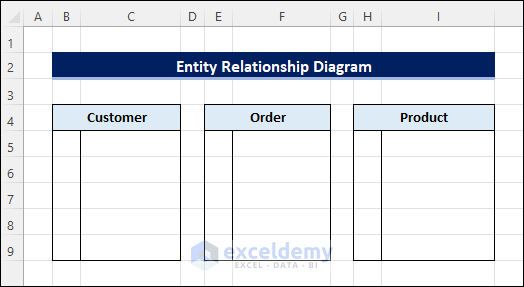
📌 Step 2: Create Entities

  • Then you need to create the entities. Here you need to create 3 entities for the separate tables.
  • Now, format some cells with borders to make them look like rectangular boxes. Each of them is to represent a particular entity. Next, name the entities as “Customer”, “Order” and “Product” respectively.

entity relationship diagram

Read More: How to Create Data Model Relationships in Excel
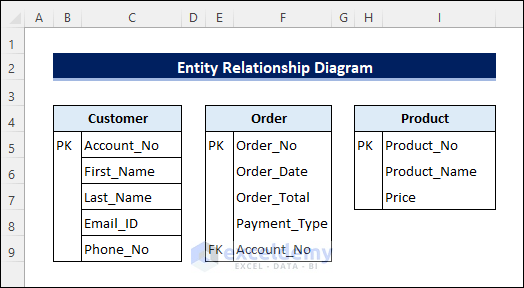

📌 Step 3: Add Attributes to Entities

  • After that, you need to add the attributes to each entity based on the database tables. For example, the “Customer Information” table contains “Account_No”, “First_Name”, “Last_Name”, “Email_ID” and “Phone_No”. You need to add these properties as attributes to the entity named “Customer”. Then, do the same for other entities.
  • Moreover, you can add Primary Key and Foreign Key notations at the left of each attribute. For example, write PK for Primary Key at the left of Account_No as each customer has a unique account number. And you can use FK for Foreign Key.

Read More: How to Create a Relationship Between Tables in Excel


📌 Step 4: Copy Entities as Pictures

Now copy the range of cells for each entity and paste them as pictures one by one.


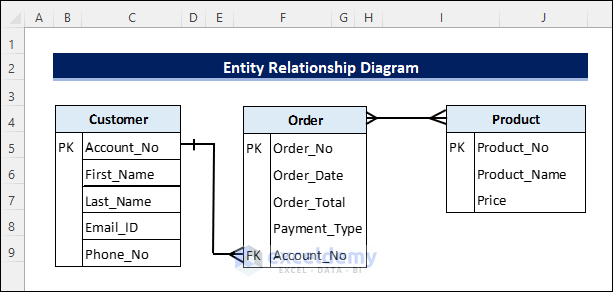
📌 Step 5: Show Relationships

  • Here, a customer can place many orders. So the cardinality for a relationship between customer and order will be one to many.
  • On the other hand, a single order can have many products and a single product can get many orders. So the cardinality for a relationship between order and product will be many to many.
  • Now, select Insert >> Illustrations >> Shapes >> Line to draw the crow’s feet notations to show the relationships between entities.

entity relationship diagram

Read More: How to Create Relationship in Excel with Duplicate Values


📌 Step 6: Group All Objects

Finally, select all images and line objects and right-click to group them together. After that, you can copy or save the diagram as a picture.


Things to Remember

  • Be careful while determining the cardinality of relationships between entities.
  • You can also create an intermediate entity with a composite key if there is no direct primary key-foreign key relationships between entities.

Download Practice Workbook

You can download the practice workbook from the download button below.


Conclusion

Now you know how to create an entity relationship diagram in Excel. Do you have any further queries or suggestions? Please let us know in the comment section below. Stay with us and keep learning.


Get FREE Advanced Excel Exercises with Solutions!
Md. Shamim Reza
Md. Shamim Reza

Md. Shamim Reza, a marine engineer with expertise in Excel and a fervent interest in VBA programming, sees programming as a time-saving tool for data manipulation, file handling, and internet interaction. His diverse skill set encompasses Rhino3D, Maxsurf C++, AutoCAD, Deep Neural Networks, and Machine Learning. He holds a B.Sc in Naval Architecture & Marine Engineering from BUET and has transitioned into a content developer role, generating technical content focused on Excel and VBA. Beyond his professional pursuits,... Read Full Bio

We will be happy to hear your thoughts

Leave a reply

Advanced Excel Exercises with Solutions PDF


ExcelDemy
Logo