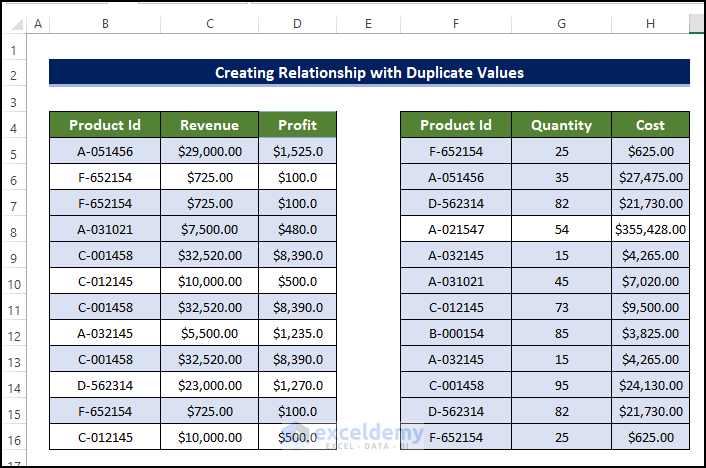
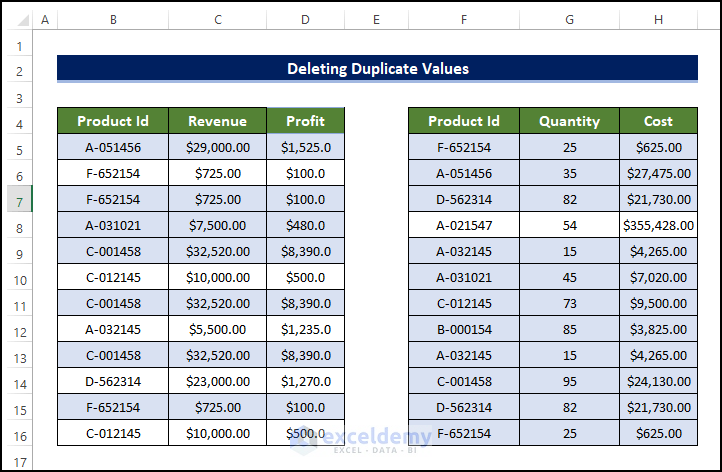
The sample dataset has Duplicate values. The common column is the Product Id. The Relationship will be based on this common column.
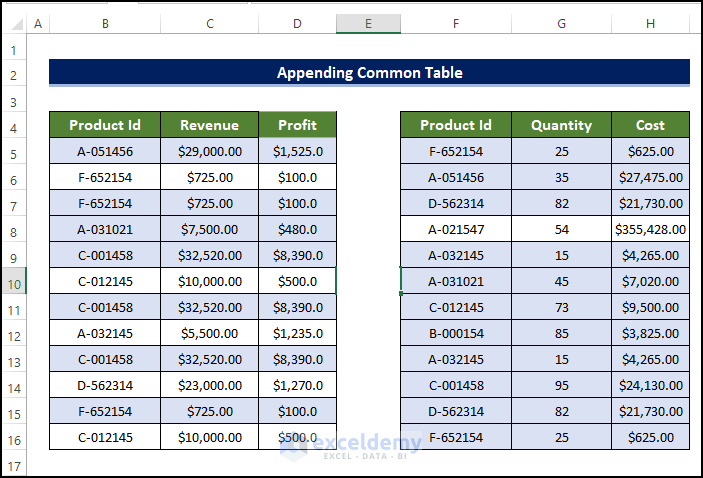
Method 1 – Appending Common Table
As we have Duplicate values in both tables, we can’t create a Relationship among them in Excel. Since this Relationship will require a one-to-one Relationship and Excel does not support it, we will import the tables on the power query and append them together and remove the Duplicates from the appended table. We will create Relationships with this new table with the original two tables.
Steps:
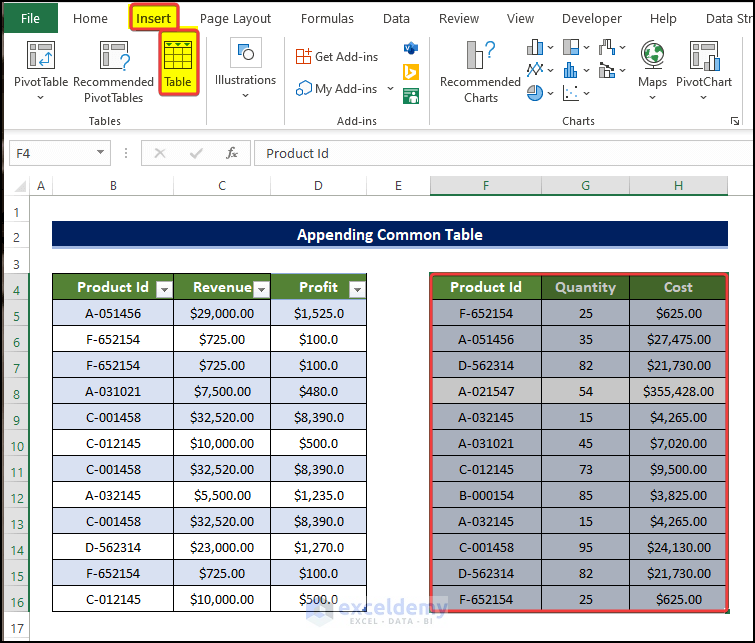
- We have two separate tables between which we need to create a Relationship, based on the common column Product Id.
- In order to create Relationships among tables, we need to have at least unique values in one of the tables.
- We have Duplicate values in both of the table’s Product Id columns.
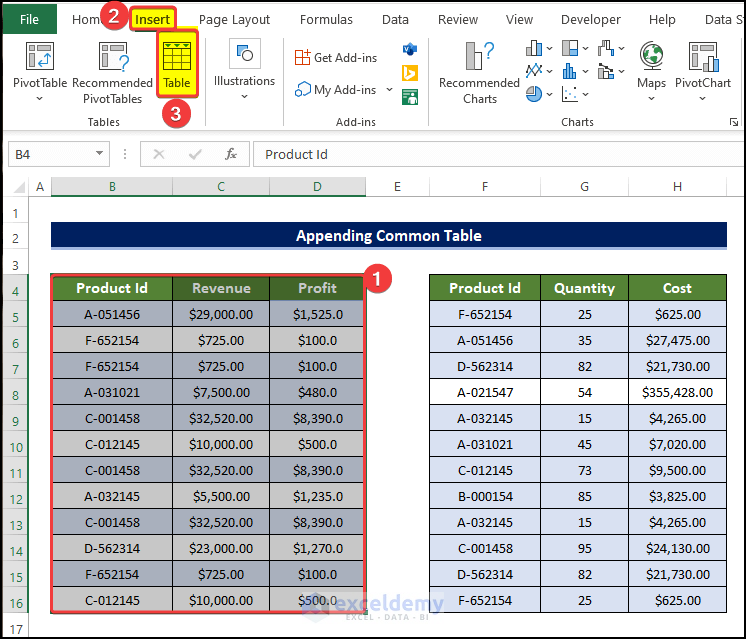
- To demonstrate why we can’t create a Relationship among the table, follow the steps, where we will try to make a relationship between these two tables.
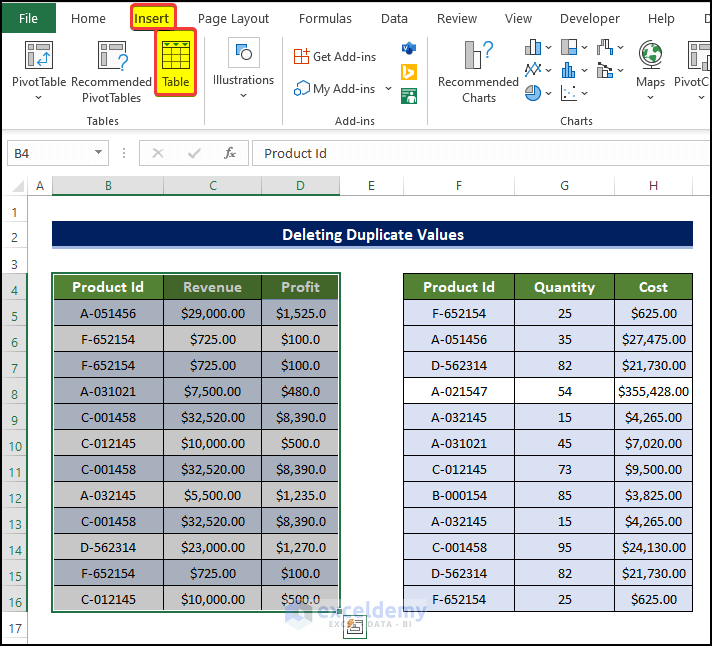
- Select the range of cells B4:C16 and click on the Table command from the Insert tab.
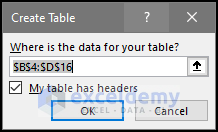
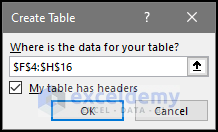
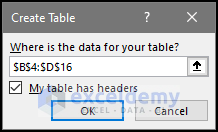
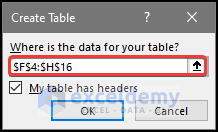
- In the Create Table dialog box, re-confirm the table range.
- Check the My table has headers checkbox.
- To demonstrate why we can’t create a Relationship among the table, follow the steps below, where we will try to make a relationship between these two tables.
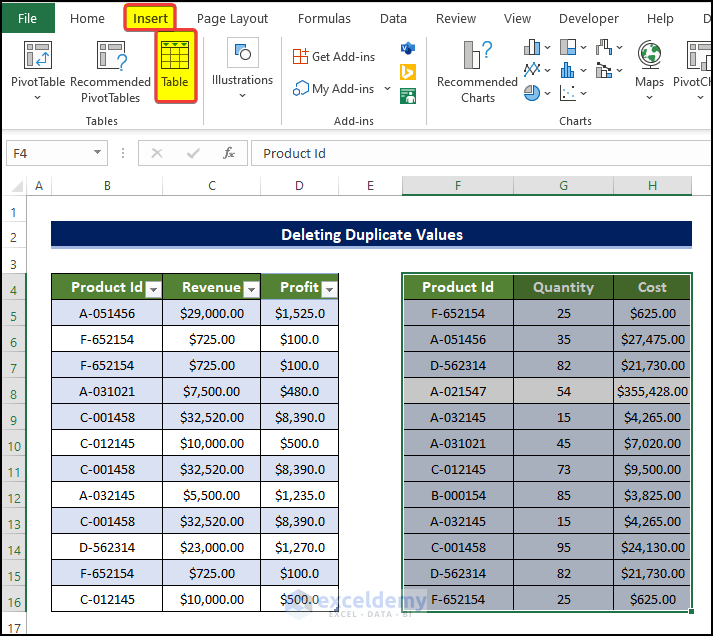
- Select the range of cells B4:C16 and click on the Table command from the Insert tab.
- In the Create Table dialog box, re-confirm the table range.
- Check the My table has headers checkbox.
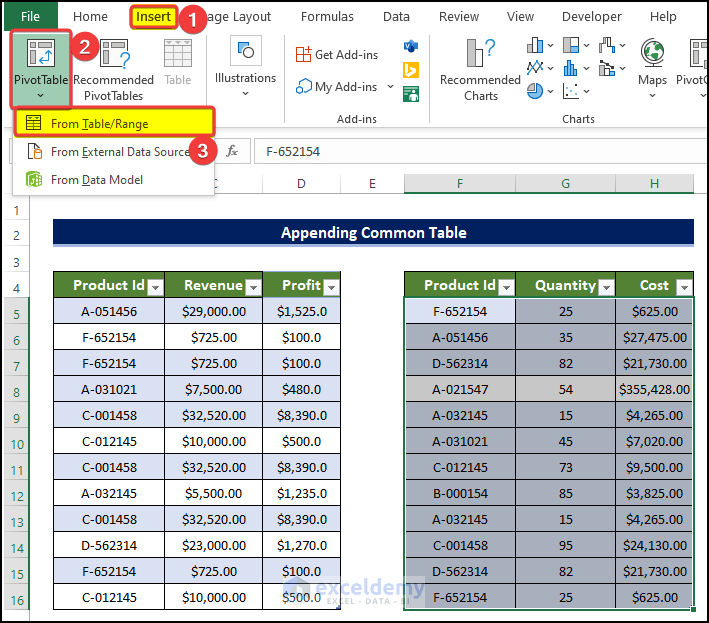
- Create a pivot table from the two created tables.
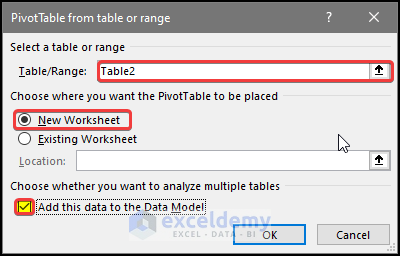
- Select the first table and go to Insert tab > PivotTable > From Table/Range.
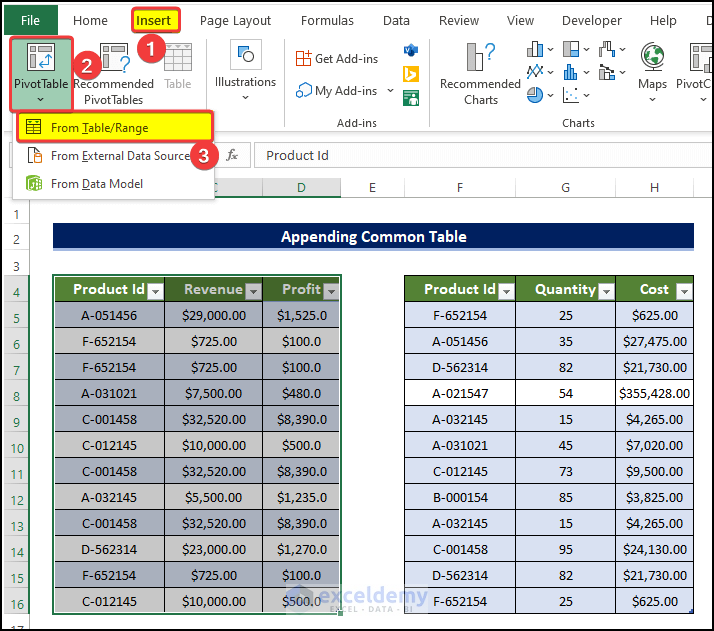
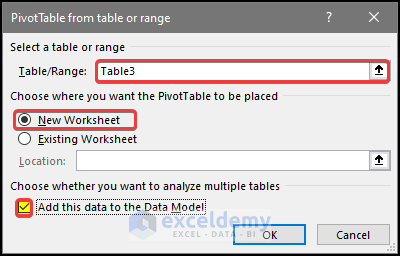
- Click on the New Worksheet.
- Check the Add this data to the Data Model checkbox.
- Click OK.
- Select the second table and go to Insert tab > PivotTable > From Table/Range.
- Click on New Worksheet.
- Check Add this data to the Data Model.
- Click OK.
- In the new worksheet, there is a PivotTable Fields menu.
- The side panel is occupied by both tables. To observe both tables, click on All section.
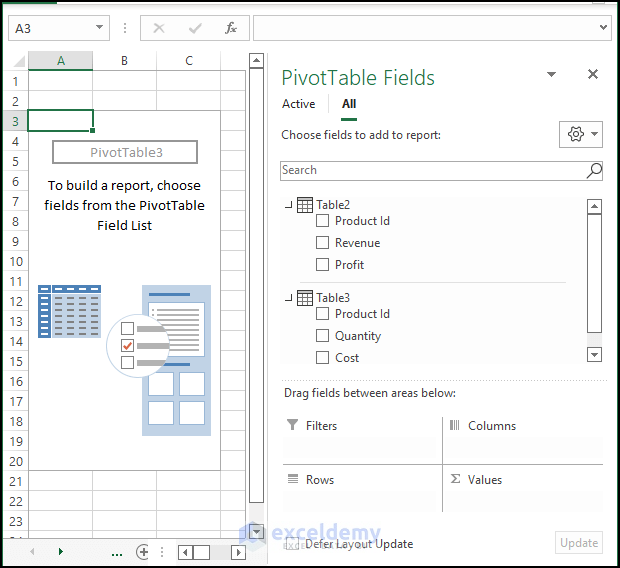
- Drag the Product Id field below the Filter area.
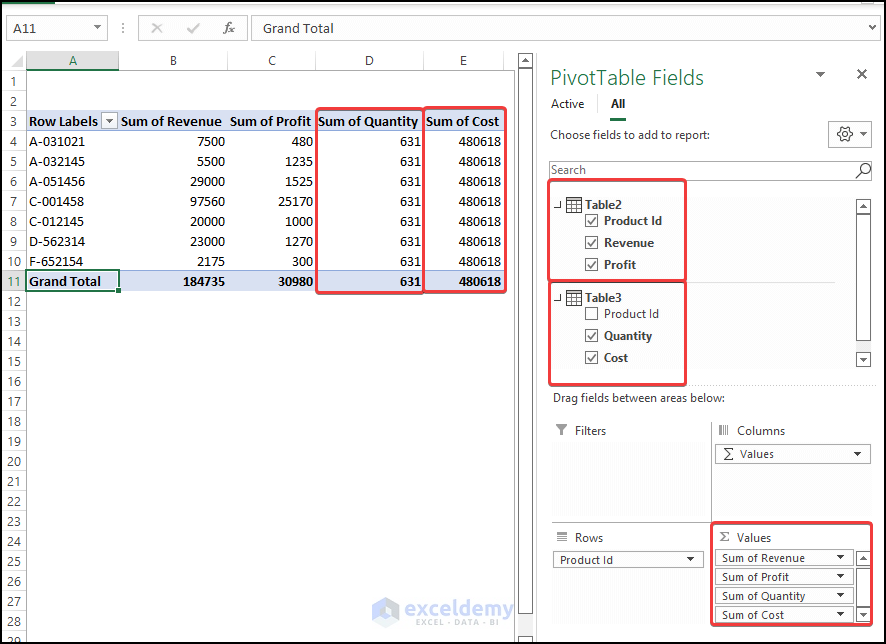
- Drag Revenue and Profit from Table2 and Cost and Quantity from Table3.
- The Revenue and Profit shows the values, but the Quantity and Cost column is showing the same values for each row.
- To resolve this issue, create a Relationship among the two tables..
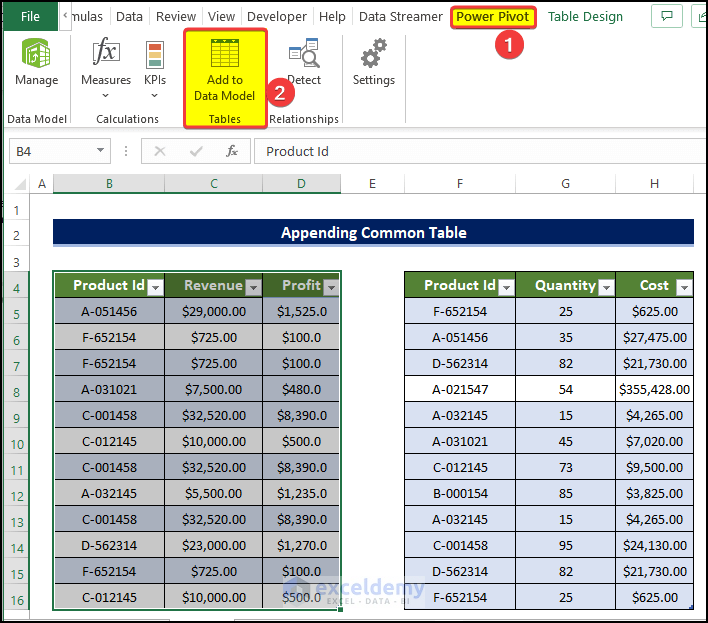
- Place cursor at any point in the table. Enable the Power Pivot feature in Excel and click on the Power Pivot tab.
- Click on the Add to Data Model.
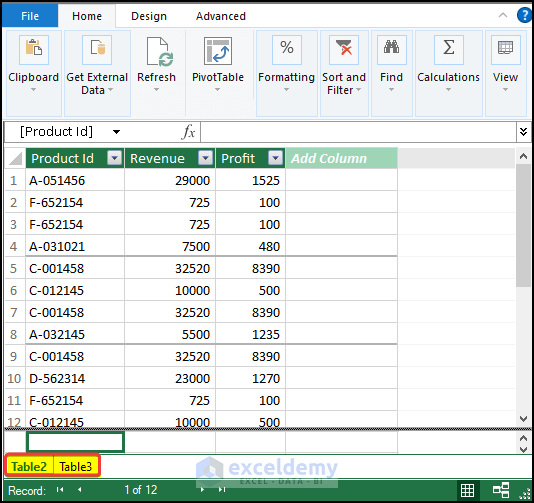
- In the data model, both tables are loaded.
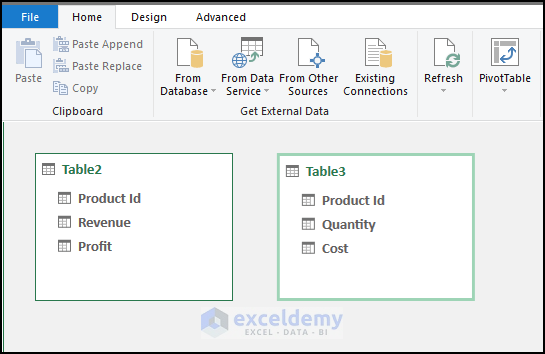
- Switch to the Diagram view by clicking on the Diagram view in the Home tab.
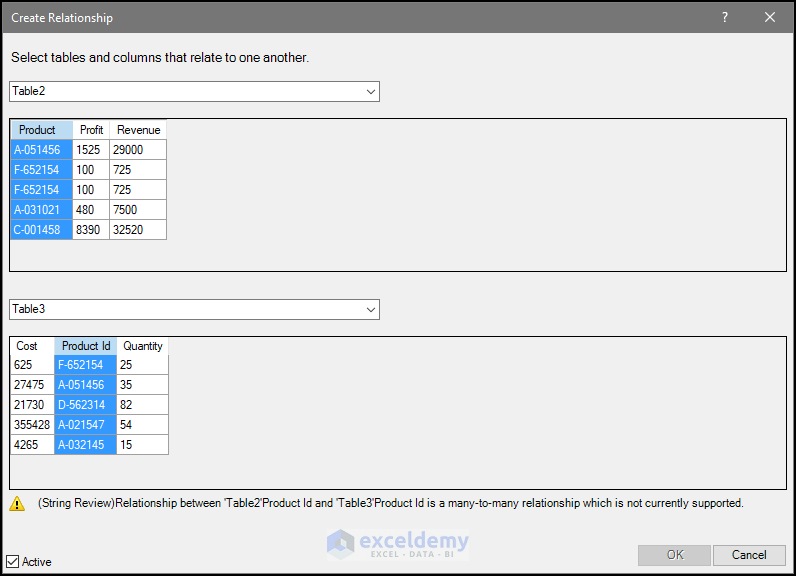
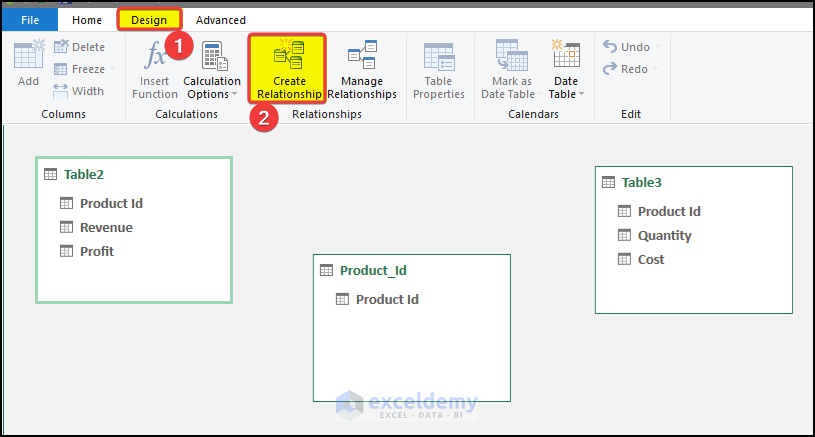
- From the Design tab, click on Create Relationship.
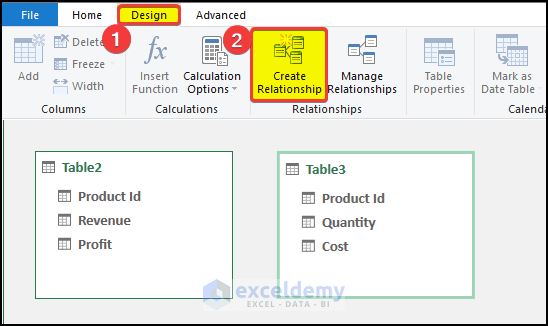
- In the Create Relationship dialog box, select Table2 and Table3 in the dropdown box.
- A warning sign will be displayed.
- Click Cancel.
- Open a power query and append two separate tables.
- Using that appended table we are going to create Relationships that will help us to obtain the desired results.
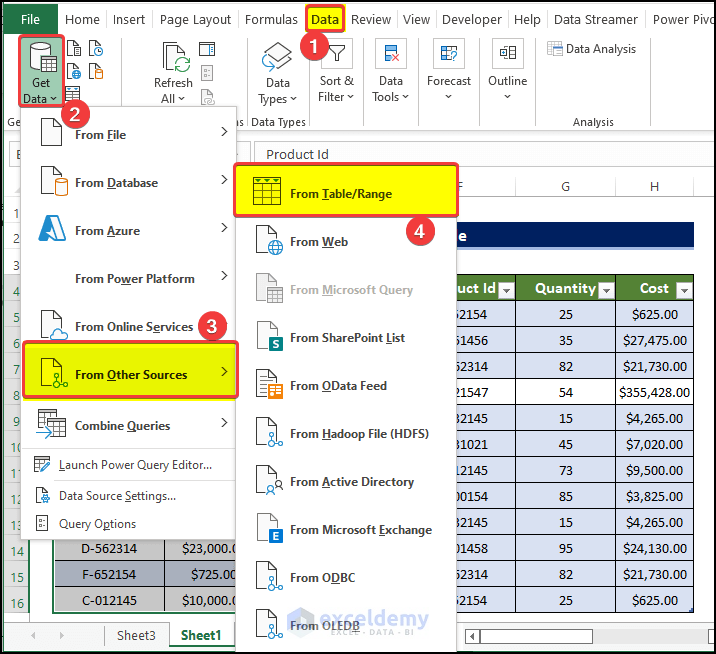
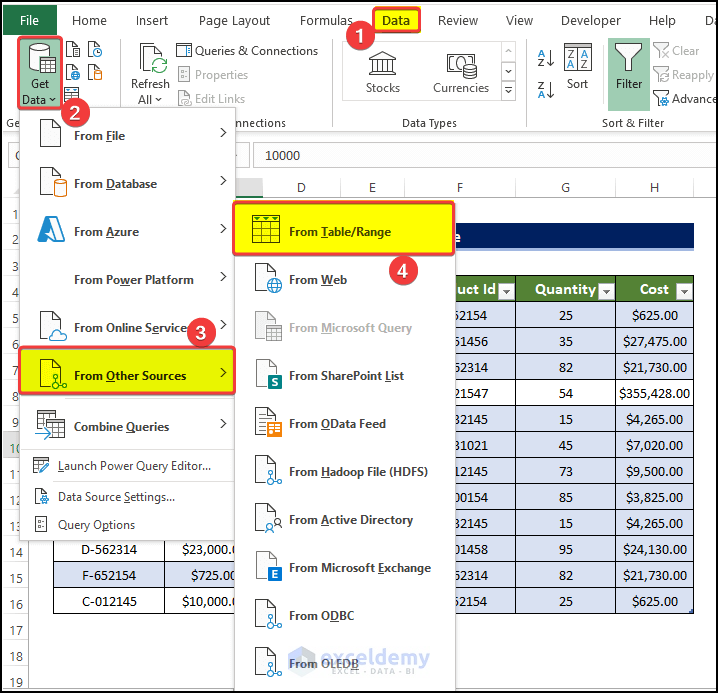
- Select the Table2.
- From the Data tab, go to Get Data > From Other Sources > Form Table/Range.
- Table2 is now loaded in the new window.
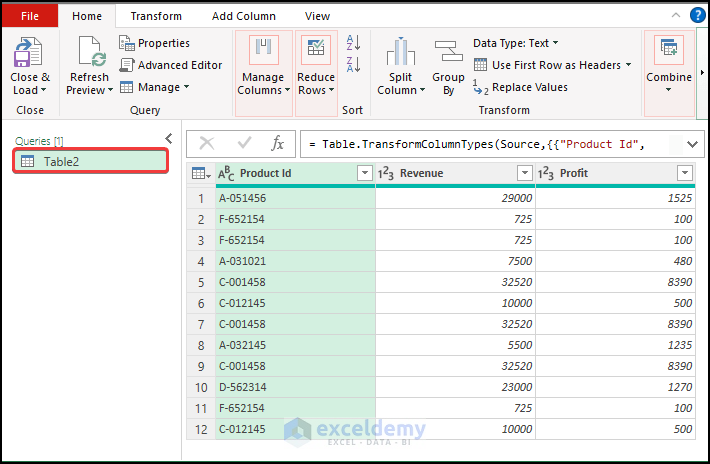
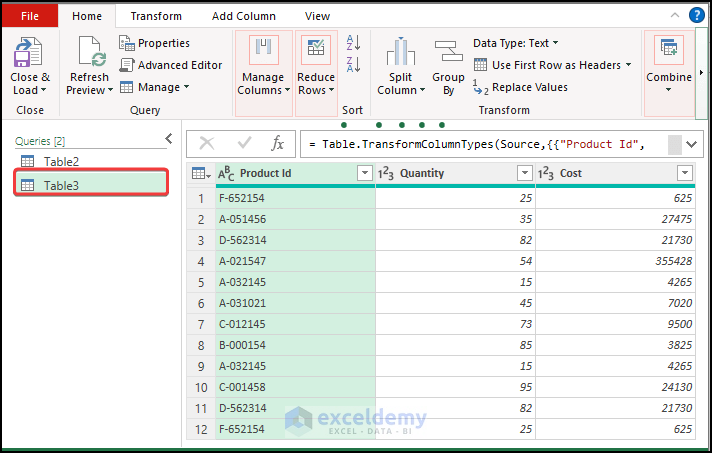
- Follow the same steps for Table3.
- Right-click on Table2, and click on the Add as New Query.
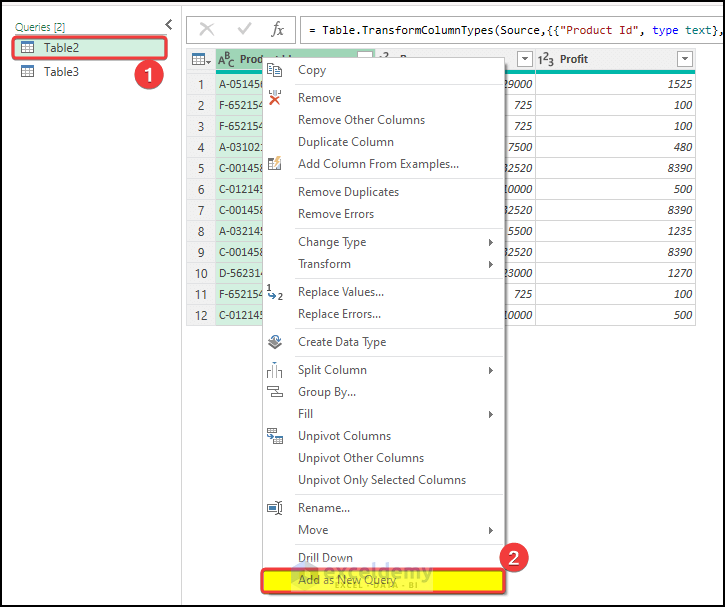
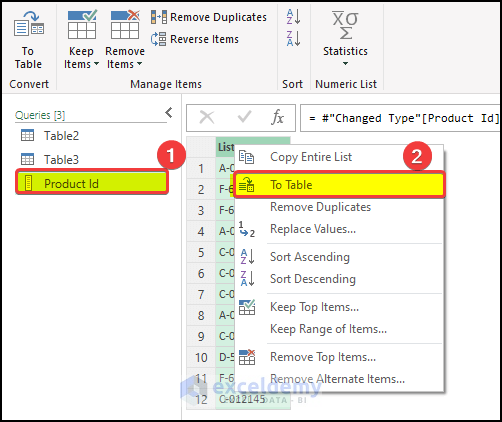
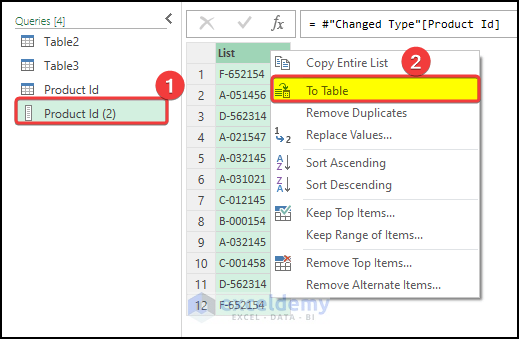
- From the new query listed, right click on the List.
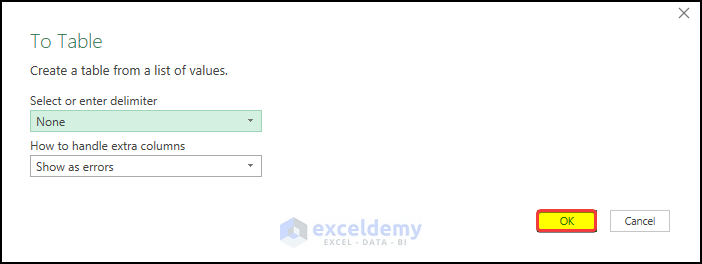
- Click on To Table.
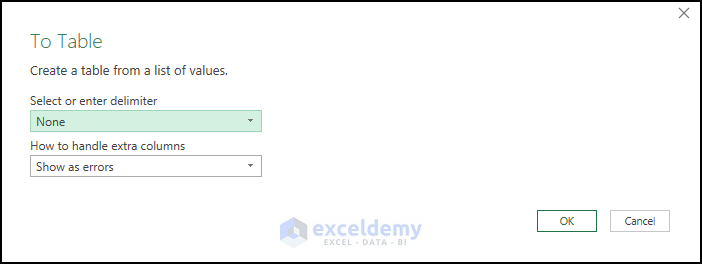
- In the next window, click OK.
- Right-click on Table2 and click on the Add as New Query.
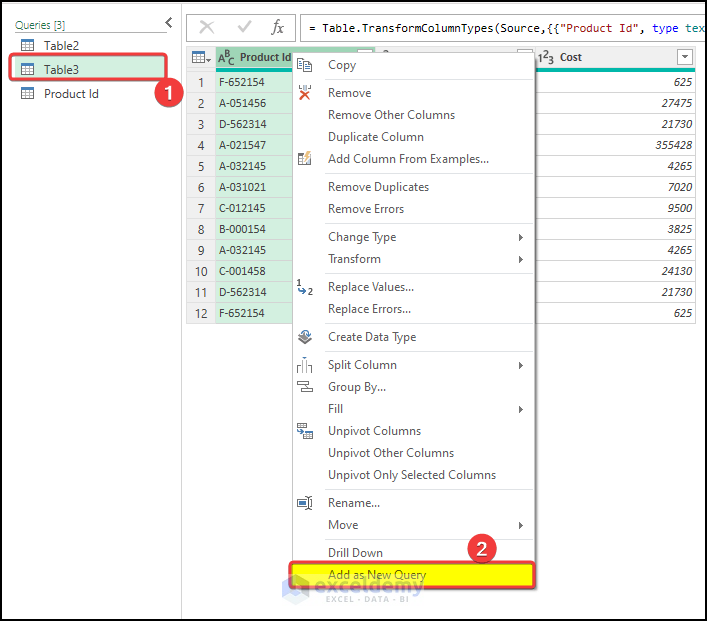
- From the new query listed, right click on the List.
- Click on To Table.
- In the next window, click OK.
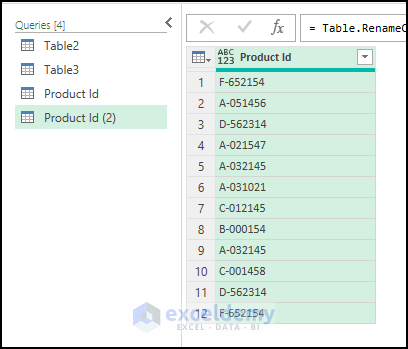
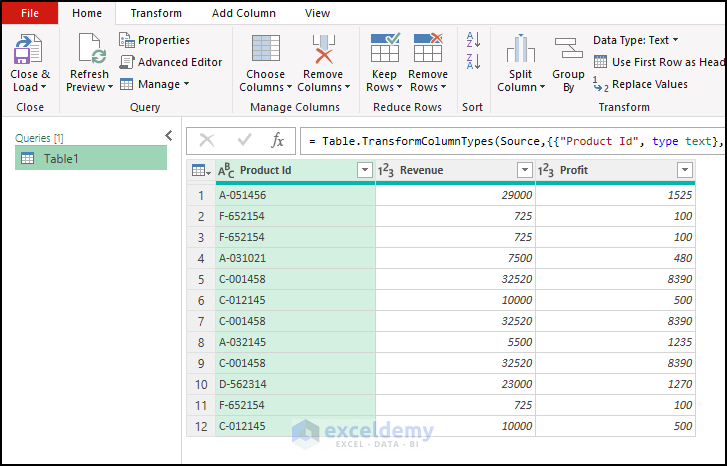
- We now have two separate columns that are excluded from their table, in different queries.
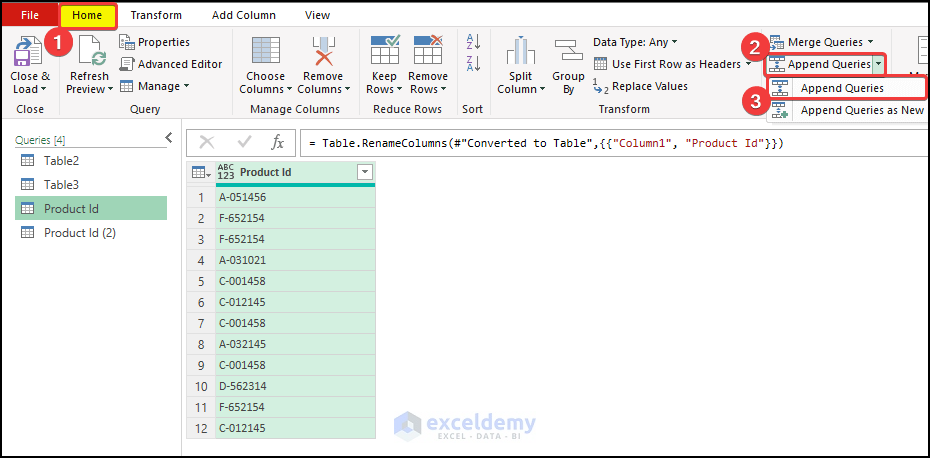
- Append the Product Id and Product Id (2).
- Select table Product Id and click on the Append Queries from the Combine group.
- From the drop-down menu, click on the Append Queries.
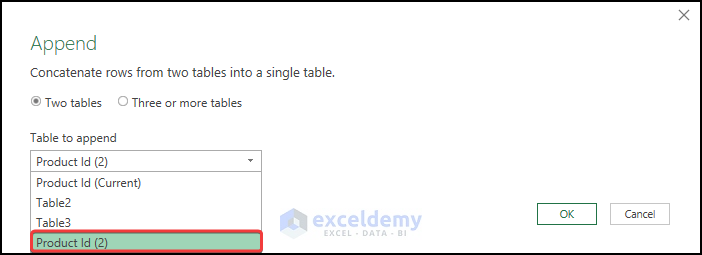
- A window will appear.
- Click on the Product Id (2), from the Table to append option.
- Click OK.
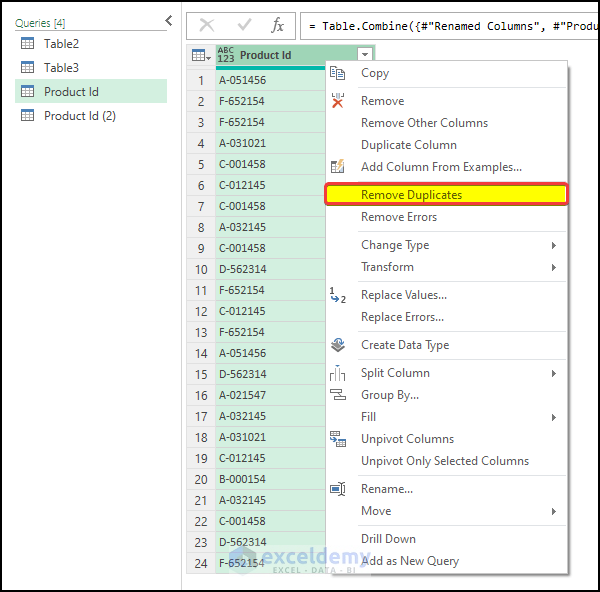
- Product Id (2) table now appends with the Product Id table.
- In the newly appended table, right-click on the table and select Remove Duplicates.
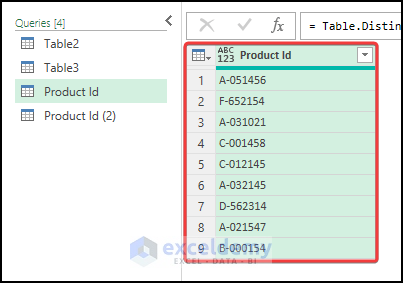
- All of the Duplicates are removed.
- Close the power query table. Click on Keep.
- The newly created tables will load in separate sheets.
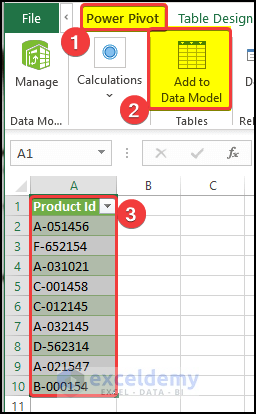
- Go to the worksheet named Product Id.
- Click on the Add to Data Model, from the Power Pivot tab.
- The new table is now available at the Power pivot.
- In the Design tab, click on Create Relationship.
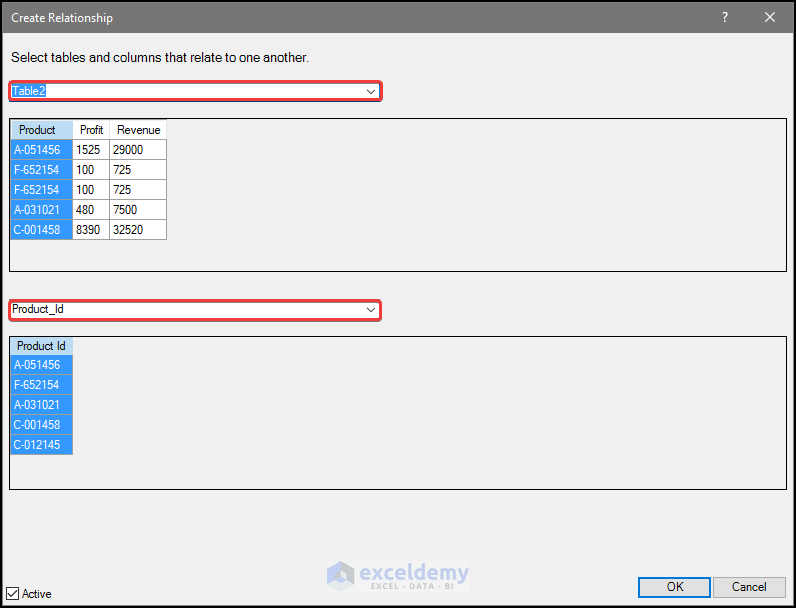
- In the Create Relationship window, select Table2 and Product Id.
- Click OK.
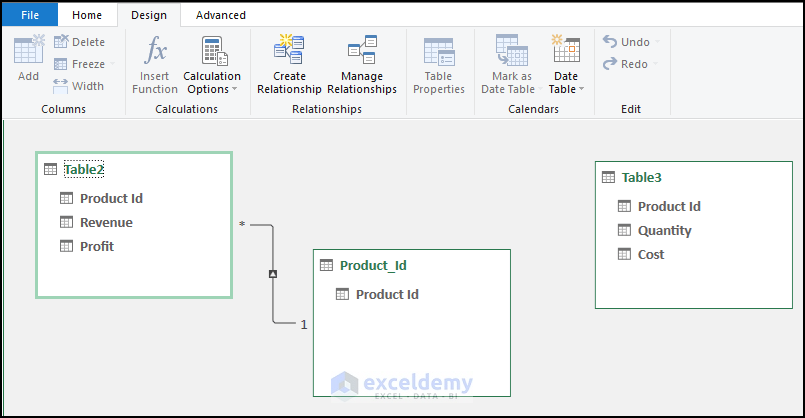
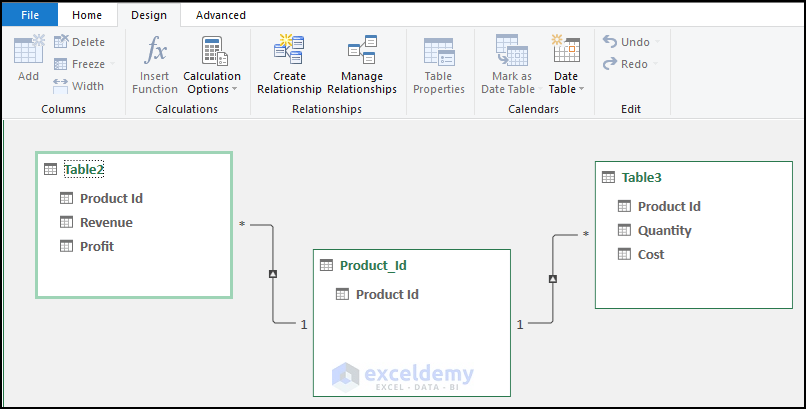
- In the diagram view, we can see that there is a Relationship created between Table2 and Product Id.
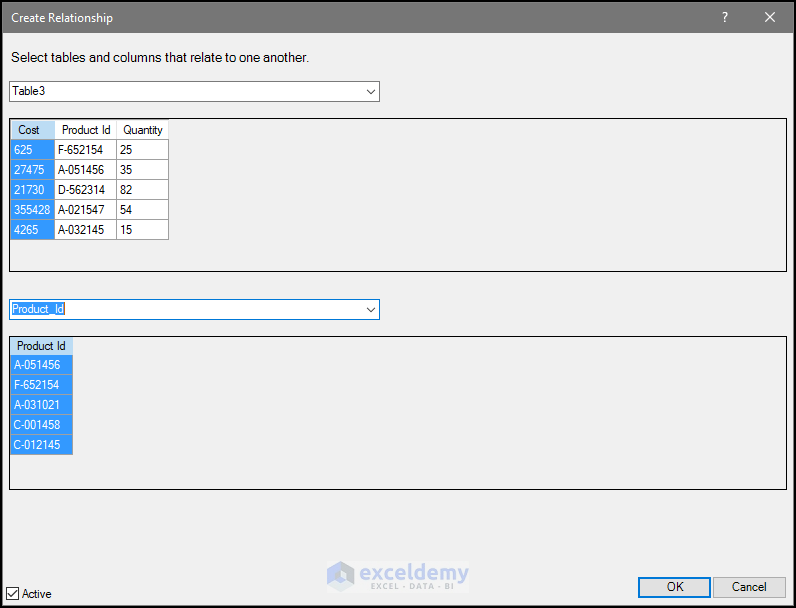
- In the Create Relationship window, select Table3 and Product Id.
- Click OK.
- In the diagram view, we can see that there is a Relationship created between Table3 and Product Id.
- Go to the original pivot table report.
- Remove all the existing fields and enter the fields shown below.
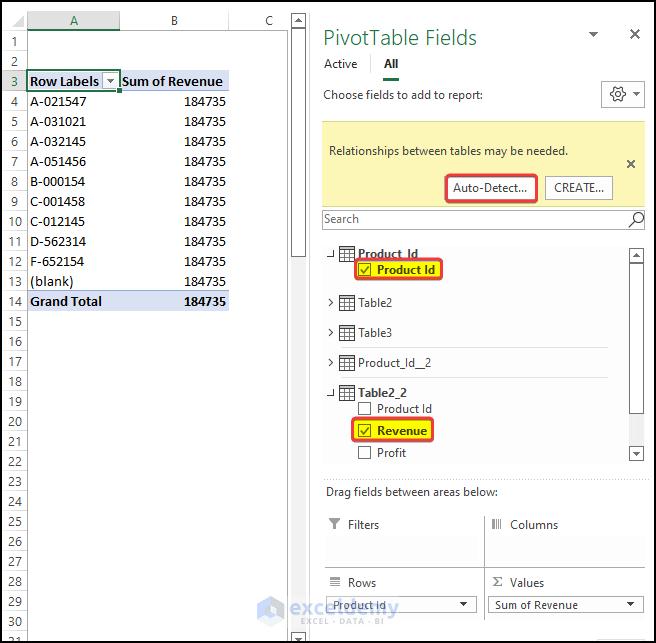
- Add the Product Id field in the Rows.
- Drag the Revenue to the values.
- You can see some issues are present.
- There is a yellow notice area, which indicates the presence of a Relationship among the tables.
- Click on the Auto-Detect.
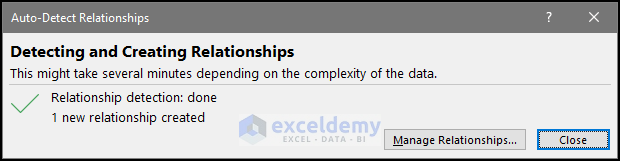
- A dialog box will appear.
- It will take some time to link the Relationship.
- The Relationship will be found and linked.
- Click Close.
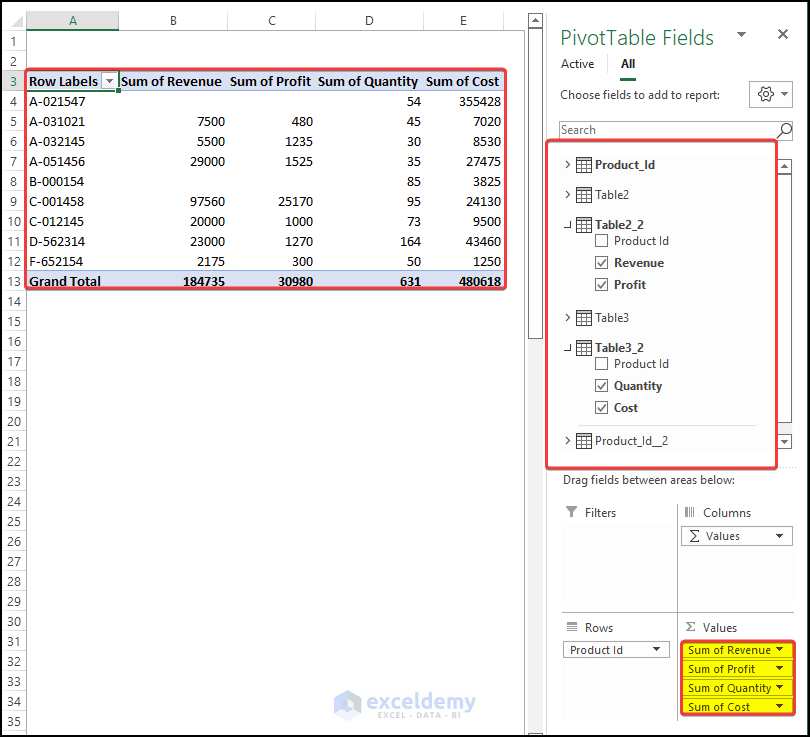
- Drag Revenue and profit from Table2_2.
- Drag the quantity and cost from Table3_2.
- If there is any Relationship, a yellow warning is shown, click Auto Detect.
- The pivot table is showing the correct values, according to the Relationship we created earlier.
Read More: Create Entity Relationship Diagram from Excel
Method 2 – Deleting Duplicate Values
Steps:
- We have two separate tables between which we need to create a Relationship, based on the common column Product Id.
- In order to create Relationships among tables, we need to have unique values in one of the tables.
- But here we have Duplicate values in both of the table’s Product Id columns.
- Select the range of cells B4:C16 and click on the Table command from the Insert tab.
- In the Create Table dialog box, re-confirm the table range.
- Check the My table has headers checkbox.
- Select the range of cells B4:C16 and click on the Table command from the Insert tab.
- In the Create Table dialog box, re-confirm the table range.
- Check the My table has headers checkbox.
- Open a power query and delete Duplicate values from the table.
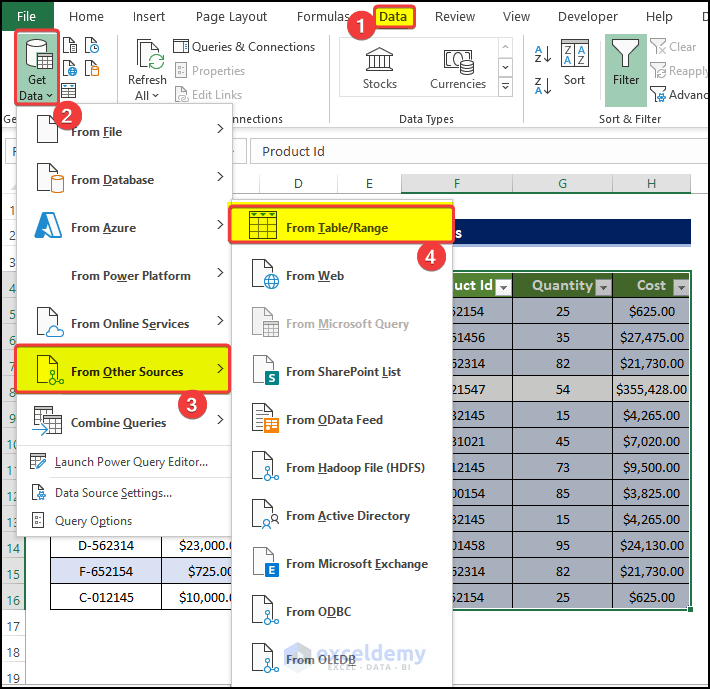
- Select the Table1.
- From the Data tab, go to Get Data > From Other Sources > Form Table/Range.
- A new window opens.
- Table1 is now loaded.
- Follow the same steps for Table2.
- In Table1, right-click on the Product Id and select Remove Duplicates.
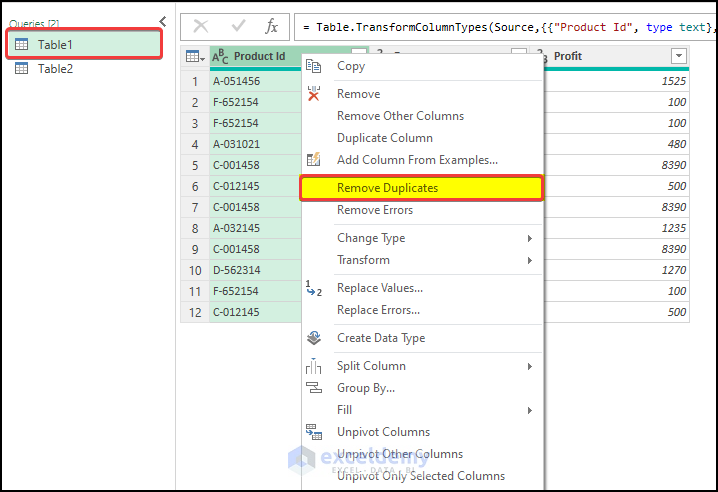
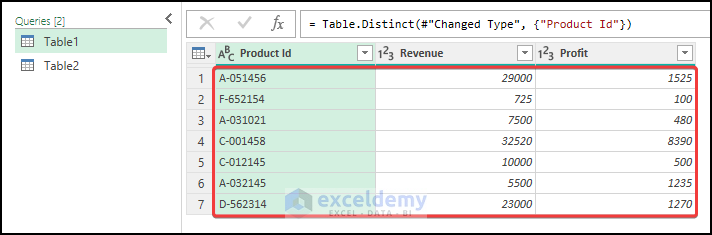
- All of the Duplicates are now removed.
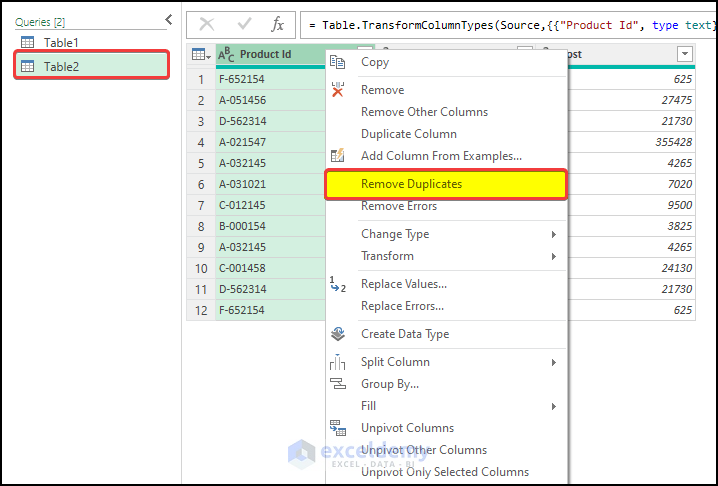
- Do the same for Table2.
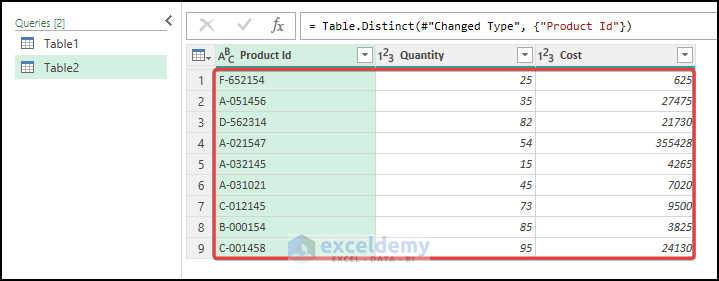
- In Table2, right-click on the table and select Remove Duplicates.
- The table will look like the one below.
- Click on the Close & Load To from the Home tab.
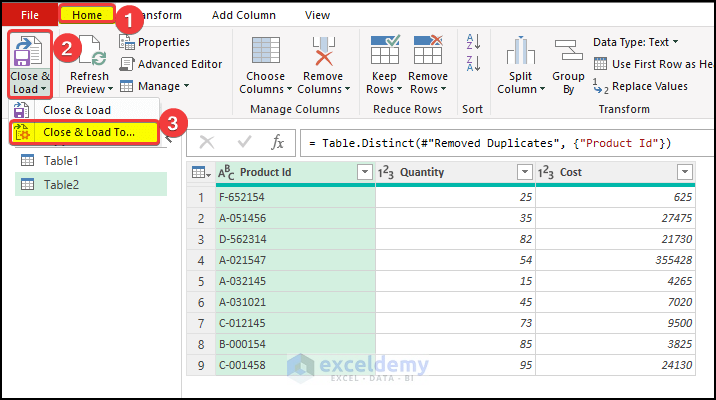
- The table will load in different sheets.
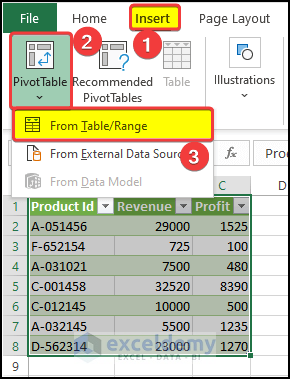
- Add them to the pivot table.
- Select the loaded Table1 and go to Insert tab > PivotTable > From Table/Range.
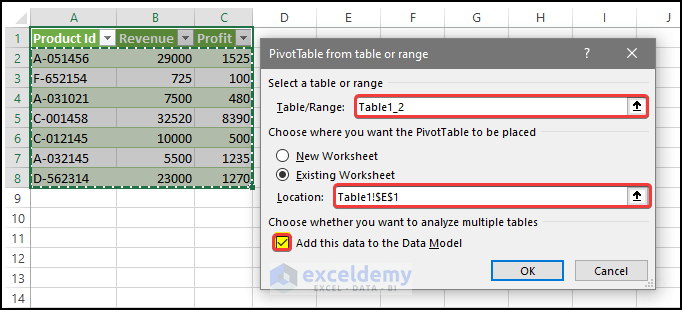
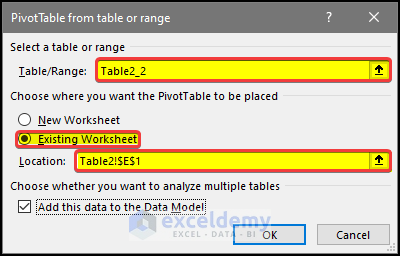
- In the next dialog box, click on the Existing Worksheet and the location of the table.
- Check the Add this data to the Data Model checkbox.
- Click OK.
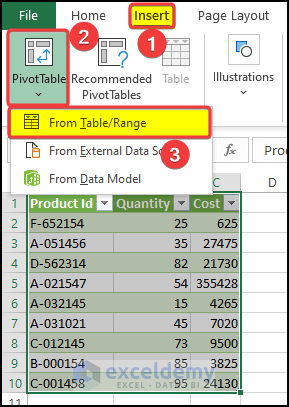
- Select the loaded Table2 and go to Insert tab > PivotTable > From Table/Range.
- In the next dialog box, click on the Existing Worksheet and the location of the table.
- Tick the Add this data to the Data Model checkbox.
- Click OK.
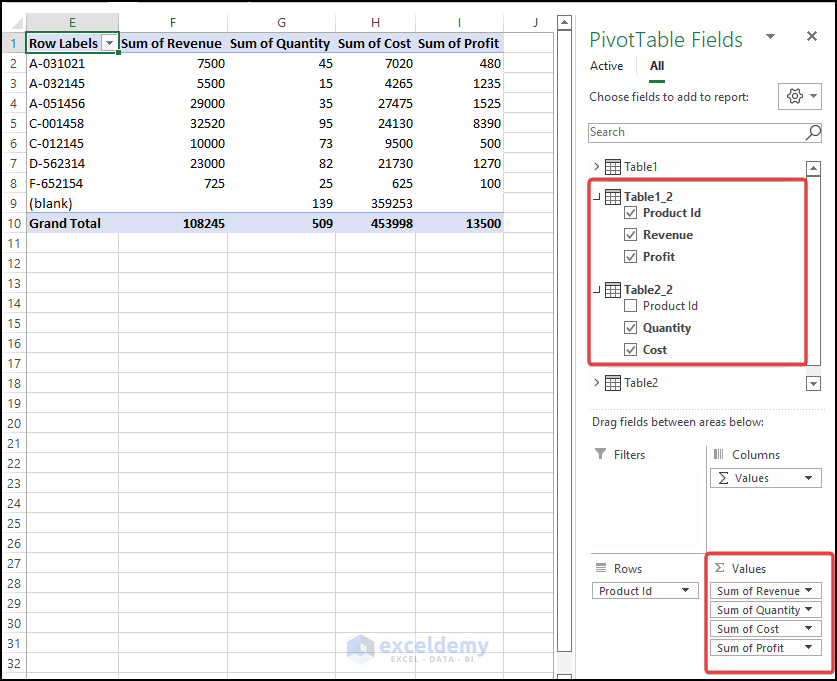
- Drag the Product Id from Table1_2 to the Rows.
- Drag Revenue and Profit from Table1_2 and Cost and Quantity from Table2_2 to the values.
- The value of the cost and quantity columns in the pivot table are incorrect.
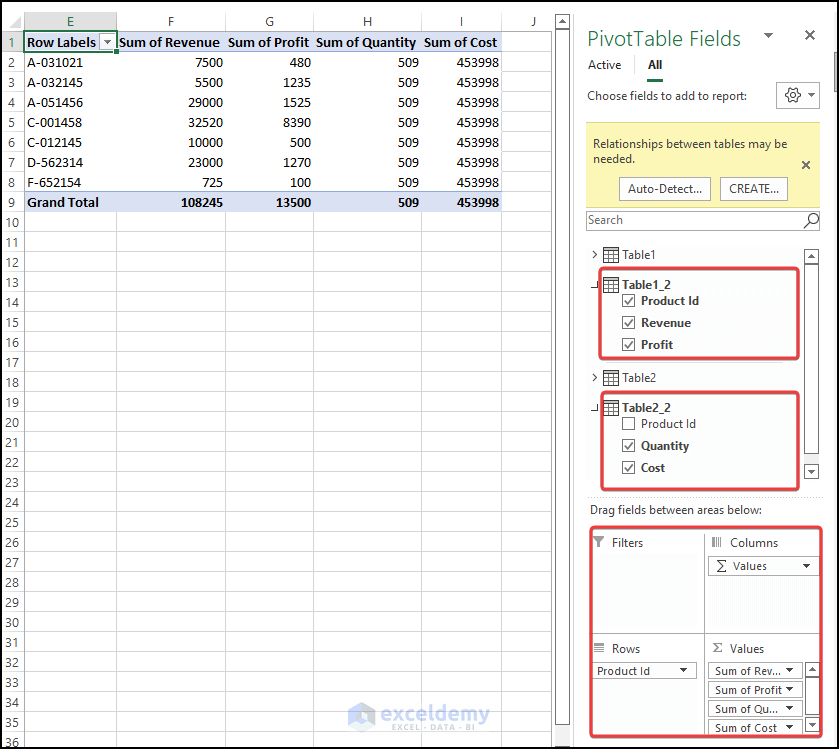
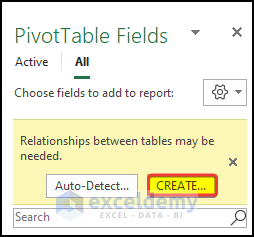
- To resolve this, click on CREATE on the Yellow Warning box.
- In the Edit Relationship window, choose Table2_2 and Table 1_2 in the first and second dropdown menus.
- Select Product Id in both the Column (Foreign) and Related Column (Primary) dropdown menu.
- Click OK.
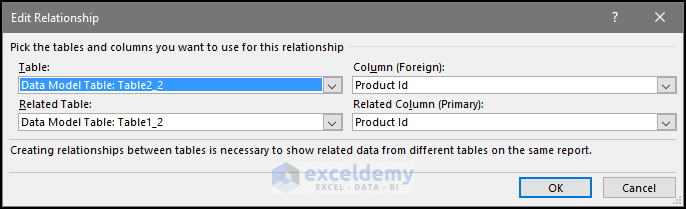
- The Relationship will solve the issue and the Cost and Profit columns will show accurate values.
Read More: How to Create Data Model Relationships in Excel
Download Practice Workbook
Related Articles
- How to Manage Relationships in Excel
- How to Make One to Many Relationship in Excel
- How to Create Table from Data Model in Excel
- [Fixed!] Excel Data Model Relationships Not Working
<< Go Back to Create Relationships in Excel | Data Model in Excel | Learn Excel

