Here’s an overview of Power Pivot formulas:
Download the Practice Workbook
Understanding DAX Formulas in Power Pivot
DAX (Data Analysis Expressions) is a formula language used in Microsoft Power BI, Power Pivot, and Analysis Services Tabular models. It allows users to create custom calculations, calculated columns, and measures for data analysis and modeling.
DAX formulas resemble Excel formulas, but they operate on entire tables or columns of data, rather than individual cells. This makes DAX powerful for handling large datasets and performing advanced calculations. DAX is designed to work with data models, which consist of tables and relationships between them.
DAX formulas can include various functions and operators to manipulate data, perform calculations, filter data, create aggregations, and implement business logic.
Power Pivot Formulas: 2 Suitable Examples
If Power Pivot is not enabled in Excel, you need to enable it then import the data into it.
- Select a random cell in your data.
- Go to the Power Pivot tab.
- Click Add to Data Model.
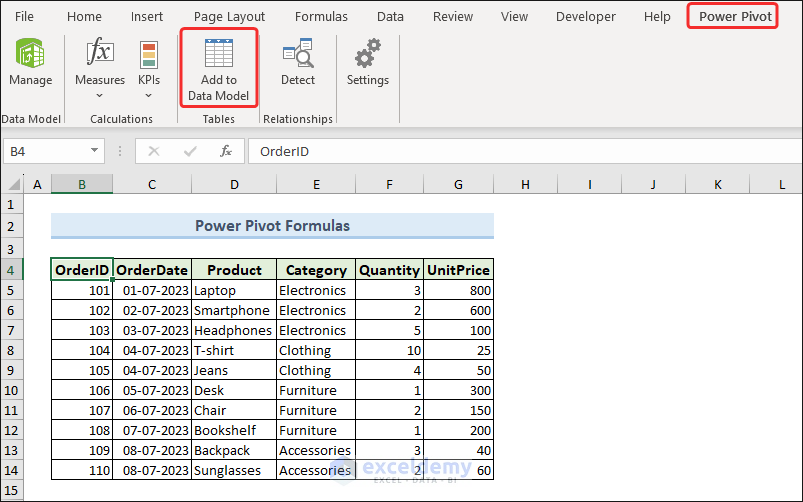
- Click OK in the Create Table dialog box.
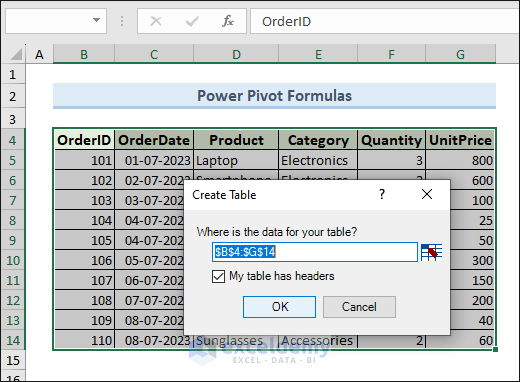
This command will import your data to the Power Pivot window.
You can create formulas in Power Pivot either in calculated columns or in measures.
Example 1 – Calculated Columns in Power Pivot
A calculated column in Power Pivot is a column created using a DAX formula that defines its values, and it can be used in PivotTables just like regular data columns. Formulas applied in calculated columns are similar to Excel formulas. But the difference is that they are applied to the entire column.
The calculated column’s formula is applied to each row in the table, resulting in a new column of data with the computed values.
Calculated columns are suitable for operations that need to be performed row-by-row, like simple calculations or data transformations.
These columns become a part of the underlying data table and can be used in regular Excel formulas and charts just like any other column.
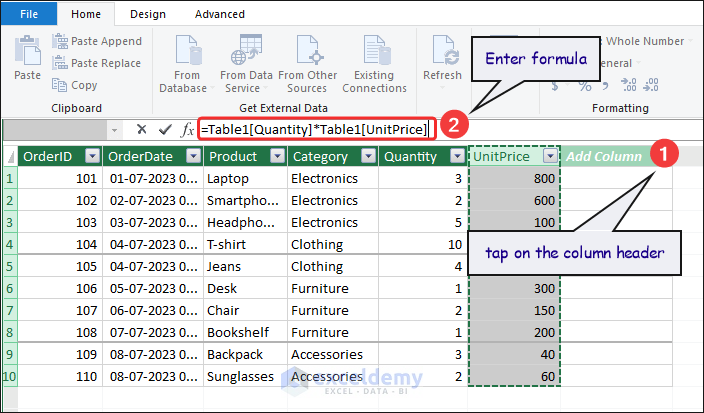
- On the right side of your data in the Power Pivot window, you will find an extra column: “Add column”.
- Tap on the column header.
- Type an equal sign (=) and enter the formula. Just tap on the column header based on which you want to perform the calculation and you will see it in the formula. We wanted to find out the Total Price from the Unit Price and Quantity, so we entered the following formula.
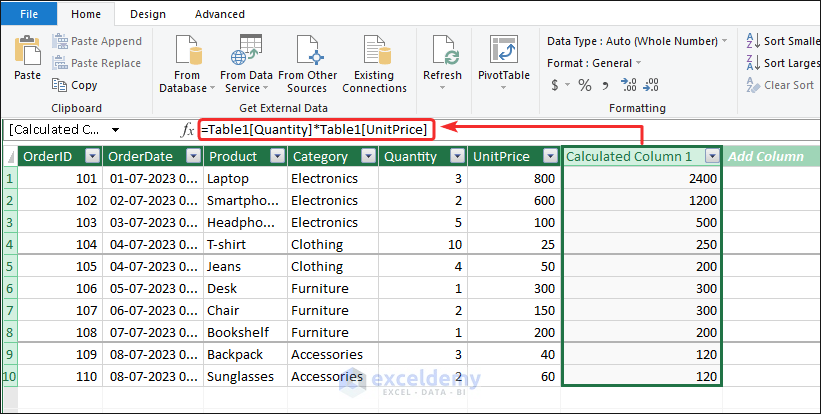
=Table1[Quantity]*Table1[UnitPrice]- Press Enter and you will get the Total Price along the whole column.
In this way, you can create valid DAX formulas in the power pivot.
You can also use the Excel function in Power Pivot. We used the TODAY function, and it inserts the date of today along the entire column.
=TODAY()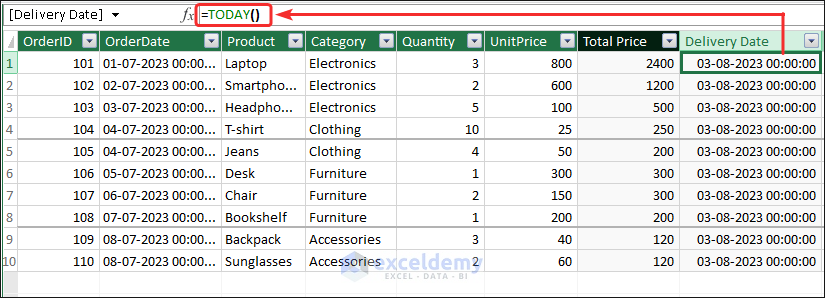
In this way, you can use formulas in the Pivot table in a calculated column. After performing calculations in a calculated column, by default, it is named Calculated Column 1, Calculated Column 2, .. etc. However, you can change the default name of the calculated column.
Example 2 – Measures in Power Pivot
Measures, on the other hand, are calculations used in PivotTables or Power Pivot tables for aggregating data (SUM, COUNT, MIN, MAX, or AVG) across multiple rows or entire tables. These are useful for creating dynamic calculations such as sums, averages, percentages, or any other aggregation based on the data in the Pivot Table.
Unlike calculated columns works row-by-row and become part of the data model, the application doesn’t store measures in the data model.
Some key features of Measures are:
- Measures are created using the DAX language, which is specific to Power Pivot and Power BI. DAX provides a rich set of functions and operators to perform a wide range of calculations.
- Measures are dynamic and adjust their values based on the filters, row labels, and column labels in the Pivot Table. They calculate the data visible in the current context, allowing for interactive and flexible data analysis.
- Power Pivot optimizes the calculation process to improve performance. It caches results when possible, reducing the need to recalculate the measure for every interaction.
- Measures have unique names within the data model. It’s essential to choose meaningful and distinct names for measures to avoid confusion and ensure accuracy.
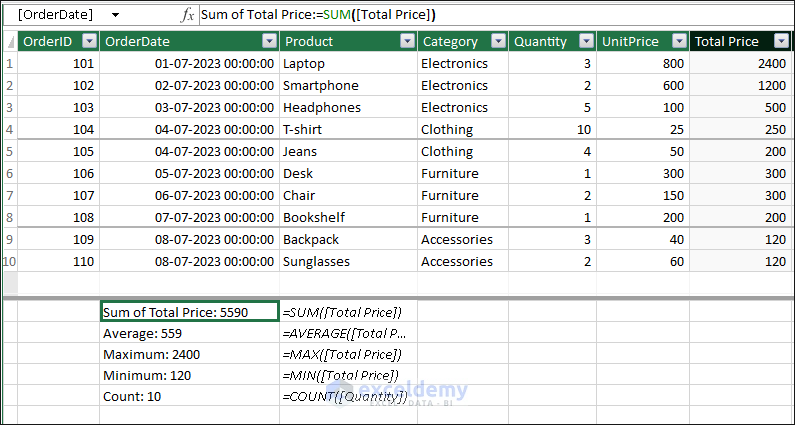
Under the data table in the Power Pivot window, there is a calculation area marked by a horizontal line. You have to apply your formula in that region.
Here, we have shown the use of SUM, AVERAGE, MAX, MIN, and COUNT functions for our data table in Power Pivot.
Frequently Asked Questions
How are Power Pivot formulas different from regular Excel formulas?
Regular Excel formulas operate on individual cells, while Power Pivot formulas work on entire columns or tables. Additionally, Power Pivot formulas use the DAX language, which offers more advanced functions and capabilities than regular Excel functions.
Can I use Power Pivot formulas with data from different sources?
Yes, Power Pivot can handle data from diverse sources like Excel tables, databases, SharePoint lists, and more. You can blend and transform data from different sources using Power Query and then create formulas in Power Pivot for analysis.
What is the difference between calculated columns and measures in Power Pivot?
Calculated columns work row-by-row and become part of the data model, while measures work on-the-fly based on the context of the Pivot Table. Measures are used for aggregations and calculations in PivotTables, while calculated columns are ideal for row-level transformations.
Key Takeaways from the Article
- Power Pivot formulas enable users to perform sophisticated data analysis by using the DAX language.
- Unlike regular Excel formulas, Power Pivot formulas work on entire columns or tables, providing dynamic results based on the data’s context.
- Calculated columns and measures in Power Pivot enable users to build efficient data models, combining data from multiple sources and handling large datasets with ease.
Power Pivot Formulas: Knowledge Hub
<< Go Back to Power Pivot Excel | Learn Excel
Get FREE Advanced Excel Exercises with Solutions!

I want to learn excel technology.
Hello Mohammad Afzal,
It’s great decision. ExcelDemy can help you to start your learning. Our website contents are designed to help you learn Excel from basics to advanced.
Follow our Learn Excel page here you will find all the topics related to Excel.
Explore all the Tutorial categories to explore more. We also provide courses to learn Excel technology.
Regards
ExcelDemy