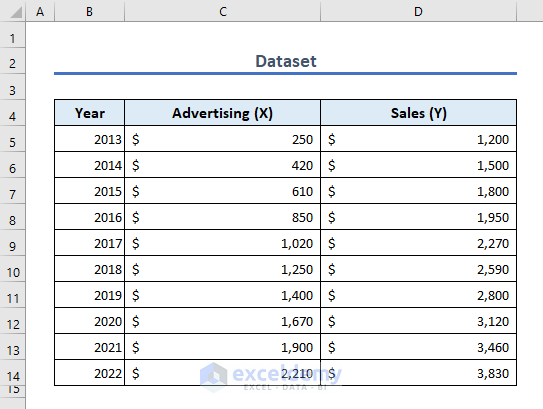
Excel is a popular tool for doing regression analysis because it has a user-friendly interface and a variety of features. Here’s the dataset we’ll use to demonstrate how you can use the program to perform the analysis.
Download Practice Workbook
What Is Regression Analysis?
Regression analysis is an important statistical tool. It predicts values that depend on two or more variables. It can be used to predict future trends by examining the direction and slope of the regression line.
1. What Is Simple Linear Regression?
Simple linear regression shows the relationship between a single independent and dependent variable. It can be calculated by the following mathematical equation:
The variables are,
Y = Dependent Variable
m = Slope of the Regression Formula
X = Independent Variable
C = Intercepted value of the Y-axis
Ε = Error Term, the difference between the actual value and predicted value.
2. What Is Multiple Linear Regression?
Multiple linear regression shows the relationship between a dependent variable and several independent variables. The equation for calculating multiple regression analysis is as follows.
Where,
Y is the dependent variable
b is the intercept
X1 and X2 are the independent variables
b1 and b2 are coefficients of the corresponding independent variables.
How to Perform Regression Analysis in Excel
Method 1 – Perform Regression Analysis in Excel Using LINEST Function
The syntax of the LINEST function is as follows:
=LINEST(known_y’s, [known_x’s], [const], [stats])We’ll use the following dataset to perform regression analysis using the LINEST function.
- Go to cell C17 to insert the following formula and press Enter:
=LINEST(D5:D14,C5:C14)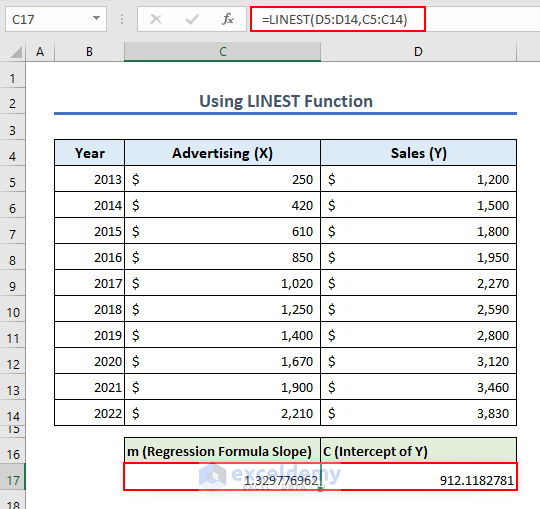
Formula Explanation:
D5:D14 is the range of independent variable data points.
C5:C14 is the range of the dependent variable data points.
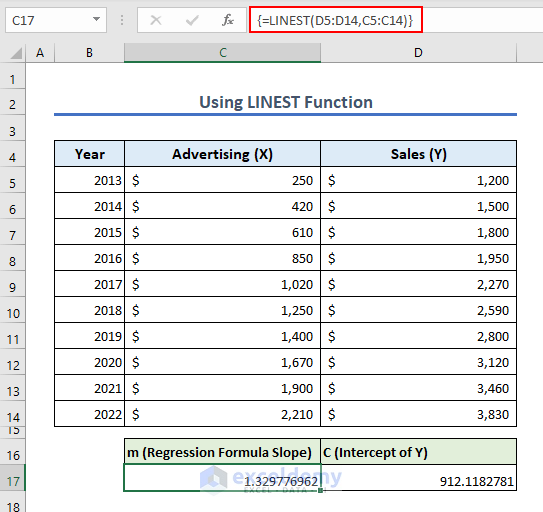
The LINEST function returns an array. If your Microsoft Office version is older than Office 365, then you have to press Ctrl + Shift + Enter simultaneously instead of Enter. The formula will look like this.
Method 2 – Regression Analysis Combining INTERCEPT, SLOPE, and CORREL Functions
- Insert the following formula on Cell D16 to get the value of C which represents the intercepted value of the Y-axis:
=INTERCEPT(D5:D14,C5:C14)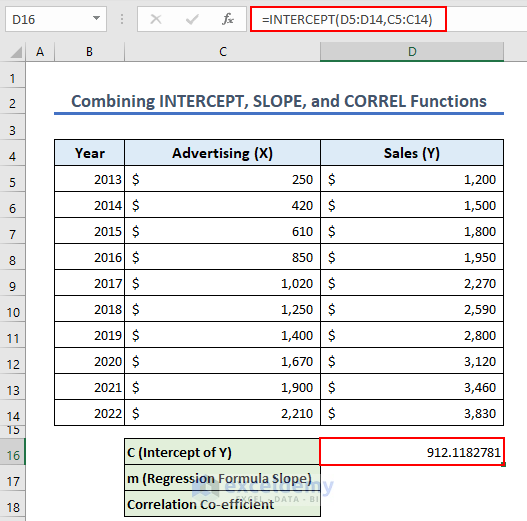
- We will use this value to calculate the slope m. Insert the following formula on cell D17:
=SLOPE(D5:D14,C5:C14)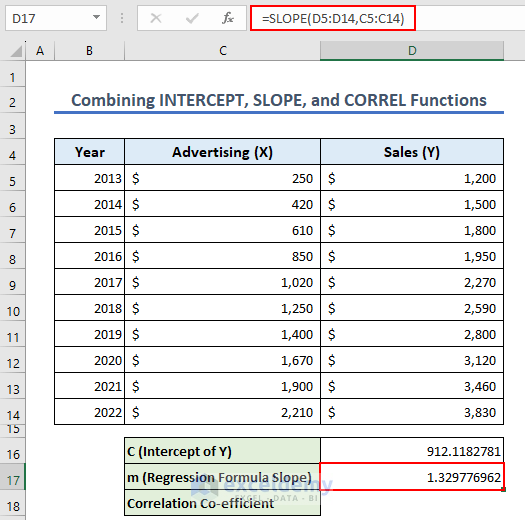
- Insert the following formula on cell D18 to calculate Correlation Co-efficient:
=CORREL(C5:C14,D5:D14)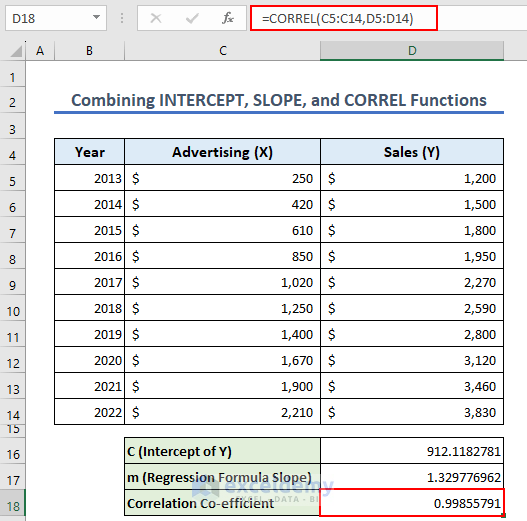
Method 3 – Perform Regression Analysis in Excel Using Data Analysis ToolPak
Case 3.1 Simple Linear Regression in Excel with Analysis ToolPak
To enable Analysis ToolPak:
- Go to the File tab and select Options. Excel Options window will appear.
- Select Add-ins.
- Choose Excel Add-ins option from the Manage drop-down list.
- Click on Go.
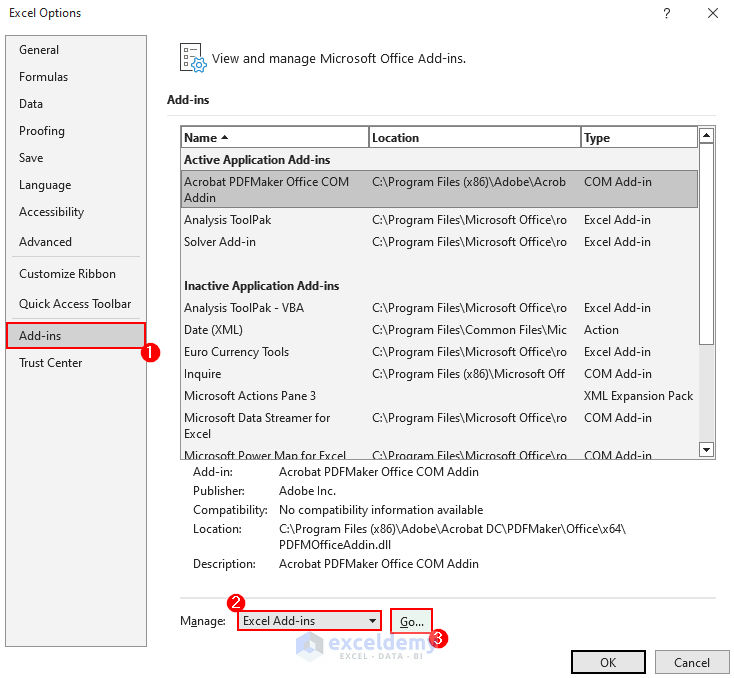
- Add-ins dialog box pops up. Check Analysis ToolPak and click on OK.
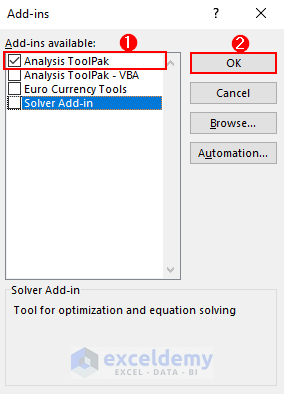
- You will be able to use the Data Analysis ToolPak.
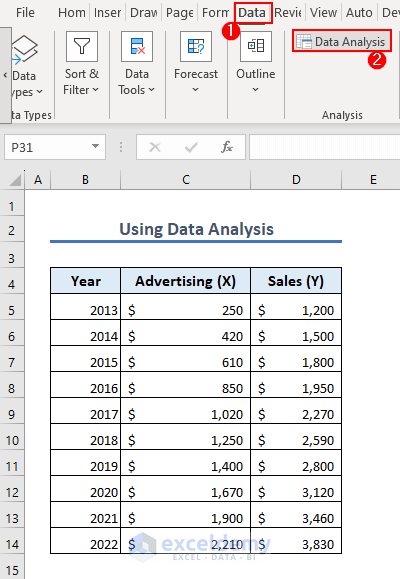
- Go to the Data tab and select Data Analysis.
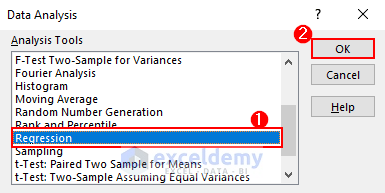
- A popup window appears. Select Regression and click on OK.
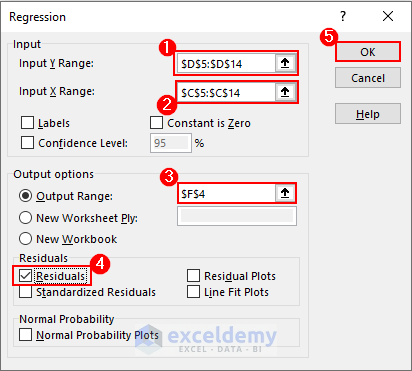
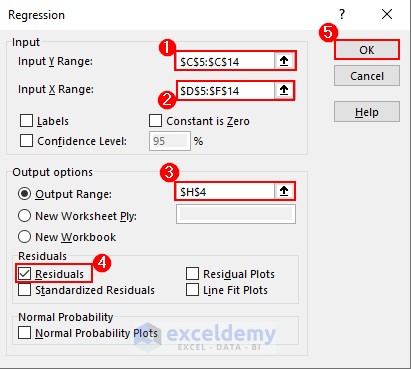
- The Regression dialog box pops up. Insert data range or values in the Input Y Range, Input X Range, and Output Range.
- Check Residuals to determine the error between the predicted and actual values.
- You can even select a new worksheet to show the output there. Click on OK.
- Simple linear regression analysis is done, and the result of the regression analysis is shown.
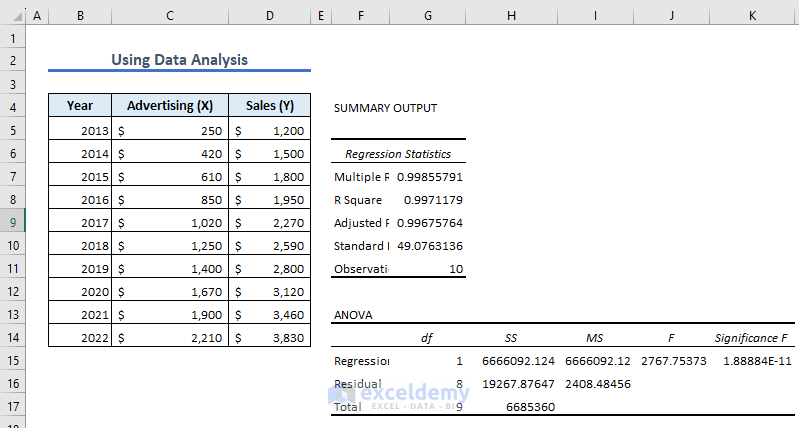 For a detailed view click on the image.
Case 3.2 – Perform Multiple Linear Regression Analysis in Excel with Analysis ToolPak
To perform multiple linear regression analysis, we have the following dataset. Our dataset consists of the price of the car varies depending on the Maximum Speed, Peak Power, and Range.
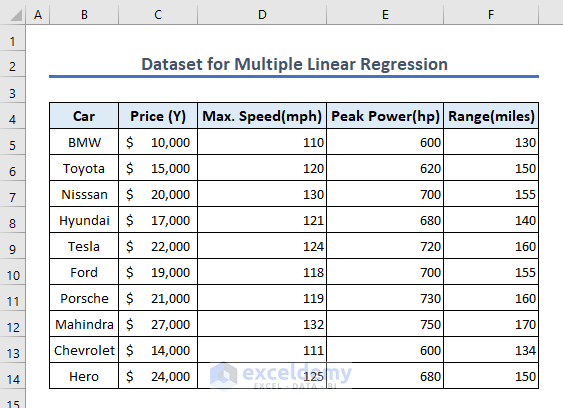
Performing multiple linear regression analysis using Analysis ToolPak is essentially the same as simple linear regression analysis. The only difference is in the input X range.
- Input the corresponding values and click on OK.
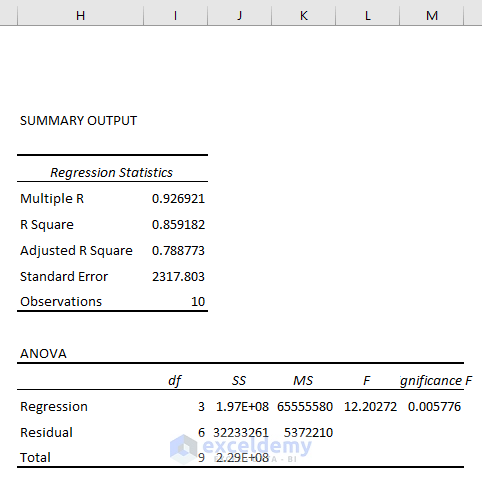
- Multiple linear regression analysis is done and the results are displayed.
How to Interpret Regression Analysis Result?
Performing regression analysis is quite easy. However, understanding the output may seem difficult if you do not know what the terms mean.
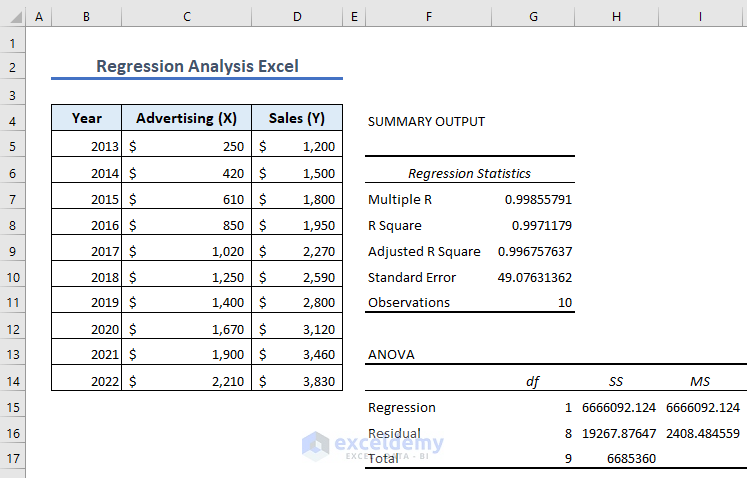
Summary Output
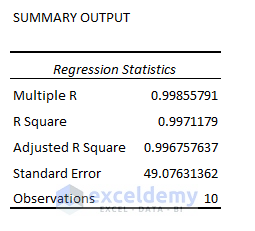
Multiple R: Multiple R indicates the correlation between variables. Its value ranges from -1 to 1. The bigger the value, the stronger correlative the relationships are.
- 1 indicates a strong positive correlation between the variables.
- -1 indicates a strong negative correlation between the variables.
- 0 indicates that there is no correlation at all between the variables.
R Square: It symbolizes the Coefficient of Determination. It indicates how well the data model fits the Regression Analysis. An R-squared value of more than 95% is generally regarded as a good fit for a regression model. In our example, the value of 0.997 is pretty good. The regression analysis model is a good fit for the data, as almost 99% of the values fall within the predicted range.
Adjusted R Square: The value of R^2 is used in multiple variables Regression Analysis instead of R square. The adjusted R-squared is a metric that takes into account the number of independent variables included in the model.
Standard Error: It shows a healthy fit of Regression Analysis. A smaller number for the regression equation provides increased certainty in its accuracy and reliability. It shows the average distance of data points from the Linear equation.
Observations: The number of iterations in the data model.
ANOVA
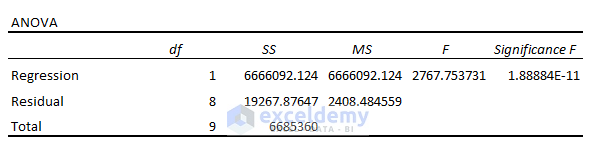
ANOVA means Analysis of Variance. It is the second part of the analysis result.
df: df expresses the Degrees of Freedom. It can be calculated using the df=N-k-1 formula where N is the sample size, and k is the number of regression coefficients.
SS: Sum of Squares symbolizes the good to fit parameter. The Sum of Squares is the square of the difference between a value and the mean value. The higher value of the Sum of Squares refers to a higher variation in the values or vice-versa.
MS: It means the Mean Square. Mean Square is mainly the mean of the square of the variation of an individual value and the mean value of the set of observations.
F: F refers to the Null Hypothesis. It tests the overall significance of the regression model. If you divide the MS of regression by the MS of Residual, you’ll get the F-test.
Significance F: The P-Value of F. Significance F is a crucial term to find the output of your model whether it is statistically significant or not. When the value of the Significance F is not greater than 0.05, the independent variables have a statistically significant relationship with the dependent variable.
Coefficients
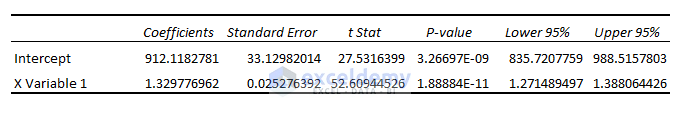
It helps to calculate the Y values easily. You can build a linear regression equation with the help of this.
Standard Error: This is the standard deviation of least square estimates.
t Stat: Refers to the coefficient being equal to zero in the case of the null hypothesis.
P-value: The P-value shows the statistically significant relationship between the independent and dependent variables. Here, P-value for Unit Price is 0.000003 which is below 0.05. So, Unit Price is statistically significant with the Sales.
Lower 95%: It means the lower limit when the confidence interval is 95%.
Upper 95%: It is the upper limit of the confidence interval.
Residual Output
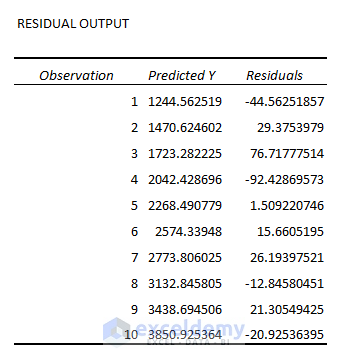
This compares the estimated value with the calculated value.
How to Make Linear Regression Graph in Excel
Charts can visually represent the relationship between the variables of linear regression.
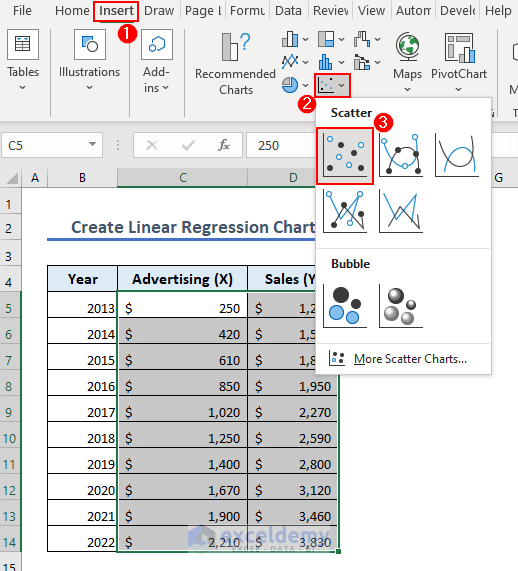
- Select the regression data and go to Insert tab > Charts group > Scatter.
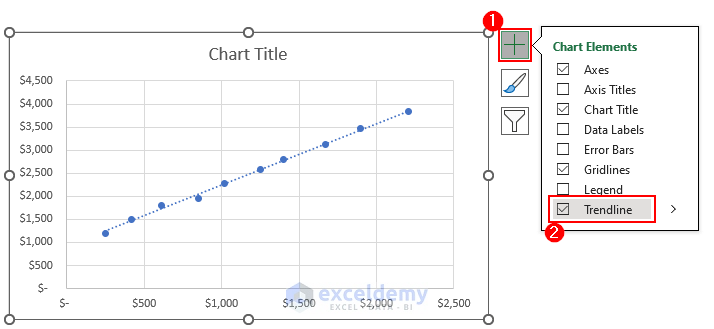
- The chart has been created.
- Click on the Plus(+) symbol on the top right side of the chart area and tick Trendline from Chart Elements section.
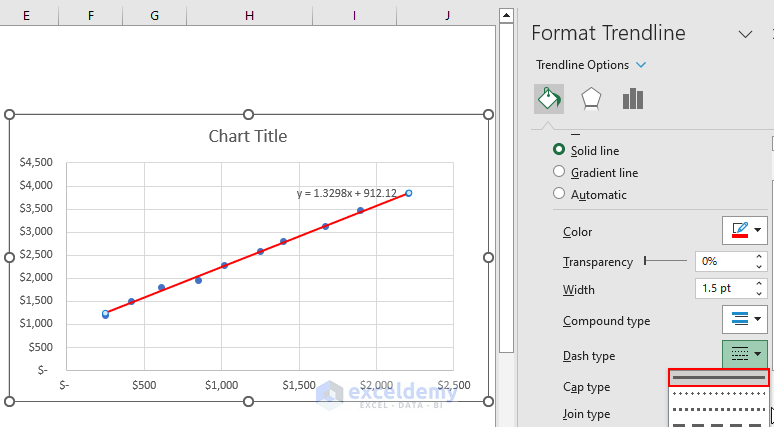
- We selected the Dash type as Solid with a Red color to make the trendline stand out.
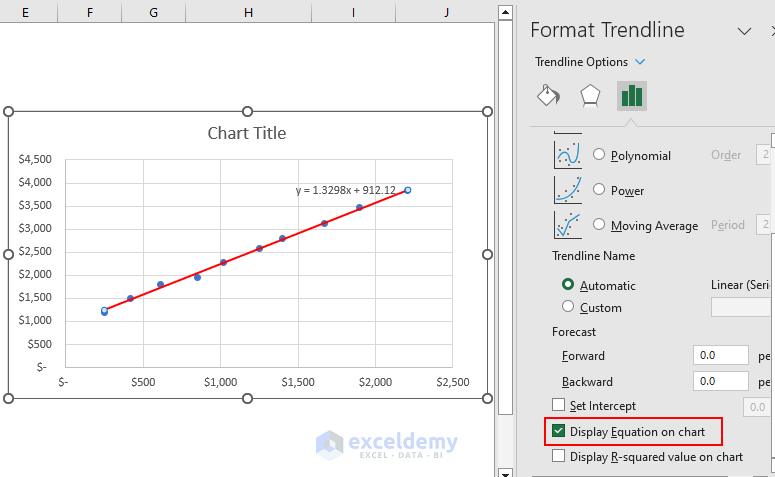
- From the Format Trendline menu, check Display Equation on chart.
What Things You Have to Remember?
- Regression analysis is hampered heavily by outliers. All kinds of outliers must be removed before regression analysis is done.
- Enable Analysis ToolPak before regression analysis.
- LINEST is an array formula. Use it accordingly.
- Identify X and Y values correctly.
Frequently Asked Questions
1. What types of regression analysis can I perform in Excel?
Excel supports various types of regression analysis, including simple linear regression, and multiple linear regression, among others.
2. What does the R-squared value in Excel regression analysis indicate?
The R-squared value, also known as the coefficient of determination. It represents the proportion of variance in the dependent variable that is explained by the independent variables. A higher R-squared value indicates a better fit of the regression model.
3. Are there any limitations to using Excel for regression analysis?
Yes, Excel has limitations in terms of handling very large datasets and complex regression models. Specialized statistical software may be more suitable for advanced analyses.
Regression Analysis in Excel: Knowledge Hub
- Linear Regression
- Simple Linear Regression
- Multiple Regression Analysis
- Interpret Regression Results
- Interpret Linear Regression Results
- Interpret Multiple Regression Results
- Multiple Linear Regression on Excel Data Sets
- Calculate P Value in Linear Regression
- Logistic Regression
- Plot Least Squares Regression Line
<< Go Back to Excel for Statistics | Learn Excel
Get FREE Advanced Excel Exercises with Solutions!

also add how to do prediction after performing regression
Hello Rahul,
Thank you so much for your valuable feedback! You’re absolutely right, knowing how to make predictions after performing regression is essential for applying it effectively.
Once you’ve used Excel’s Data Analysis Toolpak to perform linear regression, you’ll receive an output with coefficients like this:
Intercept (α)
X Variable 1 Coefficient (β)
Let’s say the regression equation from your output is:
Y = α + βX
Step-by-Step to Make Predictions:
1. Identify Coefficients: From the regression output table:
Intercept = 2.5
X Coefficient = 1.8
So, the regression equation is:
Predicted Y = 2.5 + 1.8 * X
Create a Column for New X Values:
1. Suppose in column F (F2:F6), you input new X values (e.g., sales, height, etc.)
2. Use a Formula to Calculate Predicted Y:
3. In column G, enter the prediction formula:
=2.5 + 1.8 * F2
Drag this formula down to apply it for all new X values.
Regards
ExcelDemy