Method 1 – CONFIDENCE Function
It returns the confidence value for the population mean using the normal distribution. The syntax for this function is.
Alpha is the level of significance. The value for alpha must be 0 < alpha < 1, standard_dev refers to the standard deviation for the population. Size refers to sample size.
Method 2 – CONFIDENCE.NORM Function
This function calculates the confidence interval for a population mean using a normal distribution. The syntax of this function is.
Alpha is the level of significance. The value for alpha must be 0 < alpha < 1, standard_dev refers to the standard deviation for the population. Size refers to sample size.
Method 3 – CONFIDENCE.T Function
It returns the confidence interval for a population mean and uses a Student’s t distribution. The syntax for this function is.
Alpha is the level of significance. The value for alpha must be 0 < alpha < 1, standard_dev refers to the standard deviation for the population. Size refers to sample size.
How to Calculate Confidence Interval in Excel
Method 1 – Use Generic Formula to Calculate Confidence Interval in Excel
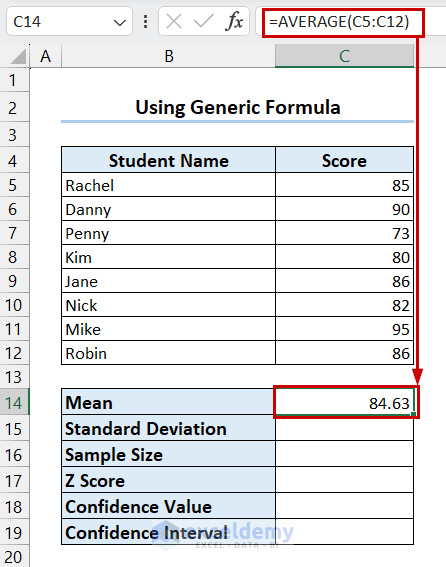
- Select the cell where you want the Mean >> Write the following formula.
=AVERAGE(C5:C12)- Press Enter.
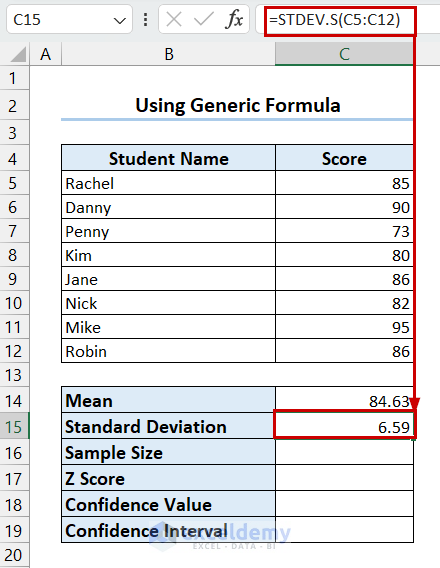
- Select the cell where you want the Standard Deviation (we wanted the result for sample standard deviation) >> Write the following formula.
=STDEV.S(C5:C12)- Press Enter.
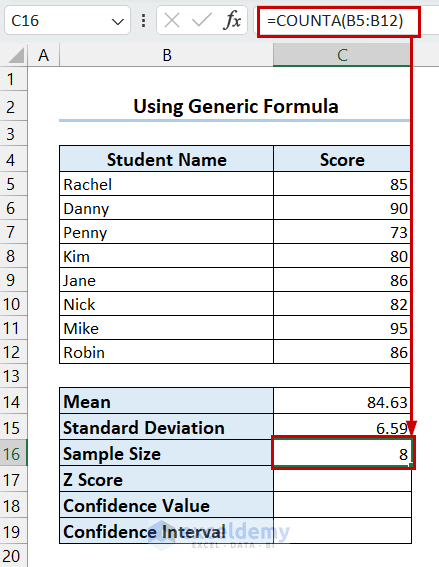
- Select the cell where you want the Sample Size >> Write the following formula.
=COUNTA(B5:B12)- Press Enter.
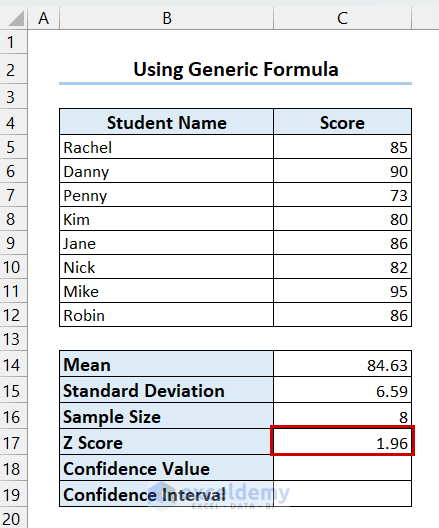
- Select the cell where you want the Z Score >> Write the Z Score for your Confidence Level.
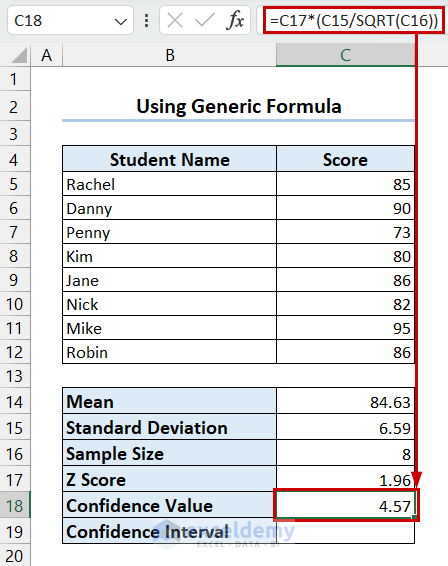
- Select the cell where you want the Confidence Value >> Write the following formula.
=C17*(C15/SQRT(C16))- Press Enter.
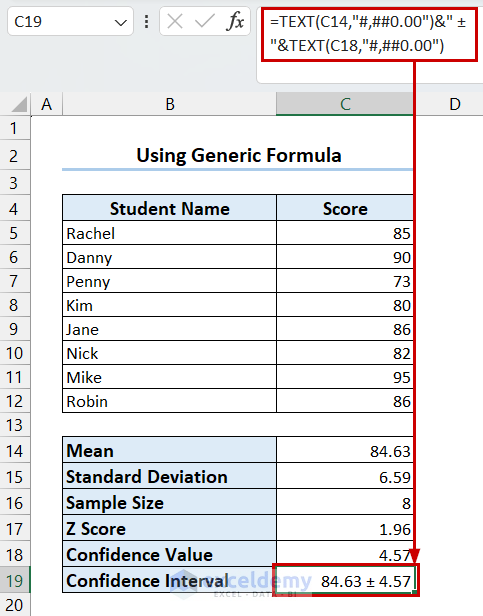
- Select the cell where you want the Confidence Interval >> Write the following formula.
=TEXT(C14,"#,##0.00")&" ± "&TEXT(C18,"#,##0.00")- Press Enter.
How Does the Formula Work?
- TEXT(C14,”#,##0.00″): Here, the TEXT function changes the value format in cell C14 to a thousand separator with 2 decimal points.
- TEXT(C14,”#,##0.00″)&” ± “&TEXT(C18,”#,##0.00”): The Ampersand Operator (&) joins these formulas with the “±” sign.
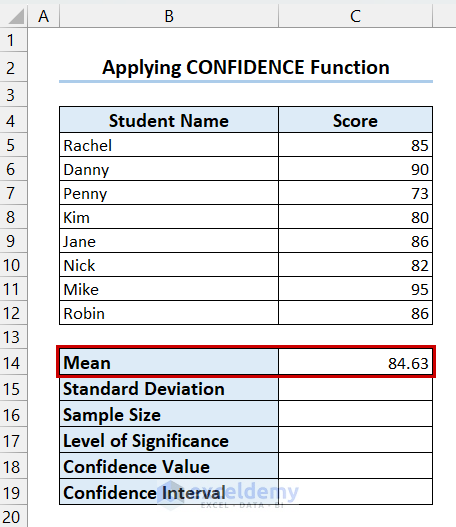
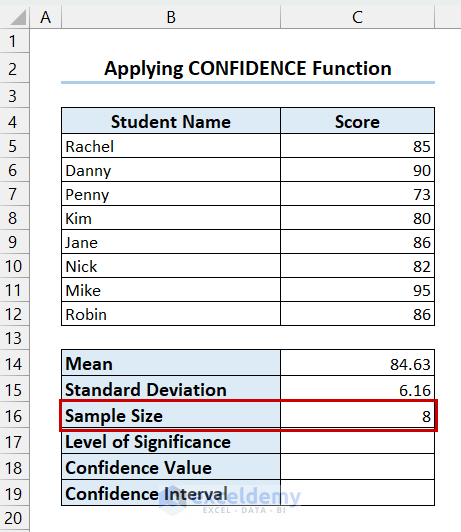
Method 2 – Apply Excel CONFIDENCE Function to Calculate Confidence Interval
- Calculate the Mean like the previous method.
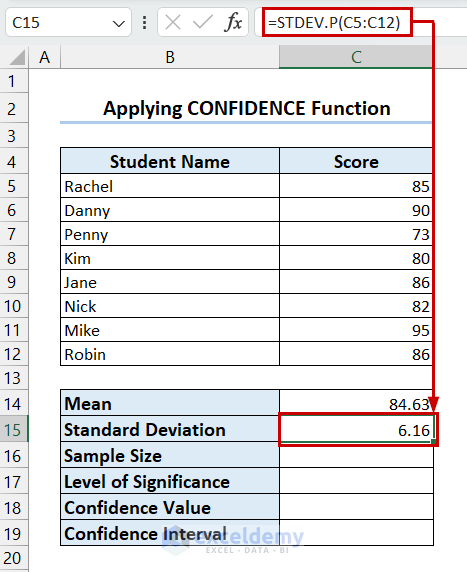
- Select the cell where you want the Standard Deviation (here, I wanted the result for population standard deviation) >> Write the following formula.
=STDEV.P(C5:C12)- Press Enter.
- Calculate the Sample Size like the previous method.
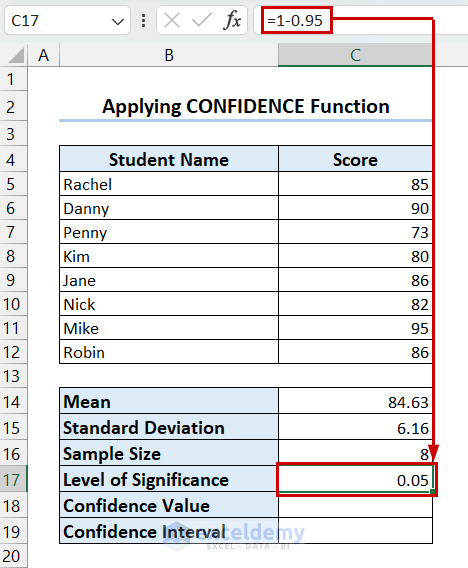
- Select the cell where you want the Level of Significance >> Write the following formula.
=1-0.95- Press Enter.
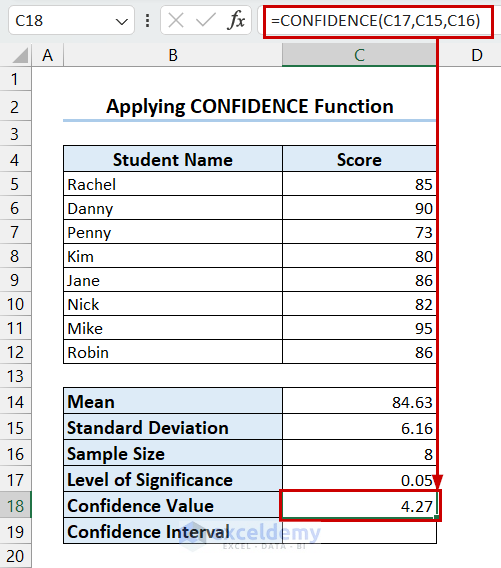
- Select the cell where you want the Confidence Value >> Write the following formula.
=CONFIDENCE(C17,C15,C16)- Press Enter.
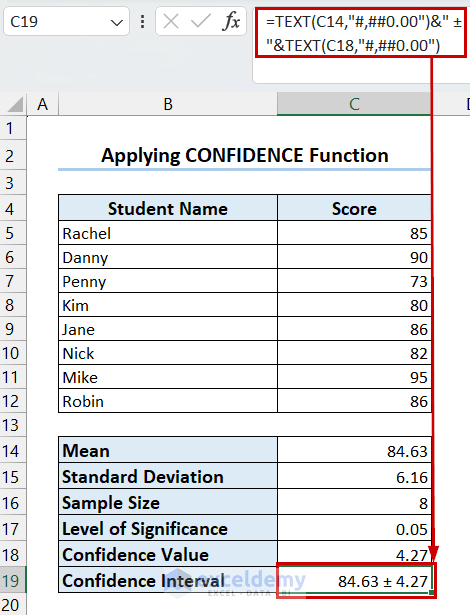
- Select the cell where you want the Confidence Interval >> Write the following formula.
=TEXT(C14,"#,##0.00")&" ± "&TEXT(C18,"#,##0.00")- Press Enter.
Method 3 – Calculate Confidence Interval Using Excel CONFIDENCE.NORM Function
- Find Mean, Standard Deviation, Sample Size, and Level of Significance like the previous method.
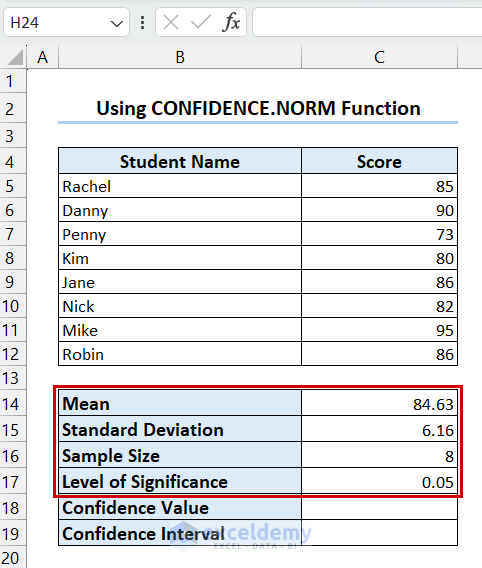
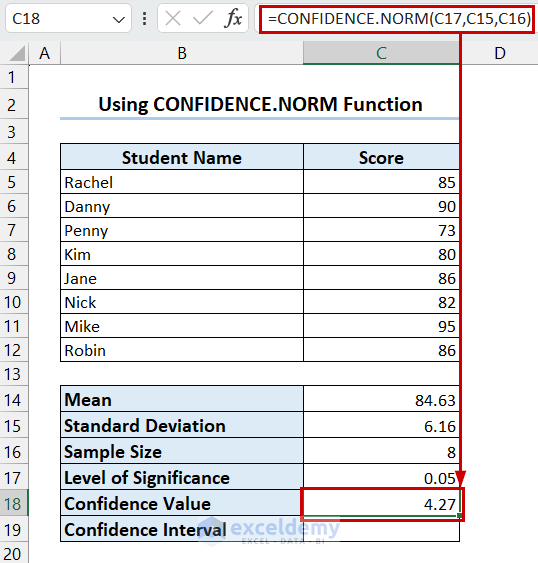
- Select the cell where you want the Confidence Value >> Write the following formula.
=CONFIDENCE.NORM(C17,C15,C16)- Press Enter.
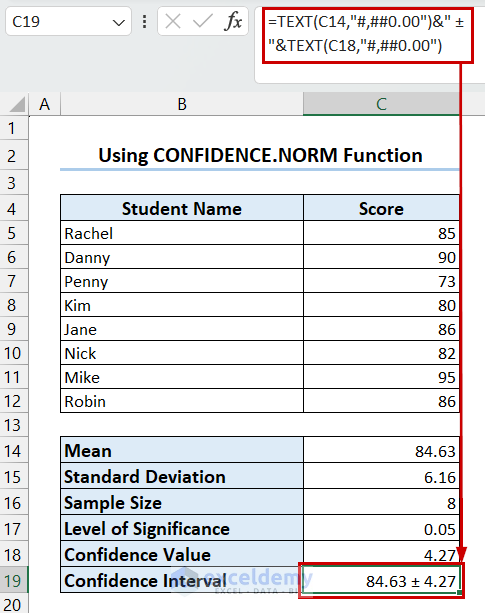
- Select the cell where you want the Confidence Interval >> Write the following formula.
=TEXT(C14,"#,##0.00")&" ± "&TEXT(C18,"#,##0.00")- Press Enter.
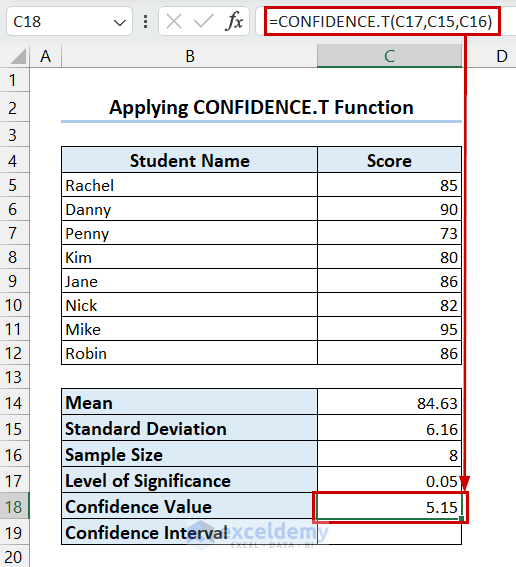
Method 4 – Use CONFIDENCE.T Function to Calculate Confidence Interval
- Find Mean, Standard Deviation, Sample Size, and Level of Significance like the previous method.
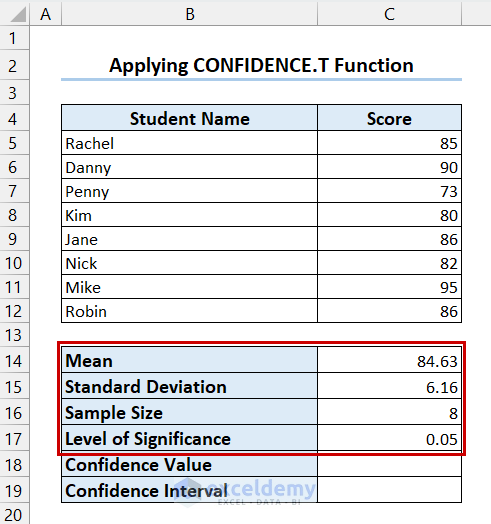
- Select the cell where you want the Confidence Value >> Write the following formula.
=CONFIDENCE.T(C17,C15,C16)- Press Enter.
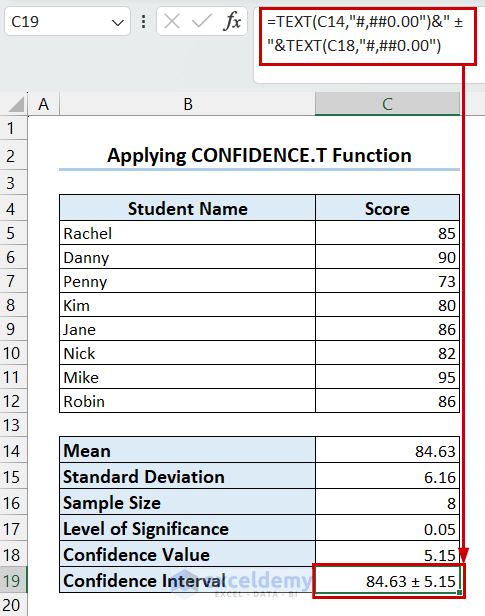
- Select the cell where you want the Confidence Interval >> Write the following formula.
=TEXT(C14,"#,##0.00")&" ± "&TEXT(C18,"#,##0.00")- Press Enter.
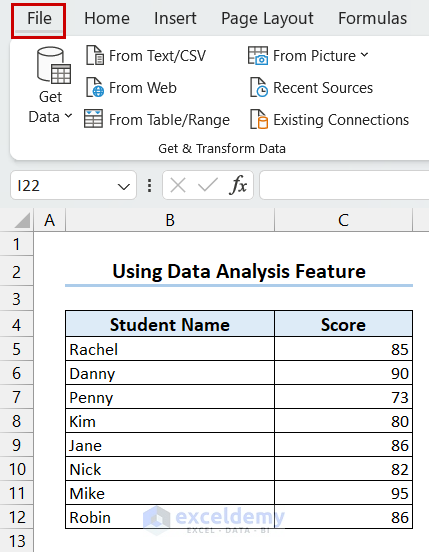
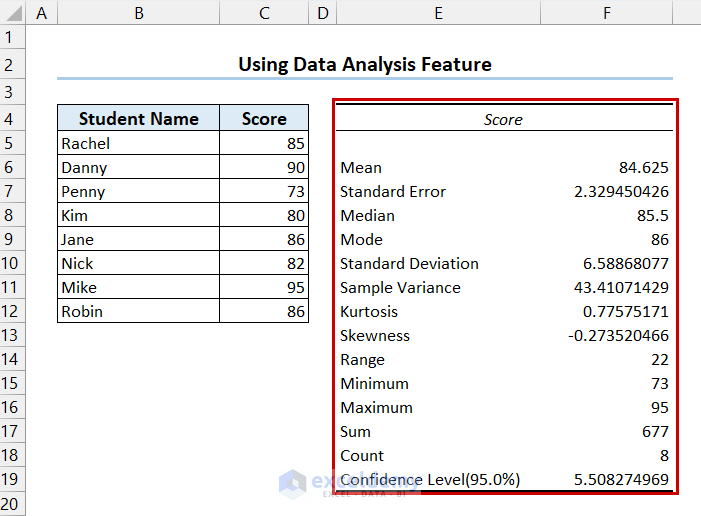
Method 5 – Apply Data Analysis Feature to Calculate Confidence Interval
- Go to the File tab.
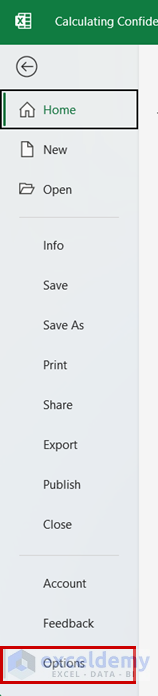
- Select Options.
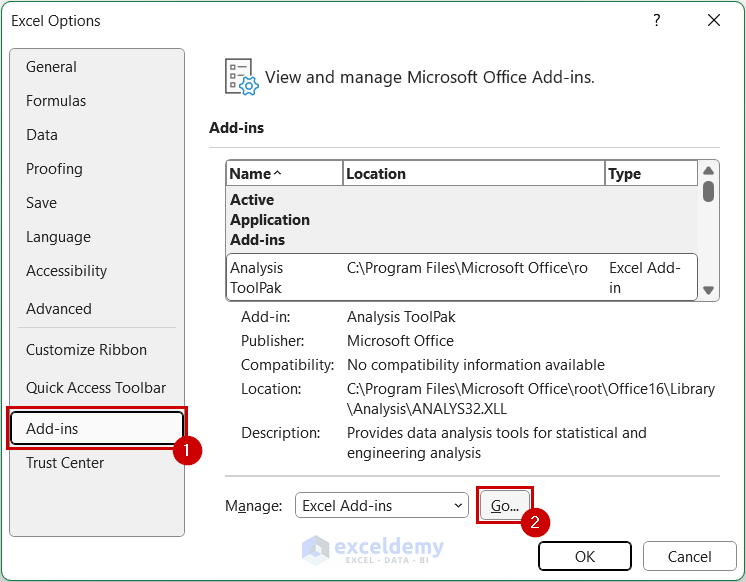
- Select Add-ins tab >> Go from Manage.
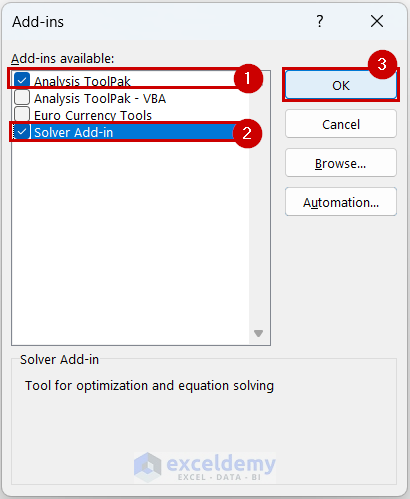
- Add-ins dialog box appears >> check Analysis ToolPak >> check Solver Add-in >> select OK.
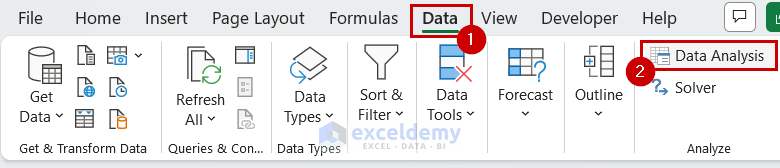
- Go to the Data tab >> select Data Analysis.
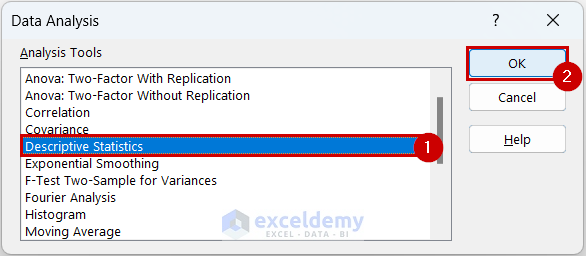
- Data Analysis dialog box appears >> Select Descriptive Statistics >> select OK.
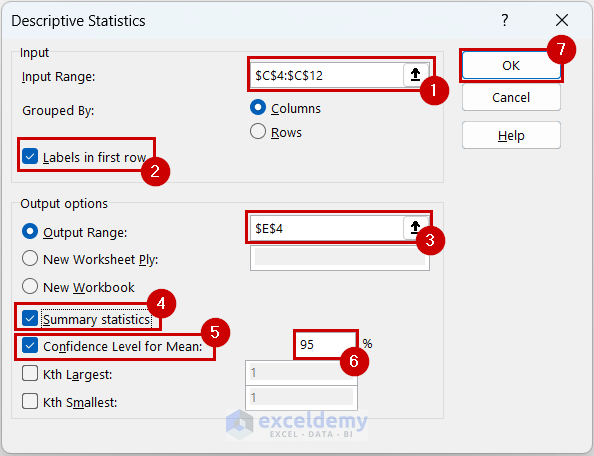
- A Descriptive Statistics dialog box will appear.
- Select Input Range >> check Labels in the first row if your range contains Labels >> select Output Range >> check Summary statistics >> check Confidence Level for Mean and write the Confidence Level >> select OK.
- You will see a summary with the Confidence Value.
Things to Remember
- You have to remember that CONFIDENCE functions only take numeric values.
- You must use the correct function for calculating Standard Deviation.
Frequently Asked Questions
1. How do you find the 95 percent confidence interval?
To find the 95 percent confidence interval you will have to set alpha as (1-0.95) in the CONFIDENT function.
2. How to calculate Sample Size?
You can use the COUNTA function to calculate the Sample Size.
3. How to find the upper and lower limits of a confidence interval?
For the upper limit, you will have to add the Confidence Value with the Mean. And for the lower limit, you will have to subtract the Confidence Value from the Mean.
Download Practice Workbook
You can download the practice workbook from here.
Confidence Interval in Excel: Knowledge Hub
- Calculate Confidence Interval
- Make Confidence Interval Graph
- Find Upper and Lower Limits of Confidence Interval
- Find Confidence Interval for Two Samples
- Confidence Interval for Difference in Means
- Calculate Confidence Interval for Population Mean
- Find Confidence Interval Proportion
- Calculate 95 Percent Confidence Interval
- Determine 99 Percent Confidence Interval
- Linear Regression Confidence Interval
- Calculate Z-Score with 95 Confidence Interval
- Find P-Value from Confidence Interval
<< Go Back to Excel for Statistics | Learn Excel
Get FREE Advanced Excel Exercises with Solutions!
