In this article, we have used PROB, fractional method, NORM.DIST and NORMDIST function to find out Excel probability. Here’s an overview of the function.

Download the Practice Workbook
Excel PROB Function
The PROB function calculates the probability based on a range comparing limits.
Syntax:
5 Examples of Excel Probability
Example 1 – Calculate Probability Using the PROB function
We have a dataset of car sales with their probability value. We will calculate the total probability based on lower and upper limits set in cells C12 and C13, respectively.
- Use the formula below in cell C14.
=PROB(C5:C10,D5:D10,$C$12,$C$13)
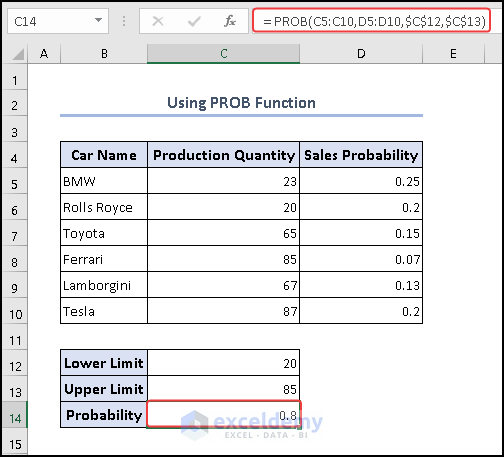
The formula calculates the probability of a random variable falling within a specified range, given a set of data. The range of values for the random variable is provided in cells C5 to C10, while the corresponding probabilities for those values are in cells D5 to D10. The 3rd and 4th arguments $C$12 and $C$13 are used to specify the lower and upper limits of the desired range.
Example 2 – Calculating Probability Without the Upper Limit
- We will use the formula below in cell C13 to get the sales probability.
=PROB(C5:C10,D5:D10,$C$12)
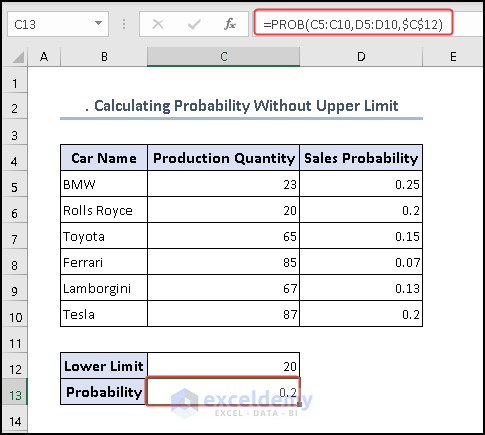
In this context, the values representing the random variable are located in cells C5 to C10, and the corresponding probabilities for those values are found in cells D5 to D10. The 3rd argument $C$12 serves as the lower limit for the desired range. By utilizing these inputs, the formula computes the cumulative probability of the random variable falling within the specified range, taking into account the provided data and probability values, while considering the designated lower limit.
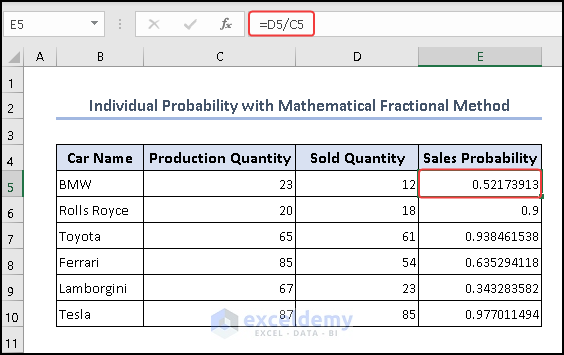
Example 3 – Getting the Individual Probability with a Mathematical Fractional Method
- We have divided Sold Quantity by Production Quantity to find individual probability using the formula below.
=D5/C5
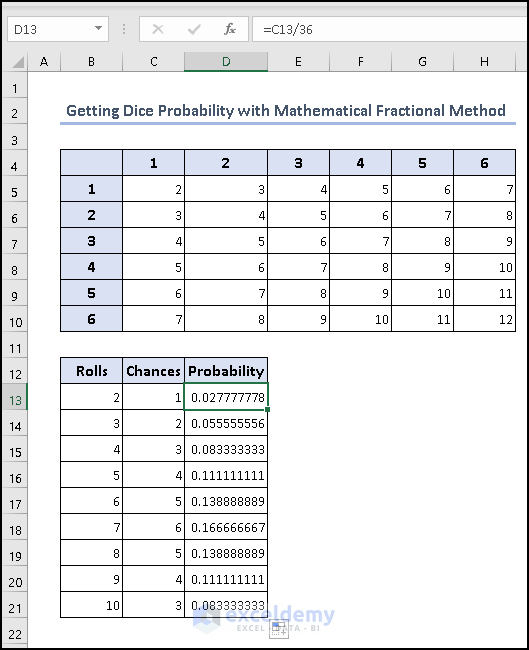
Example 4 – Getting the Dice Probability with a Mathematical Fractional Method
We have a dataset that contains all the possible sums of two dice throws in C5:H10.
- Create a list of possible sums (2 to 12) in column B13:B23.
- Use the formula below to find the chances of the number of rolls.
=COUNTIF($C$5:$H$10,B13)
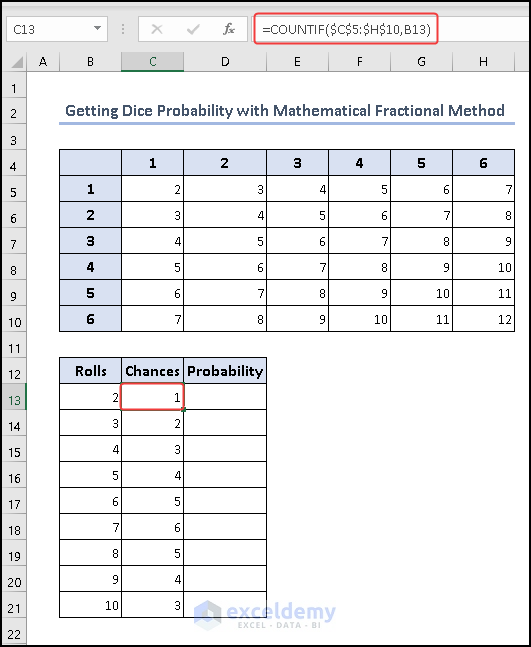
The formula counts how many times the value in cell B13 appears within the range C5:H10. The value of cell B13 is the sum value of two dice.
- Find the probability by the formula below to get the individual chances.
=C13/36
- Drag the Fill Handle.
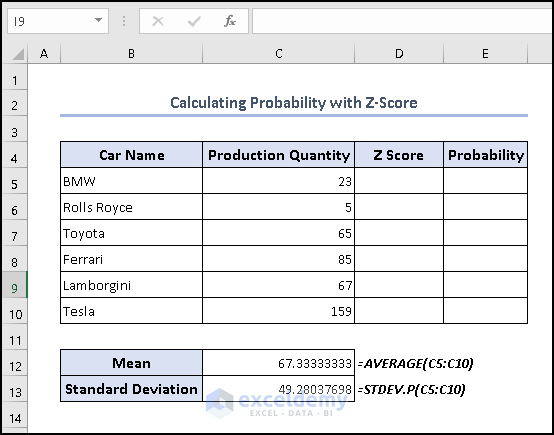
Example 5 – Calculating the Probability in Excel with Mean and Standard Deviation
Case 5.1 – Using Z Score
- Find the Mean and Standard Deviation on cells C12 and C13 using the following formulas, respectively.
For Mean:
=AVERAGE(C5:C10)
For Standard Deviation:
=STDEV.P(C5:C10)
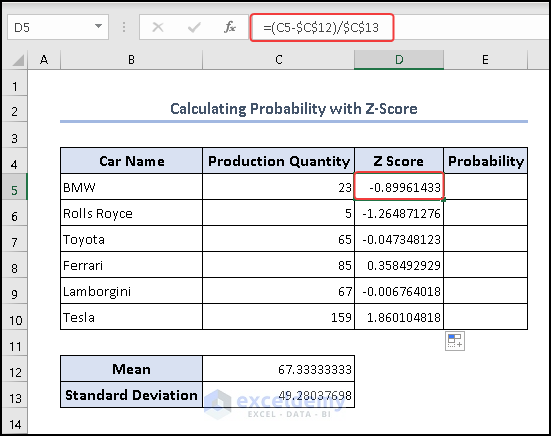
- Find the Z-score using the formula below in cell C5 and drag the fill handle from C5 to C10.
=(C5-$C$12)/$C$13
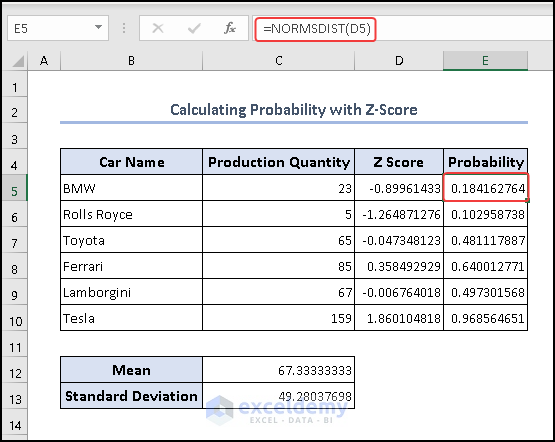
- Find the probability using the NORMDIST function in cell E5.
=NORMSDIST(D5)
- Drag the Fill Handle.
Case 5.2 – Using NORM.DIST
We already calculated the Mean and Standard Deviation in the previous section. We will use them to calculate probability with NORM.DIST function.
- Find the Normal Distribution of Production Quantity by the DIST function in cell D5.
=NORM.DIST(C5,$C$12,$C$13,FALSE)
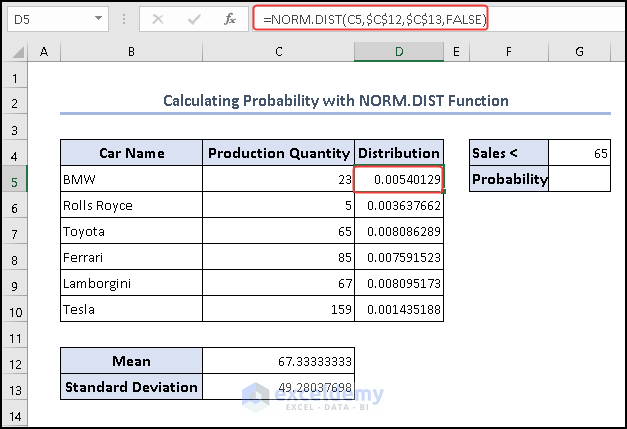
The formula calculates the cumulative normal distribution value for a specific input value of cell C5, given the mean ($C$12), standard deviation ($C$13), and uses a cumulative distribution. This function is commonly used in statistics to determine the probability that a random variable from a normal distribution falls below a certain value.
- Use the NORM.DIST function to get the probability.
=NORM.DIST(G4,C12,C13,TRUE)
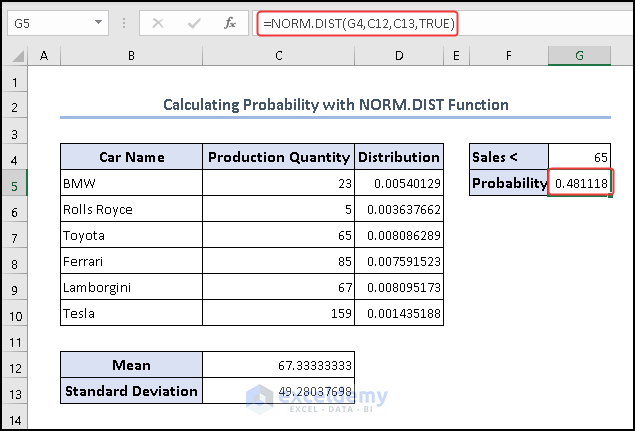
The formula calculates the cumulative probability that a sales value (represented by G4) is less than 65, assuming a normal distribution with a given mean (C12) and standard deviation (C13). The TRUE parameter indicates that the function computes the cumulative distribution, providing the probability that a randomly selected value from the specified normal distribution is less than the value in G4 (65 in this case), based on the provided mean and standard deviation. This can be interpreted as the probability that sales fall below 65 in a distribution with the given characteristics.
Common Errors When Using PROB Function
- Misaligned Data: Ensure that the data ranges for values and probabilities are properly aligned. A mistake in aligning these ranges can lead to incorrect calculations.
- Incorrect Probability Format: Probability values should be valid and within the range of 0 to 1. Mistakenly using percentages or decimal values outside this range can result in erroneous results.
- Inconsistent Ranges: Ensure that the data ranges for values and probabilities have the same number of elements. Mismatched ranges will lead to incorrect probabilities.
- Order of Arguments: Make sure you’re using the correct order of arguments in the function. For example, ensure the lower and upper limits you’re providing in the right sequence.
- Misinterpretation of Limits: Be clear about whether you’re using inclusive or exclusive limits for the lower and upper bounds. Mistakes in understanding this can lead to wrong probability calculations.
- Incorrect Parameters: Ensure that you’re using the correct parameters for the specific distribution or function you’re working with. Different distributions may have variations in input parameters.
- Incorrect Distribution Assumption: Using the wrong probability distribution assumption can lead to inaccurate results. Ensure that the distribution you’re using accurately reflects the nature of your data.
- Using the Wrong Function: Make sure that the function you’re using is appropriate for the problem you’re trying to solve. Different functions have different purposes, such as calculating cumulative probabilities or probability density functions.
- Not Considering Assumptions: Understand the assumptions of the probability model you’re using. Ignoring or misunderstanding these assumptions can lead to misleading results.
- Rounding Errors: Be cautious with rounding numbers during calculations, as cumulative probabilities can be sensitive to even small rounding errors.
Why Isn’t My PROB Function Working?
- Sum of Probabilities: Make sure the total sum of probabilities in the range_prob is exactly 1. If it’s not, adjust the probabilities to ensure they add up to 1.
- Matching Cell Counts: Ensure that the number of cells in range_x (values) and range_prob (probabilities) are the same. They should align properly for the function to work correctly.
- Numeric Values: Confirm that all values within range_x and range_prob are numbers. The function requires numeric inputs to calculate probabilities accurately.
- Syntax Check: Double-check the formula for any syntax errors. Ensure you’ve provided all the required arguments correctly, following the formula’s structure.
Probability and Inverse Probability
Probability: Probability is a fundamental concept in statistics that measures the likelihood of an event occurring. It is expressed as a value between 0 to 1, where 0 represents an impossible event, 1 represents a certain event, and values in between represent varying degrees of likelihood. Probability can be used to model uncertain outcomes in various scenarios, such as games of chance, weather forecasting, and financial risk assessment.
Example of Probability: Consider rolling a fair six-sided die. The probability of rolling a 4 is 1/6, as there is one favorable outcome (rolling a 4) out of six possible outcomes (rolling numbers 1 through 6).
Inverse Probability: Inverse probability, also known as the quantile function or percent-point function, is the opposite of the probability concept. It helps you determine the value for which a certain probability is reached or exceeded in a probability distribution. In other words, given a probability, the inverse probability function helps you find the value that corresponds to that probability.
Example of Inverse Probability: Let’s say you have a standard normal distribution (mean = 0, standard deviation = 1). Using the inverse probability function, you can find the value at which the cumulative probability is, for instance, 0.95. This helps you identify the threshold beyond which only 5% of the data lies.
Things to Remember
- Stay updated with new features and changes in Excel. Newer versions may introduce improvements or enhancements to probability functions.
- Be prepared to troubleshoot and resolve errors that may arise during probability calculations. Understanding common error messages will help you identify and fix issues.
Frequently Asked Question
Can Excel probability analysis be used in finance and statistics?
Excel probability analysis has wide-ranging applications in finance, statistics, and many other fields. It can assist in financial modeling, risk assessment, investment analysis, and statistical research by quantifying uncertainty and aiding in decision-making processes.
Are there any limitations to using Excel for probability analysis?
While Excel is a powerful tool, it may have limitations when dealing with extremely complex or specialized probability calculations. In such cases, dedicated statistical software might be more suitable. Additionally, ensuring accurate data input and understanding the assumptions of the probability models is crucial.
What is the difference between NORM.DIST and NORMINV functions?
NORM.DIST calculates the cumulative probability of a value, while NORMINV calculates the inverse probability – it finds the value that corresponds to a given cumulative probability.
Excel Probability: Knowledge Hub
- How to Get Simulation Probability in Excel
- How to Create Option Probability Calculator in Excel
- How to Apply Weighted Probability in Excel
- How to Calculate Empirical Probability with Excel Formula
- Probability Formula for Lottery in Excel
- How to Calculate Probability Density Function in Excel
- How to Find Marginal Probability in Excel
- How to Calculate Joint Probability in Excel
- How to Create Joint Probability Table in Excel
- How to Calculate Probability of Exceedance in Excel
- How to Calculate Cumulative Probability in Excel
- How to Calculate Conditional Probability in Excel
- How to Calculate Probability in Excel
<< Go Back to Excel for Statistics | Learn Excel
Get FREE Advanced Excel Exercises with Solutions!
