While working in Microsoft Excel, you may want to calculate the marginal probability distribution of a dataset. Manually performing these calculations can take ages! In this regard, Excel becomes a very handy tool to perform such calculations briskly and accurately. Granted this, in this article we’ll learn about 2 ways how to find marginal probability in Excel.
What Is Marginal Probability Distribution?
First and foremost, let’s dwell a little upon what a marginal probability distribution is.
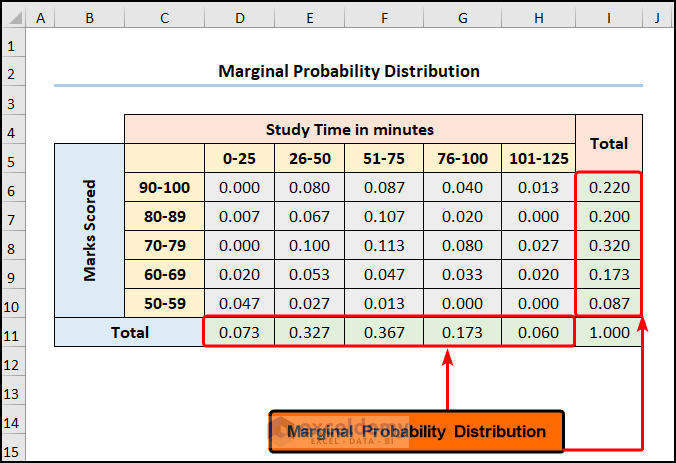
In a nutshell, the marginal probability is the likelihood that a single event may occur, independent of the occurrence of any other probability. The screenshot below shows the marginal probability distribution of today’s dataset.
Formula to Calculate Marginal Probability Distribution
In truth, the formula to calculate the marginal probability can be uninspiring to look at, nonetheless, like many statistical expressions, the idea behind it is rather simple.
Assuming that i and j are discrete random variables and P(i, j) is the joint probability distribution, the marginal probability distributions of i and j are as follows:

How to Find Marginal Probability in Excel: 2 Ways
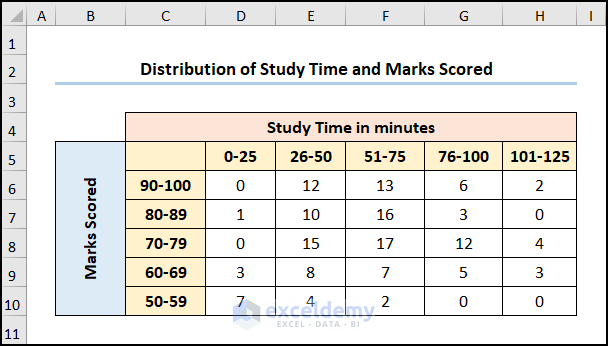
On this occasion, let’s assume the Distribution of Study Time and Marks Scored dataset shown in the B4:H10 cells, which shows the Study Time in minutes and the corresponding Marks Scored. Here, we want to find the marginal probabilities for both Study Time and Marks Scored variables independent of each other; hence, without further delay, let us observe and learn each method individually.
Here, we have used the Microsoft Excel 365 version. You may use any other version according to your convenience.
Method-1: Using SUM Function
To begin with, we’ll utilize the popular SUM function to compute the Total along the rows (for Marks Scored) and the columns (for Study Time). Then, we’ll compute the marginal probabilities for the data points. Hence, just follow the steps shown below.
📌 Steps:
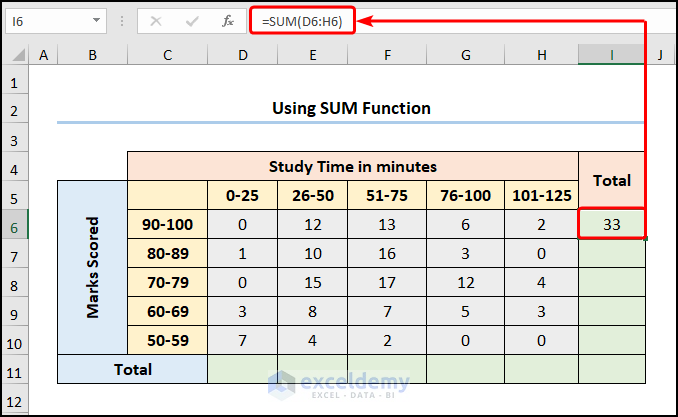
- First, go to the I6 cell >> enter the formula given below.
=SUM(D6:H6)
Here, the D6:H6 range of cells refers to the Marks Scored bucket of 90-100.
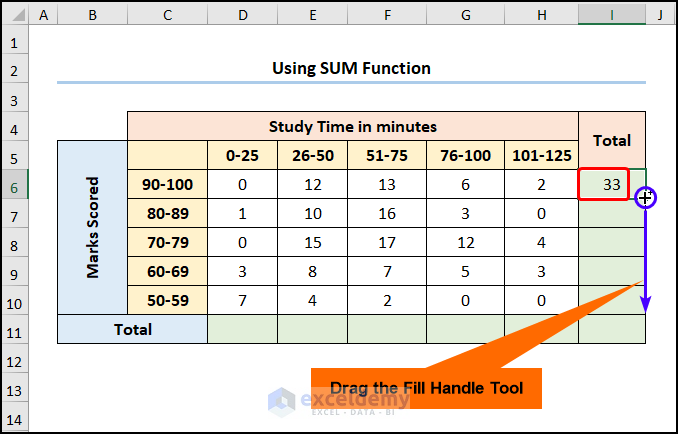
- Then, use the Fill Handle tool to copy the formula into the cells below.
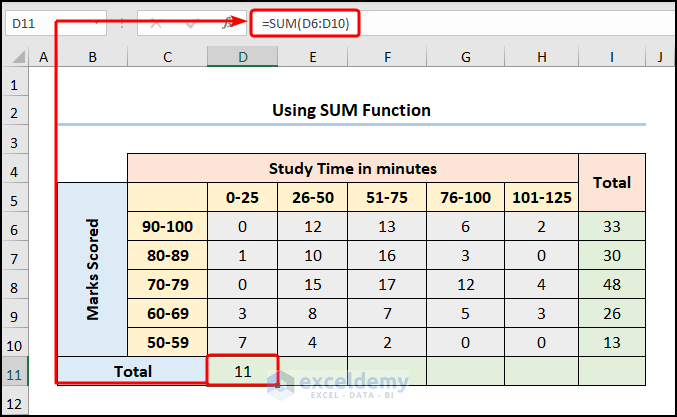
- Second, move to the D11 cell >> insert the following expression into the formula bar >> likewise, apply the Fill Handle tool to populate the cells.
=SUM(D6:D10)
In this expression, the D6:D10 array represents the Study Time bucket of 0-25 minutes.
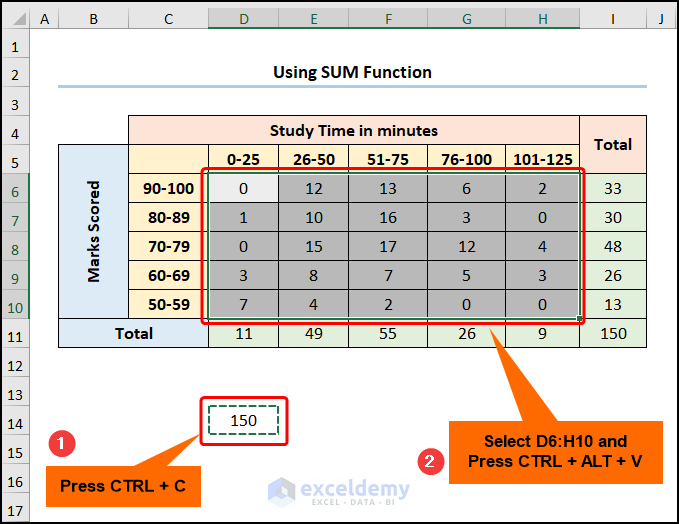
- Third, type in the Total, here it is 150, in any cell according to your preference.
- Next, press the CTRL + C to copy this value >> select the D6:H10 cells and hit the CTRL + ALT + V keys.
Immediately, the Paste Special wizard pops out.
- Not long after, choose the Divide option >> click the OK button.
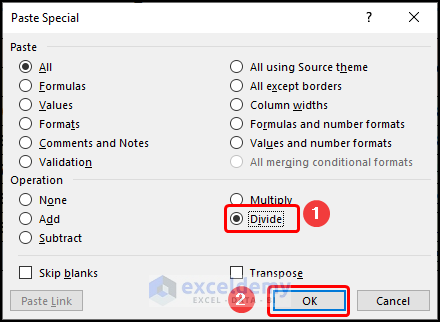
Here, all the values in the D6:H10 cells are divided by the Total, which is 150.
Eventually, the marginal probabilities appear (highlighted in light green), as shown in the screenshot below.

Read More: Calculating Probability in Excel with Mean and Standard Deviation
Method-2: Utilizing PivotTable
Conversely, you can also apply Excel’s powerful and handy PivotTable feature to calculate the marginal distribution from raw data. Now, allow us to demonstrate the process in the steps below.
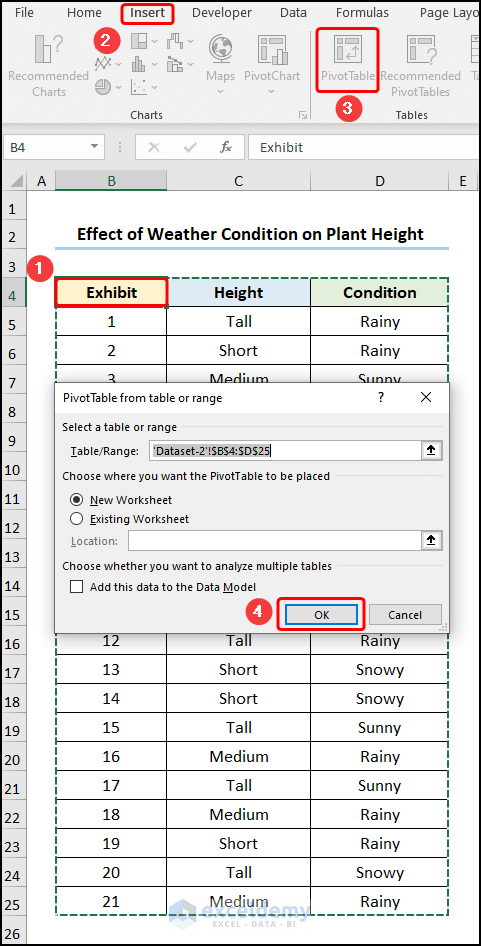
For instance, considering the Effect of Weather Conditions on the Plant Height dataset shown in the B4:D25 cells. Here, the dataset depicts the Exhibit number, the plant Height, and the weather Condition respectively.

📌 Steps:
- Initially, move to the B4 cell >> navigate to the Insert tab >> click the PivotTable option >> hit the OK button.
- Now, drag the Height and Condition fields into the Rows and Columns areas successively.
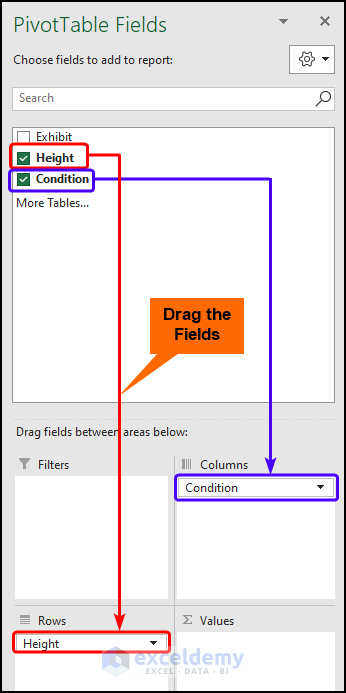
- Afterward, drag the Height field into the Values area.

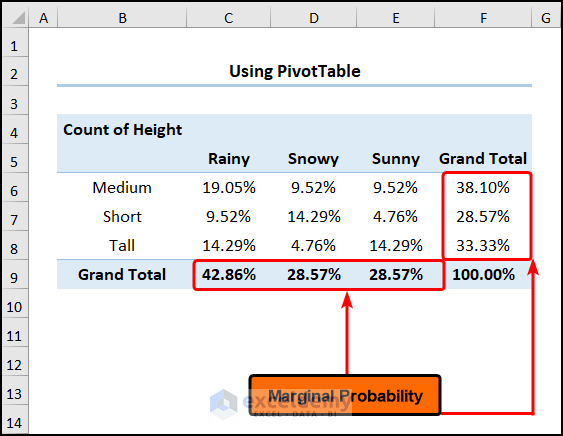
- Next, jump to the C6 cell and right-click on the mouse >> proceed to Show Values As option >> choose the % of Grand Total option.

Voila! The marginal probabilities for the dataset can be seen in the image given below.
Read More: How to Calculate Probability in Excel
Interpretation of Results
- For one thing, the marginal probability of the Study Time between 0-25 minutes refers to the fact that 0.073 or 7.3% of the students studied 0 to 25 minutes for the test.
- In a similar style, the marginal probability of the Marks Scored for the 90-100 bucket, indicates that 0.220 or 22% of students scored between 90 and 100 in the exam.
Practice Section
We have provided a practice section on the right side of each sheet so you can practice yourself. Please make sure to do it by yourself.

Download Practice Workbook
Conclusion
In essence, this article shows 2 effective methods on how to find marginal probability in Excel. So, read the full article carefully and download the free workbook to practice. Now, we hope you find this article helpful, and if you have any further queries or recommendations, please feel free to comment here.
Related Articles
- How to Calculate Conditional Probability in Excel
- How to Create Joint Probability Table in Excel
- How to Calculate Joint Probability in Excel
- How to Calculate Binomial Probability in Excel
- How to Calculate Cumulative Probability in Excel
- How to Calculate Probability of Exceedance in Excel
<< Go Back to Excel Probability | Excel for Statistics | Learn Excel
Get FREE Advanced Excel Exercises with Solutions!
