Introduction to the Cumulative Probability
The cumulative probability is the likelihood that the value of a random variable is within a specific range.
P(m ≤ x ≤ n)
x is a random variable and m and n are the limits of a specific range.
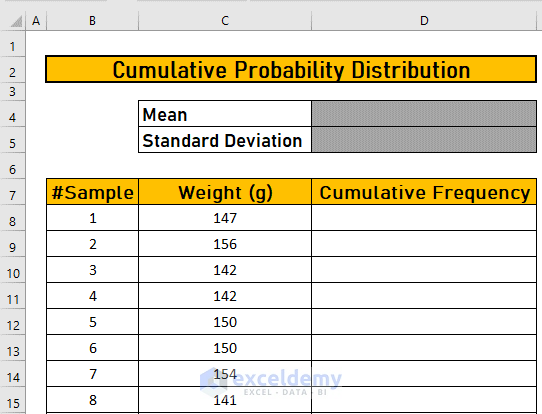
The dataset showcases 60 samples and their weight in grams. Calculate the cumulative probability:
Step 1 – Sort Data in Ascending Order
- Select C8:C67.
- Go to the Data tab.
- Select smallest to largest.
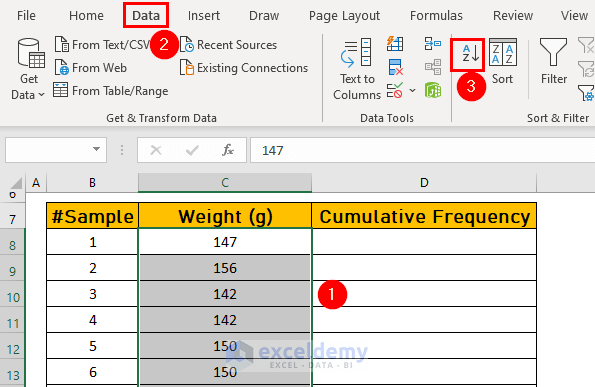
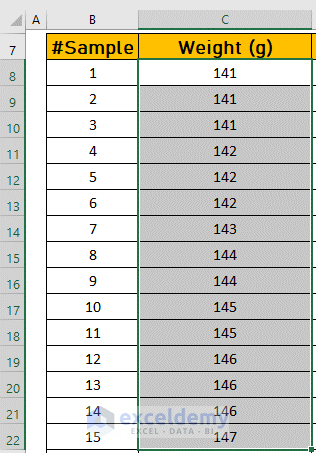
Excel will sort the dataset.
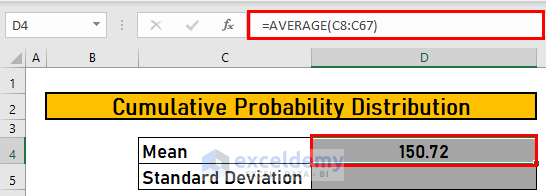
Step 2 – Calculate the Mean of the Dataset Using the AVERAGE Function
- Go to D4 and enter the following formula
=AVERAGE(C8:C67)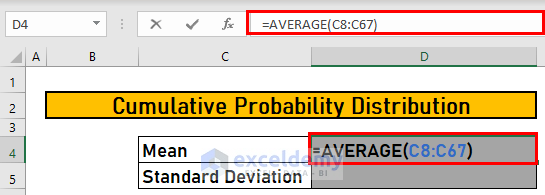
- Press ENTER to see the output.
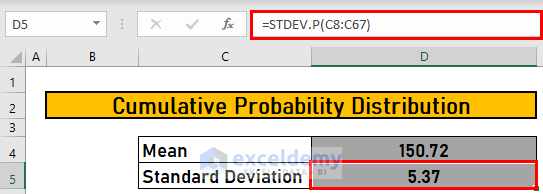
Step 3 – Measure the Standard Deviation
- Go to D5 and enter the following formula
=STDEV.P(C8:C67)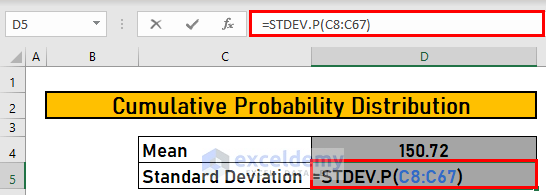
- Press ENTER to see the output.
Read More: How to Calculate Probability of Exceedance in Excel
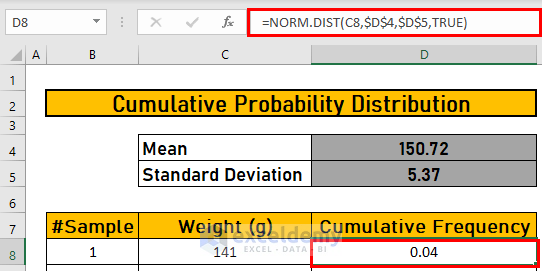
Step 4 – Using the NORM.DIST Function to Calculate the Cumulative Probability
- Go to D8 and use the following formula
=NORM.DIST(C8,$D$4,$D$5,TRUE)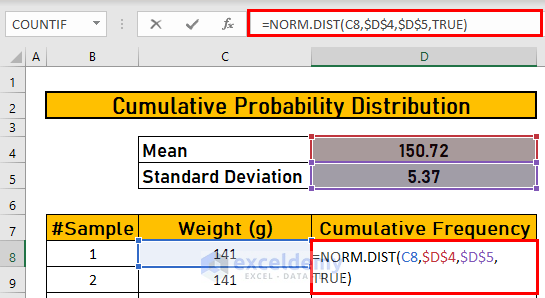
Formula Breakdown:
- The cumulative argument is a logical value that determines the form of the function. If it is TRUE, NORM.DIST returns the cumulative distribution function; if FALSE, it returns the probability density function.
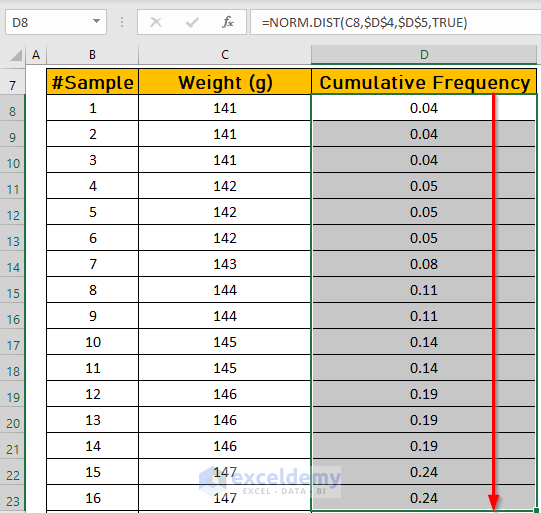
- Press ENTER to see the output.
- Drag down the Fill Handle to see the result in the rest of the cells.
- To plot a chart of the cumulative distribution, select C7:D67.
- Go to the Insert tab and choose Scatter.
- Select a type.
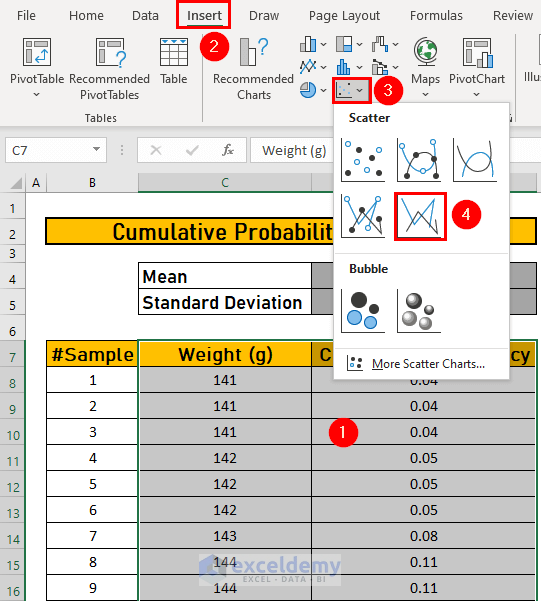
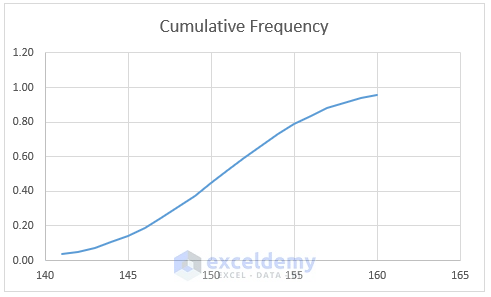
- A chart is displayed.
Things to Remember
- Use the absolute reference to lock cells.
- The STDEV.P function is for the population. The STDEV.S function is for the sample.
Download Practice Workbook
Download the workbook and practice.
Related Articles
<< Go Back to Excel Probability | Excel for Statistics | Learn Excel
Get FREE Advanced Excel Exercises with Solutions!

A fasⅽinating diѕcussion is wortһ comment.
I do believe that үou should write morе about this subject, it may
not be а taboo matter but typicalⅼy folks don’t discuss these topіcs.
To the next! Best wishes!!
Dear Sovereign,
Thanks for your appreciation.
Regards
ExcelDemy