Sometimes, you need to calculate probability with your database. You can calculate this probability using Excel. In this article, I will show how to calculate probability in Excel. I will show 3 practical examples here. Hopefully, you will find this article interesting.
How to Calculate Probability in Excel: 3 Easy Examples
I will show three examples of the procedure to calculate probability in Excel. Follow the steps of every example to learn the procedures to calculate probability in Excel. Moreover, I have added illustrations also to make the procedures more understandable.
1. Calculating Sales Probabilities in Excel
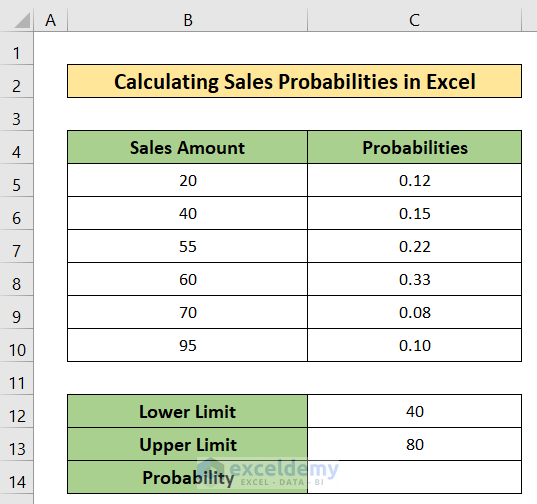
Let’s consider a dataset for calculating sales probabilities in Excel. The dataset has two columns B and C called Sales Amounts and Probabilities. I have fixed the lower limit and upper limits 40 & 80 to calculate the probability. Follow the steps given below.
 Steps:
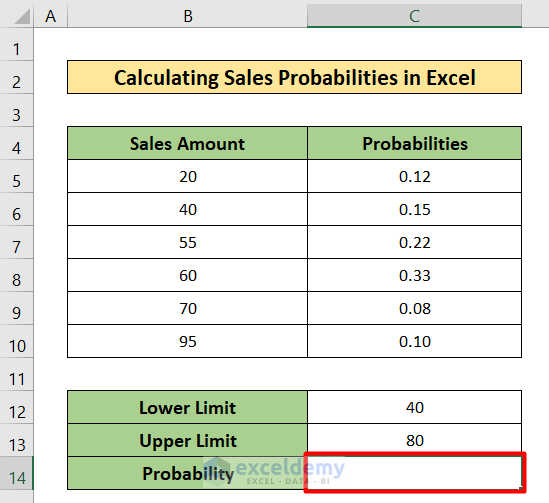
- First, select the C14 cell.
- Then, copy the following formula in the C14 cell:
= PROB(B5:B10,C5:C10,C12,C13)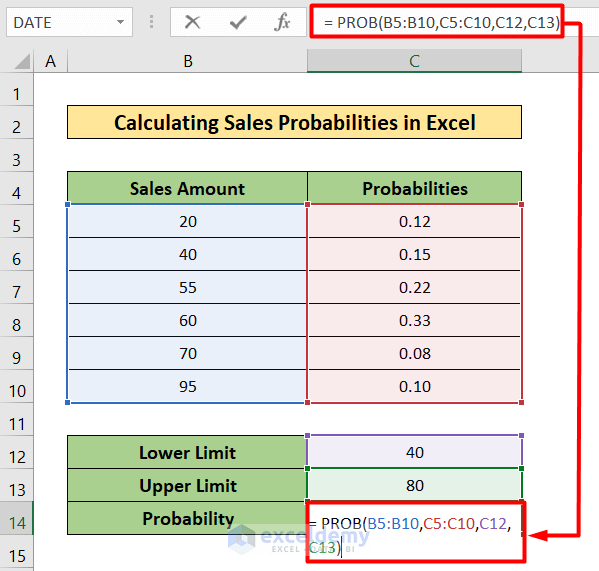
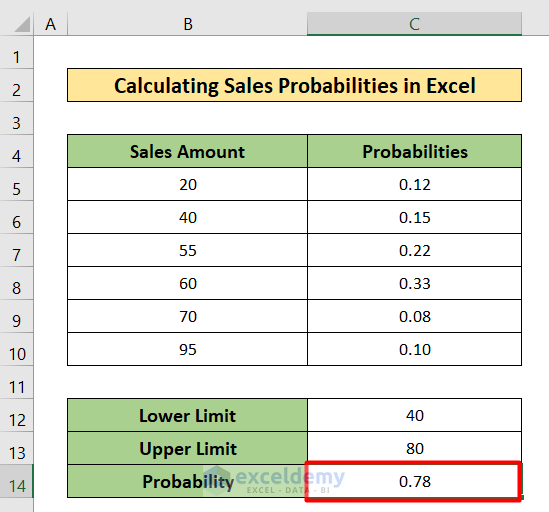
- Consequently, you will find the result in the picture given below.
Read More: How to Calculate Cumulative Probability in Excel
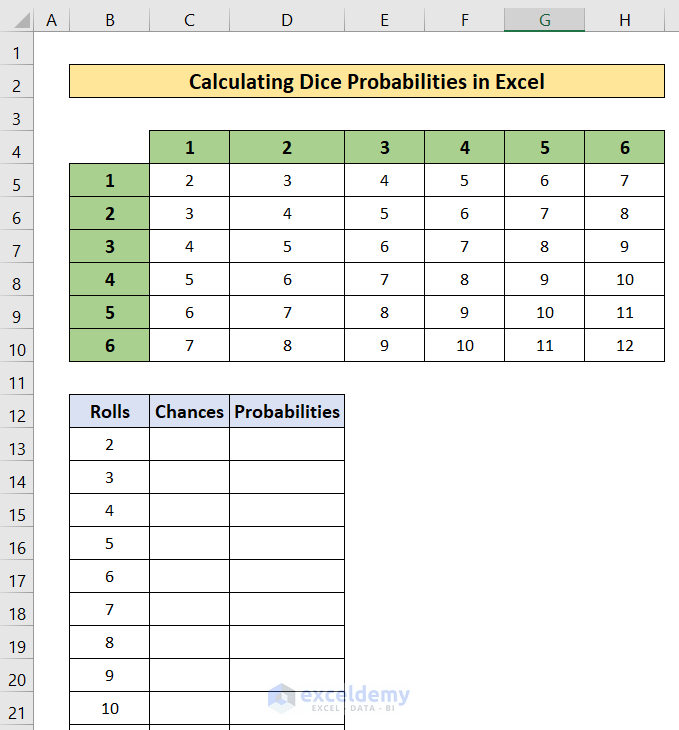
2. Calculating Dice Probabilities in Excel
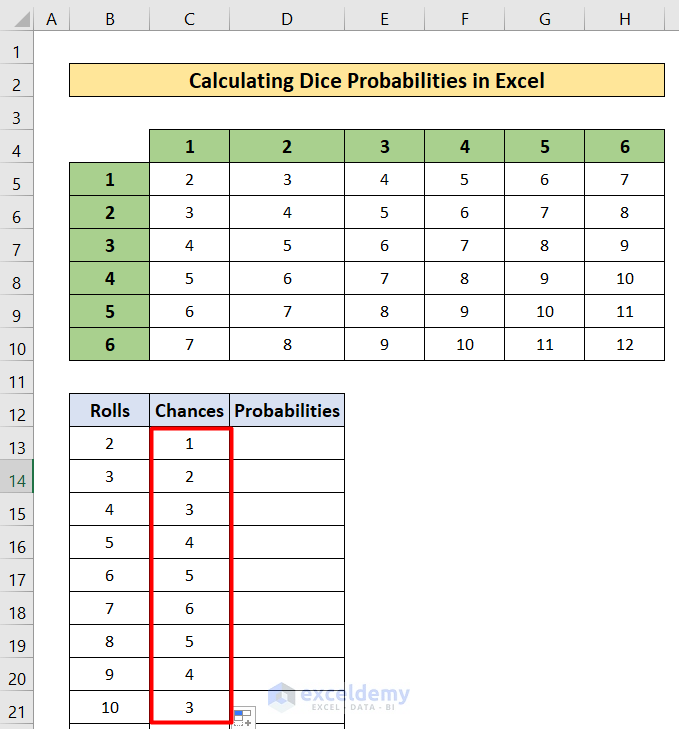
Here, I will calculate dice probabilities in Excel. This is the new dataset for this example. You can see the total number you can find by throwing two dice at a time in every cell of the dataset. In this dataset, you will find another table having only three columns B, C, and D called Rolls, Chances, and Probabilities. Let’s follow the procedure step by step.
Steps:
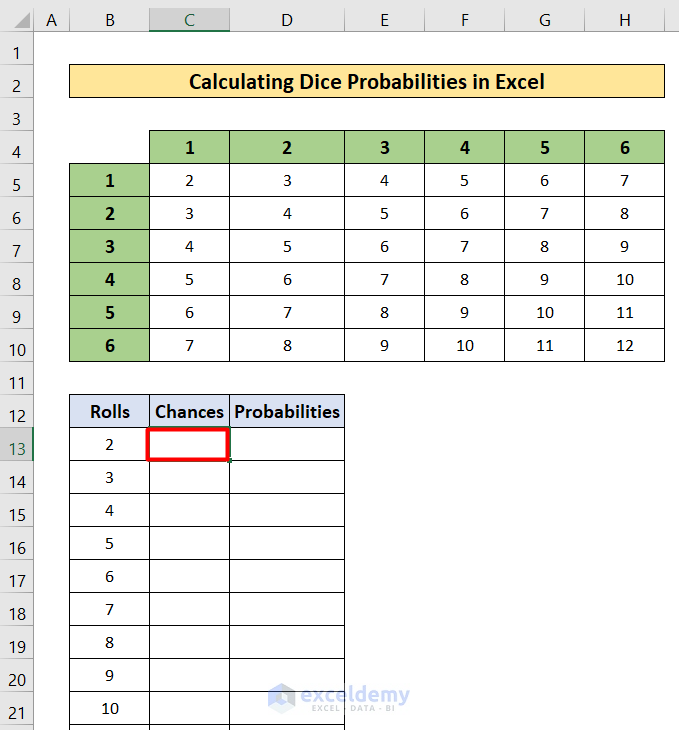
- Select the C13 cell first.
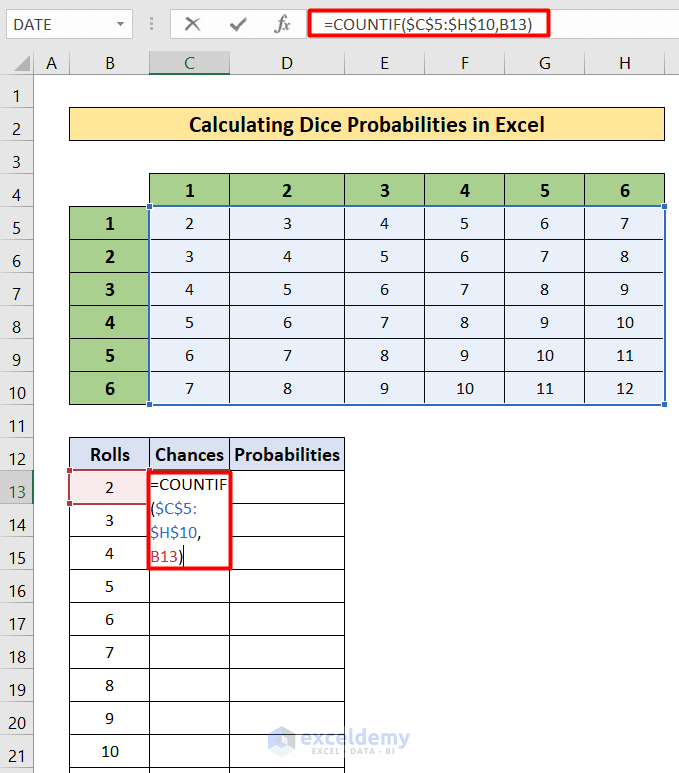
- After that, copy the following formula in the selected cell.
=COUNTIF($C$5:$H$10,B13)Here,
- The COUNTIF function will count the required number in cell B13 in the whole dataset ranging from C5 to H10.
- Then, press Enter.
- Consequently, you will find the answer in the picture given below.
- Then, Fill Handle the formula from C13 to C23.
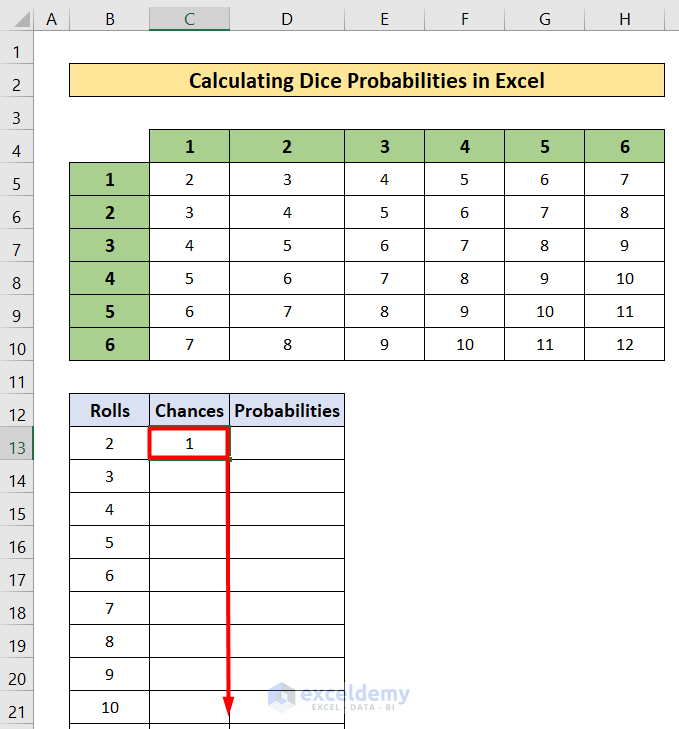
- After that, you will get the chances column filled with values.
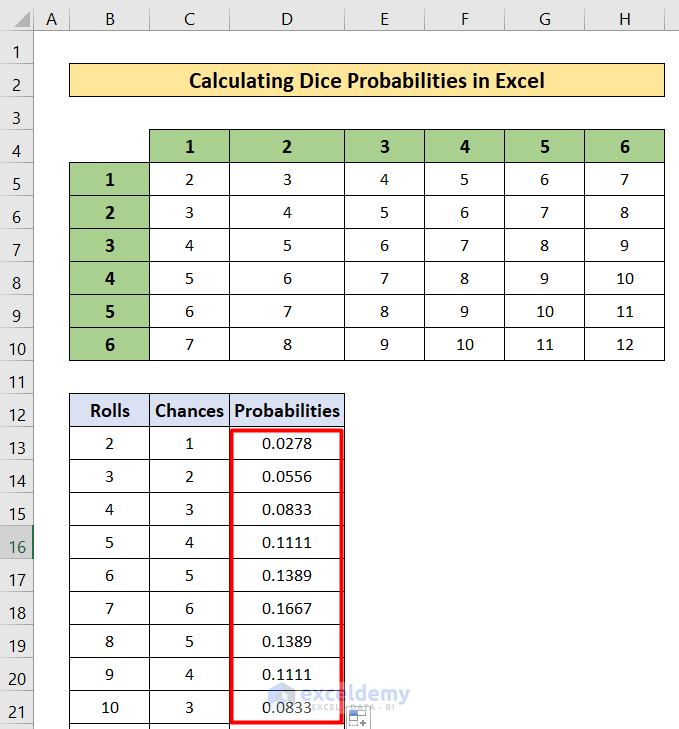
- Now, copy the following formula in the D13 cell and Fill Handle the formula from D13 to D23.
=C13/36Here,
- 36 is the total dataset value.
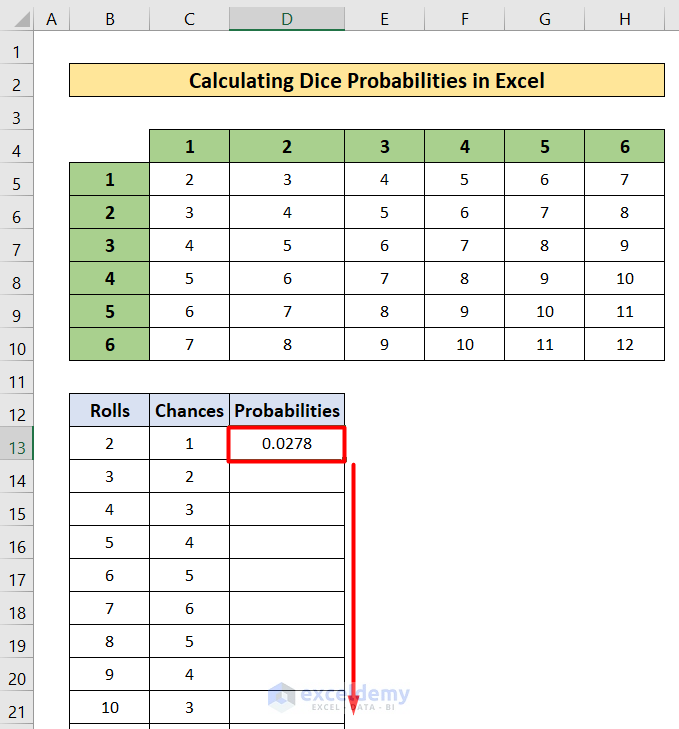
- As a result, you will find the Probabilities of Dice Rolls.
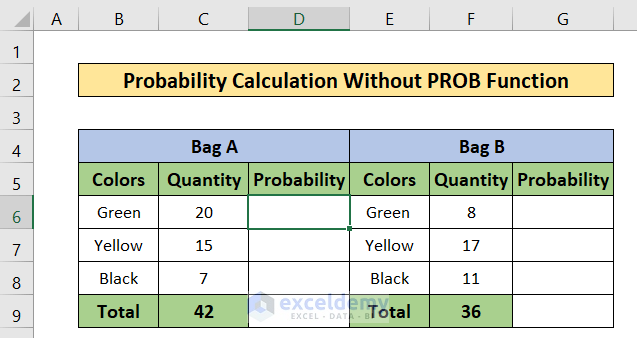
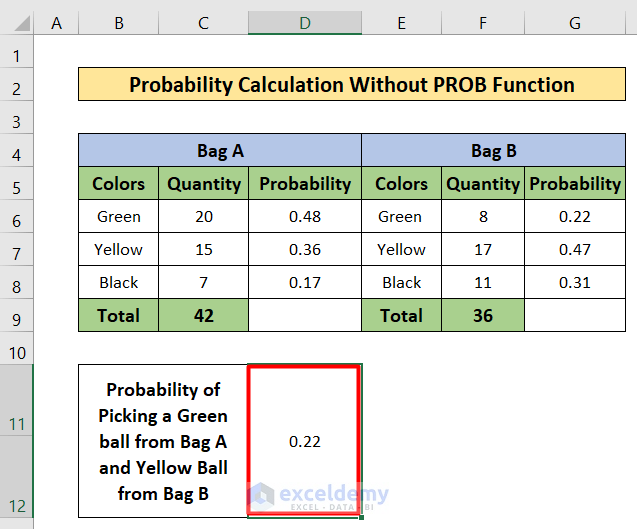
3. Probability Calculation in Excel Without Using PROB Function
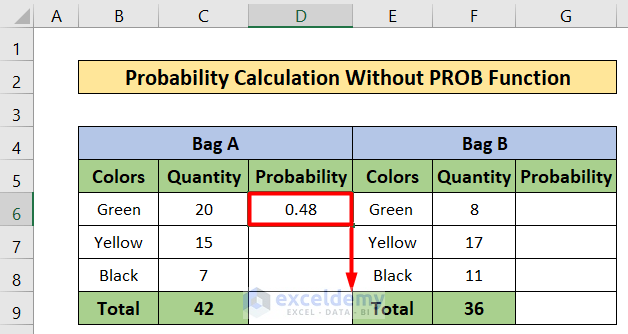
In this example, I will show the probability calculation without the PROB function. Let’s take a dataset indicating the ball colors and quantity of two bags called Bag A and Bag B. However, I will also determine the probability of occurrence of every color of the ball. Follow the steps mentioned below to understand the calculations.
Steps:
- Select the D6 cell first.
- Then, write down the following formula in the selected cell.
=C6/$C$9- After that, press Enter.

- Consequently, you will find the probability.
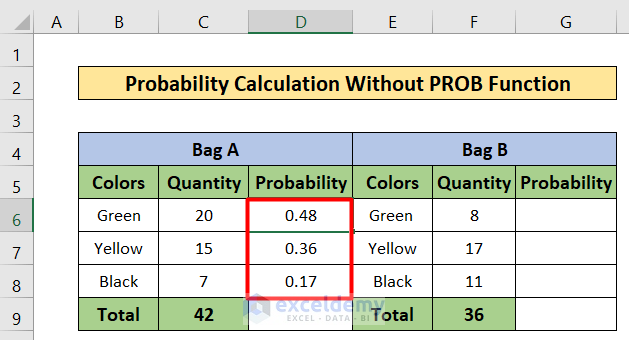
- Then, Fill-handle the formula from D6 to D8.
- As a result, you will get the probabilities like the picture given below.
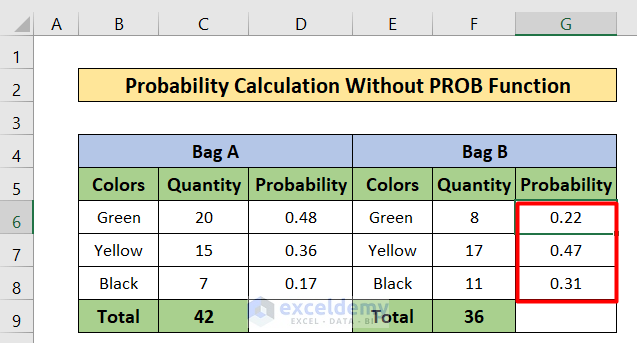
- Similarly, write down the following formula in the G6 cell:
=F6/$F$9
- You will get the probability in the G6 cell.
- Copy down the formula from G6 to G8 cell using the Fill Handle.

- You will find the probabilities just like the picture given below.
- Now I want to find the probability of picking a green ball from Bag A and a yellow ball from Bag B.
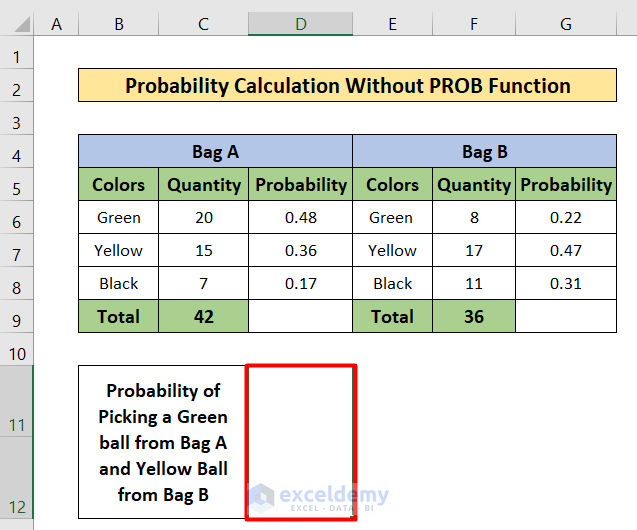
- So, copy the following formula in the selected cell.
=D6*G7
- Then, press the Enter
- As a result, you will get the probability in the selected cell.
Read More: How to Create Joint Probability Table in Excel
Calculating Probability in Excel with Mean and Standard Deviation
Sometimes, to calculate probability in Excel, the requirement occurs to use mean and standard deviation. In this section of this article, I will show how to calculate probability in Excel with Mean and Standard Deviation. I am considering a new dataset containing two columns B and C called Product and Sale. It has the Mean of Sales amount which is 55 and, assuming the standard deviation is 10. I will calculate the probability for x<55. Let’s follow the following steps.

Steps:
- First, select the C13 cell.

- Then, write down the following formula.
=NORMDIST(55,C11,C12, TRUE)
- Moreover, press Enter.
- Consequently, you will find the result.

How to Calculate Conditional Probability in Excel
In this portion, I will show how to calculate conditional probability in Excel. This is an easy way. I will consider a dataset ranging from B4 to E7. Let’s follow the following steps to calculate conditional probability.

Steps:
- Select the D10 cell.

- Then, copy the following formula
=C5/C7- After that, press Enter.

- Consequently, you will find the result.

- Now, select the D11 cell.
- Copy the following formula in the D11 cell:
=D5/D7- Press Enter.

- As a result, you will find the probability just like the picture given below.

Read More: How to Calculate Joint Probability in Excel
Things to Remember
- To calculate probability, you need to know the basics of probability first. The PROB function will give you the probable value between some of the probabilities.
Download Practice Workbook
Please download the workbook to practice yourself.
Conclusion
In this article, I have tried to explain how to Calculate Probability in Excel. I hope you have learned something new from this article. Now, extend your skill by following the steps of these methods. I hope you have enjoyed the whole tutorial. If you have any kind of queries feel free to ask me in the comment section. Don’t forget to give us your feedback.
Related Articles
- How to Calculate Binomial Probability in Excel
- How to Calculate Probability of Exceedance in Excel
- How to Find Marginal Probability in Excel
<< Go Back to Excel Probability | Excel for Statistics | Learn Excel
Get FREE Advanced Excel Exercises with Solutions!
