While presenting a report, analysts want to focus on the top-performing items. Showing only the top 10 products, customers, or regions based on a measure like sales, profit, or quantity in a visual is a common requirement. Power BI makes it easy to filter a visual to show only the top items directly using the Filter Pane with a Top N filter. It requires zero DAX or custom code.
In this tutorial, we will show how to apply a Top 10 filter in Power BI. The built-in Filter Pane handles it in under a minute.
Step 1: Open Your Power BI Report and Select a Visual
- Open Power BI Desktop or your report on Power BI Service
- Click on the visual you want to filter
- A bar chart, column chart, or table works best for Top N scenarios
- The visual must be selected for its individual filters to appear in the Filter Pane
- Select the Sales by Product chart
Step 2: Open the Filter Pane
- On the right-hand side of Power BI, you will see the Filters pane
- If not visible, go to the View tab >> click Filter
- If the pane is collapsed, click it to expand, and you’ll see three sections:
- Filters on this visual: Applies only to the selected chart
- Filters on this page: Applies to everything on the current report page
- Filters on all pages: Applies report-wide

You’ll work in Filters on this visual to apply the Top 10 filter.
Step 3: Add the Field to Filter
- Drag the field you want to rank by (e.g. Product Name) to the Filters on this visual area
- Click the dropdown arrow next to the Filter type
- This will show options like Basic filtering, Advanced filtering, and Top N

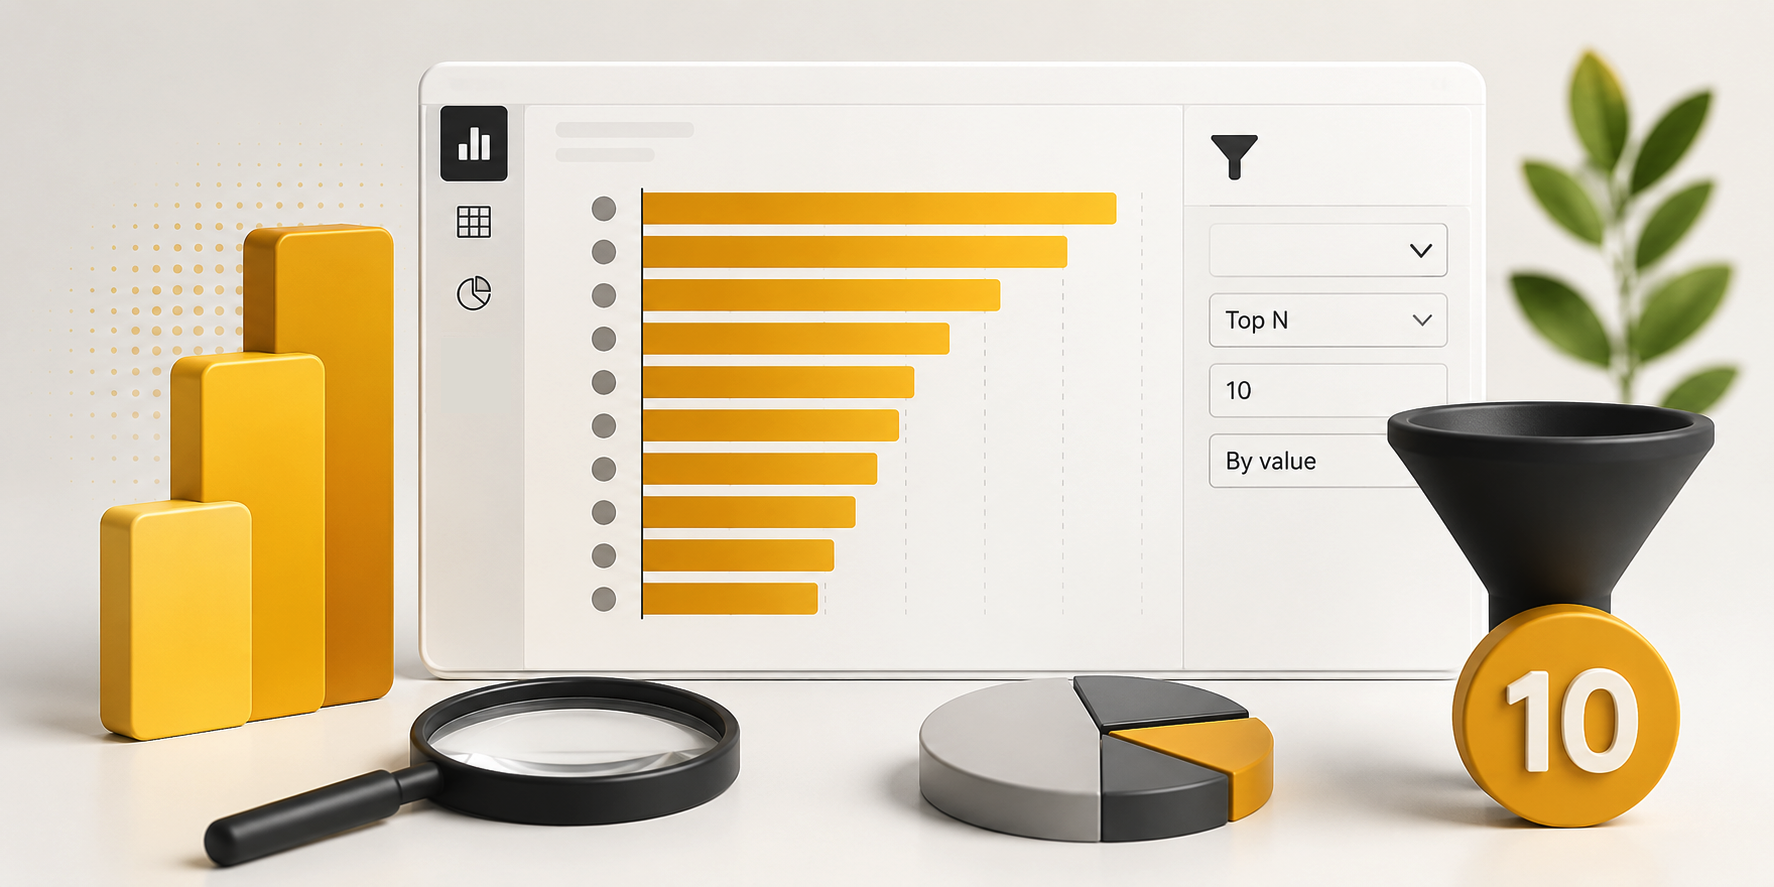
Step 4: Choose and Configure Top N Filtering
- From Filter type >> select Top N
- In the filter options:
- Show items: Select Top
- Number of items: Enter 10 (or any number you need)
- By value: Drag and drop the measure you want to use for ranking, like Sales Amount
- Click Apply filter

- The visual now displays only the top 10 items based on the selected measure

Tip: Make sure your measure is already aggregated in the visual (sum, average, etc.) for meaningful ranking.
Step 5: Verify and Adjust
- Dynamic updates: If you add new data, the top 10 will automatically adjust.
- Sorting: Ensure your visual is sorted in descending order by the measure to reflect the top items at the top.
- Other visuals: This filter affects only the selected visual (visual-level filter). To filter multiple visuals, use Page level or Report level filters.

Optional: Display “Others”
Sometimes it’s useful to group the remaining items under “Others”. While Power BI does not do this automatically, you can:
- Create a measure for the top N items.
- Use conditional formatting or grouping in the chart to show all remaining items as “Others.”
This approach is more advanced and requires a DAX measure to provide a combined view.
Tips and Best Practices
- Dynamic Ranking: The Top N filter is calculated dynamically based on the current filters and context (slicers, page filters, etc.).
- Ties: Power BI may return more than 10 items if there are ties in the ranking value.
- Sorting: You can still sort the visual in descending order for better presentation.
- Multiple Measures: You can apply Top N on one field while using other measures in the visual.
- Performance: Top N filters are efficient as they are applied at query time.
- Visual-Level vs Page-Level: Top N is typically a visual-level filter. It is not directly available as a page-level filter — use DAX or parameters for more advanced dynamic Top N filtering across a page.
Common Visuals That Work Well
- Bar and column charts
- Tables and matrices
- Treemap charts
- Pie/donut charts (with caution — limited slices)
- Line charts (for top categories over time)
Troubleshooting
- Top N option missing? Ensure you are adding a categorical field to Filters on this visual (not page level) and that the field has a proper data type.
- No change after applying? Double-check that you dragged a numeric measure into the By value box.
- Want Bottom N? Select Bottom instead of Top.
Conclusion
By following the steps above, you can easily apply a Top 10 filter in Power BI. This method is quick, maintainable, and requires zero DAX — perfect for most business reporting needs. Once set up, you can easily change the number (e.g. Top 5 or Top 20) or the ranking measure as requirements evolve. Start practicing with simple column charts, then explore other chart types and tables.
Get FREE Advanced Excel Exercises with Solutions!
