Obviously, you heard the term weather forecasting where weather forecasters determine the likelihood that it will rain, snow, have clouds, etc. on a specific day at a specific location. What do you think about how they can tell it? Here, they take the help of the concept of the statistical term probability. In this article, you’ll get to learn about calculating probability with mean and standard deviation effectively in Excel with appropriate illustrations.
What Is Probability?
Probability, a mathematical concept, depicts the likelihood of any event occurring with respect to the given total number of events. The mathematical expression of probability is given below.
Everyday existence heavily relies on probability. We use this term in many aspects of our life like the prediction of the weather, in business development or production, etc.
Calculating Probability in Excel with Mean and Standard Deviation: 2 Ways
For clarification, we’re going to use an Age List of Students of a particular institution. This dataset includes their ID, names, and their corresponding ages in columns B, C, and D respectively.
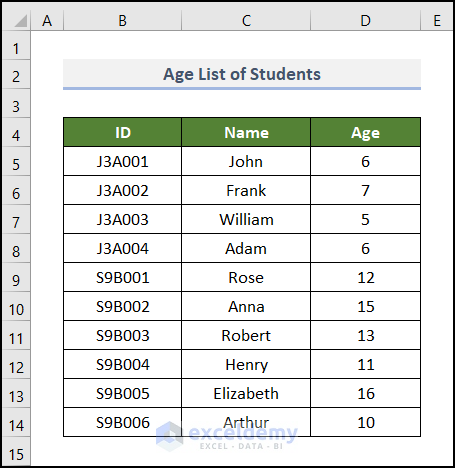
From the above dataset, we’ll calculate their probability using the mean and standard deviation. Here, we’ll show 2 diverse ways to complete the task. So, let’s explore them one by one.
Here, we have used the Microsoft Excel 365 version, you may use any other version according to your convenience.
1. Calculating Probability from Z Score in Excel
A Z Score is a parameter using which we can calculate the value of probability. We can easily calculate the value of the Z Score using Excel formulas. Let’s explore this method step by step.
📌 Steps:
Before going into the detailed approach, we should know what the Z score is. If you haven’t heard the term before, don’t worry. We’re here to help.
Z score is a special type of value that indicates how far the value is from the mean. The general formula for the Z score is the following.
Here,
- Z represents the value of the Z score
- x is the value of any case
- µ stands for the mean value
- σ represents the value of the Standard Deviation
The value of the Z score can be either positive, negative, or zero. A Z score with a value greater than zero can be defined as a specific value that is over the mean (average) value, whereas a Z score with a value lower than zero can be defined as a specific value that is under the mean (average) value. Finally, when the Z score is zero, it is equal to the mean value.
Let’s start solving the problem now.
- At the very beginning, create an output range in cells in the B16:D16 range where we’ll get the Mean value.
- Then, select cell D16 and enter the following formula into the formula bar.
=AVERAGE(D5:D14)
Here, the AVERAGE function returns the arithmetic average value of numbers in the D5:D14 range.
- After that, press the ENTER key.

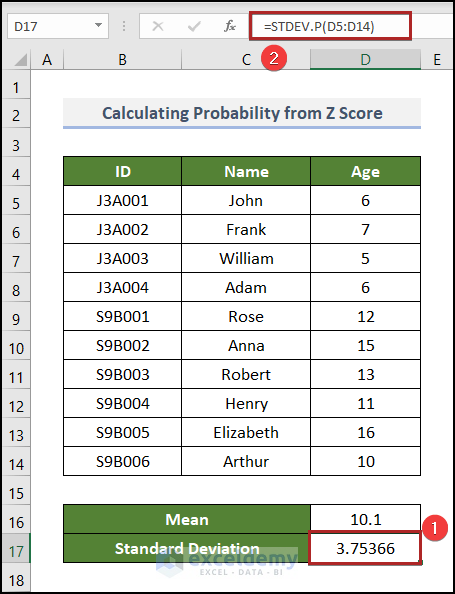
Now, we’ll find out the value of the standard deviation for this dataset.
- To do this, go to cell D17 and insert the formula below.
=STDEV.P(D5:D14)
The STDEV.P function is a statistical function. It helps us to calculate the standard deviation utilizing the total population provided as parameters.
- As usual, press ENTER.
Currently, we need to focus on the Z-score calculation. Primarily, we need to calculate the mean and standard deviation for the Z-score. We did it in the previous steps.
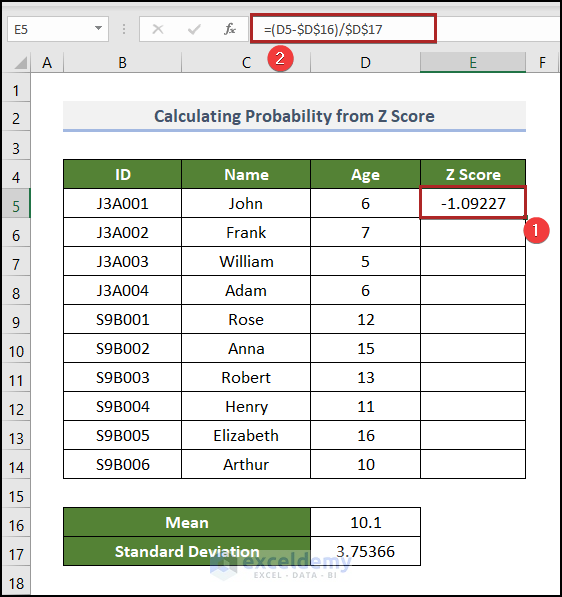
- At first, create a new column with the heading Z Score under Column E.
- Then, move to cell E5 and write down the following formula.
=(D5-$D$16)/$D$17
To understand this formula, compare it with the generic formula of the Z score we stated before.
- As always, hit the ENTER key.
- Presently, bring the cursor to the right-left corner of cell E5 and suddenly it will look like the plus (+) sign. Basically, it’s the Fill Handle tool.
- Then, double-click on it.
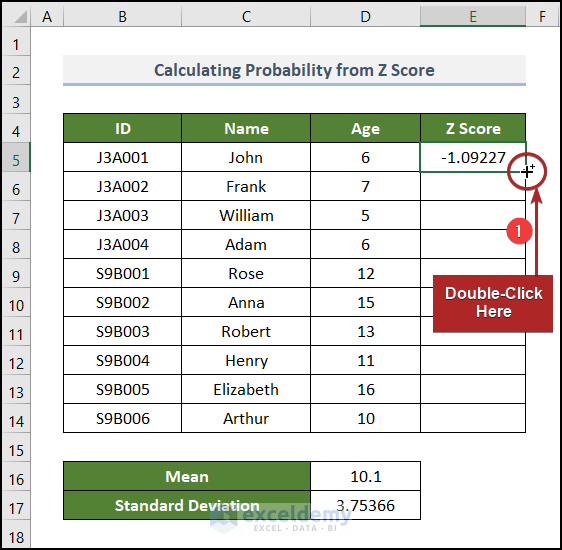
Magically, it will fill up the following cells in column Z Score with the desired results.

- After that, construct another new column named Probability under Column F.
- Then, select cell F5 and paste the following formula.
=NORMSDIST(E5)
Here, the NORMSDIST function returns a standard normal cumulative distribution. It takes only one argument, which is the Z score.
- Following this, hit ENTER.
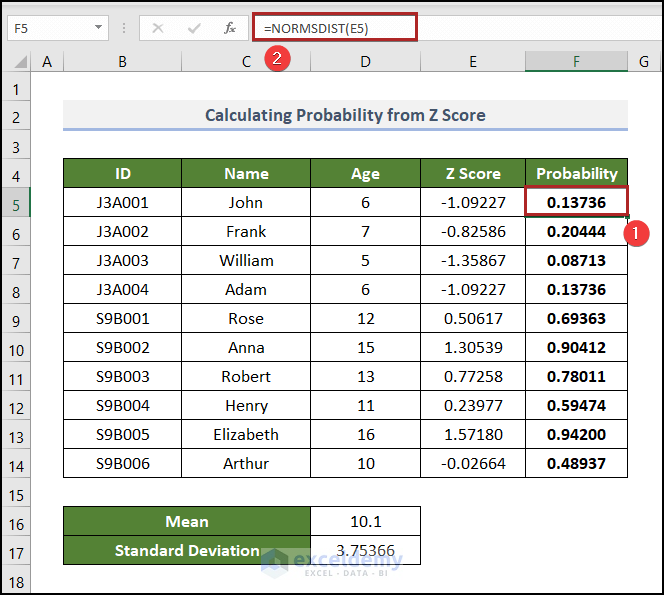
We are illustrating the result for cell F5. The value of probability is 0.13736. The value means that the possibility of that event occurring is 0.13736 with respect to the total number of events. In other words, if we take a population of 1,00,000 students, there is a possibility that 13,736 students will be at the age of 6.
Read More: How to Calculate Probability of Exceedance in Excel
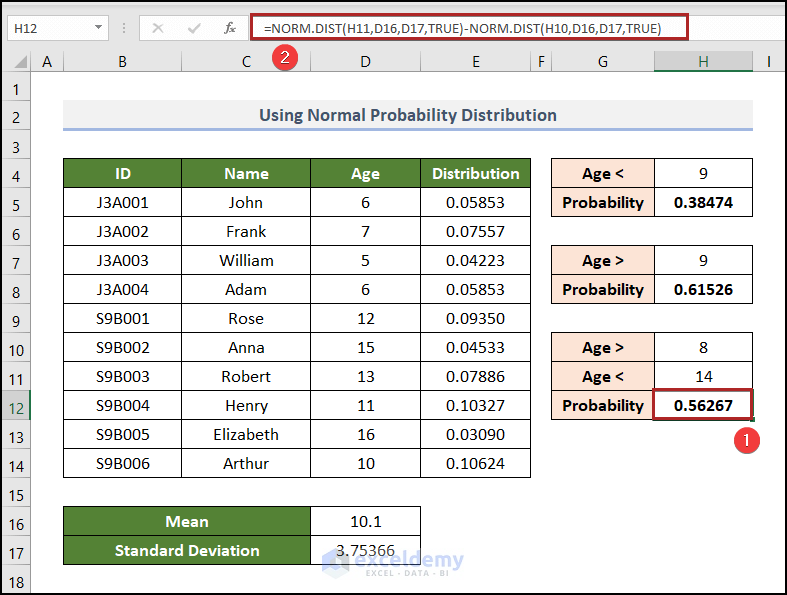
2. Using Normal Probability Distribution
A probability distribution is a mathematical/statistical function that describes the likelihood of the occurrence of all possible events during an experiment. Of the few types, the normal probability distribution is the single most important and most commonly used probability distribution in probability and statistics. It is also known as the Gaussian distribution. Here, we’ll use this normal distribution to calculate the probability of some events. So, without further delay, let’s dive in!
📌 Steps:
- First of all, determine the values of Mean and Standard Deviation in cells D16 and D17 like in Method 1.

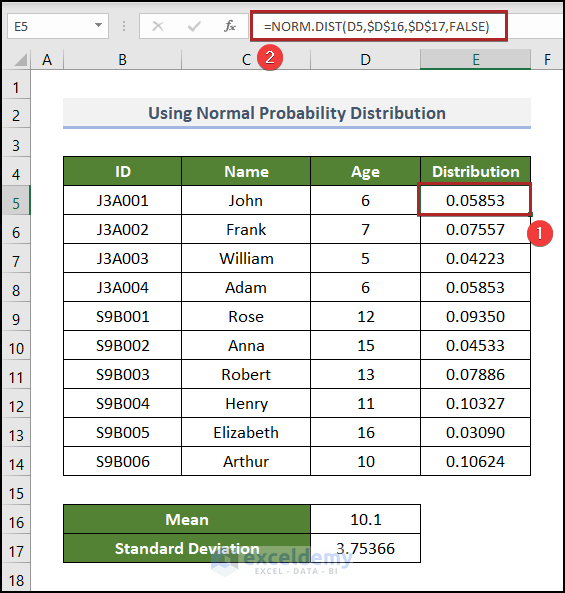
- Then, go to cell E5 and insert the following formula.
=NORM.DIST(D5,$D$16,$D$17,FALSE)
The NORM.DIST function is also a statistical function that has an extremely broad range of applications in different sectors. This function gives us back a normal distribution for the given mean and standard deviation.
- Afterward, tap the ENTER key.
Now, suppose you picked a random age. What is the probability of it being less than 9?
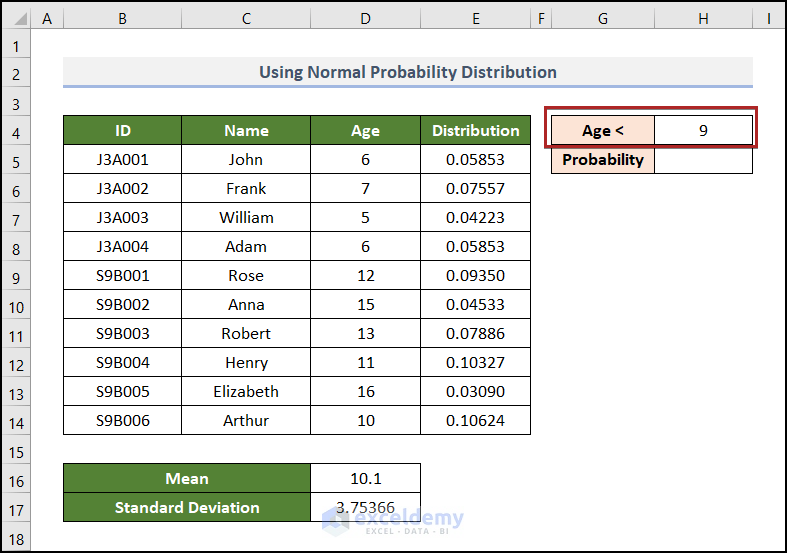
You can find that out by following the steps below.
- Currently, select cell H5 and put the following formula into the cell.
=NORM.DIST(H4,D16,D17,TRUE)
- Simply, press ENTER.

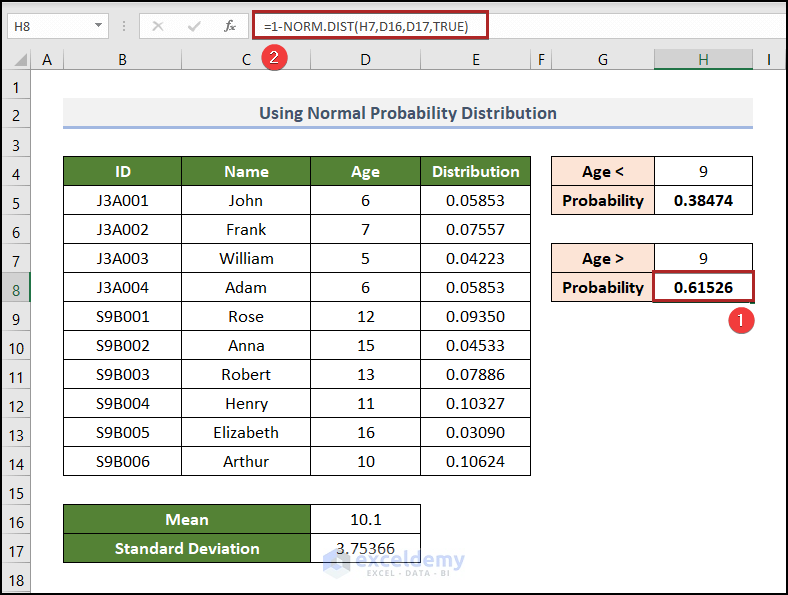
Now, what is the probability of that random age being greater than 9? Well, you can just subtract the probability of it being less than that from 1. So, the formula we used is the following.
=1-NORM.DIST(H7,D16,D17,TRUE)
Now, what is the probability of it being between the ages of 8 and 14?

Well, you can find that out by subtracting the probability of it being less than 8 from the probability of it being less than 14 as shown in the following formula in cell H12.
Read More: How to Calculate Probability in Excel
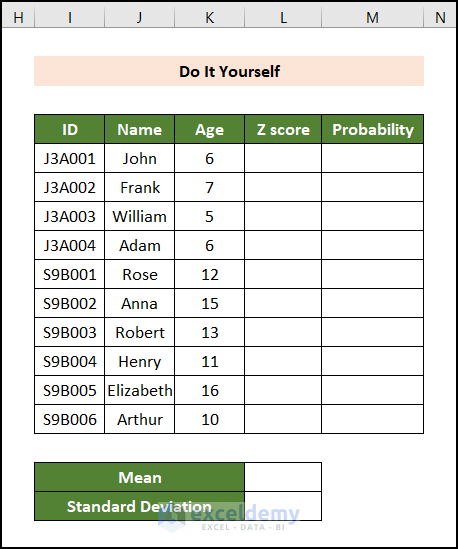
Practice Section
For doing practice by yourself, we have provided a Practice section like the one below on each sheet on the right side. Please do it by yourself.
You may download the following Excel workbook for a better understanding and practice yourself.
Conclusion
This article provides easy and brief solutions for calculating probability in Excel with mean and standard deviation. Don’t forget to download the Practice file. Thank you for reading this article. We hope this was helpful. Please let us know in the comment section if you have any queries or suggestions.
Related Articles
<< Go Back to Excel Probability | Excel for Statistics | Learn Excel
Get FREE Advanced Excel Exercises with Solutions!
