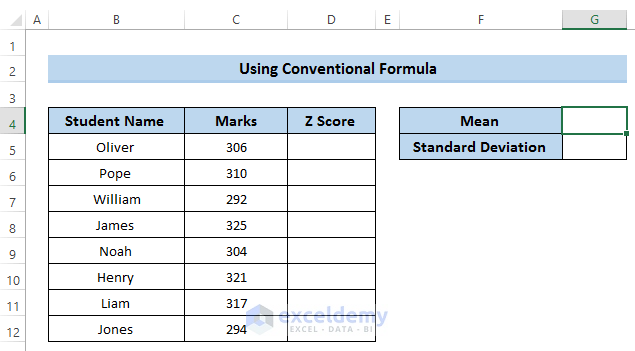
Method 1 – Calculate Z Score Using Conventional Formula
Step 1: Calculate Mean of Dataset
- Select cell G4.
- Enter the following formula in the formula box:
=AVERAGE(C5:C12)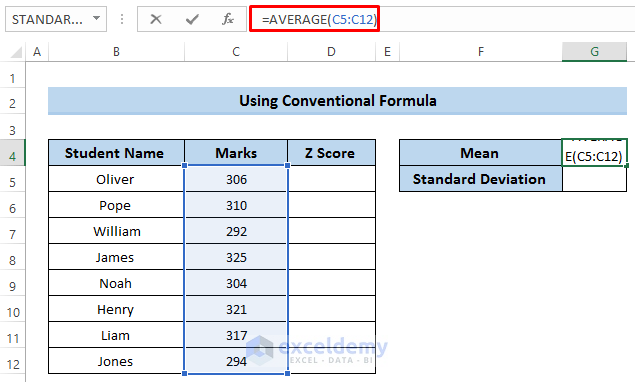
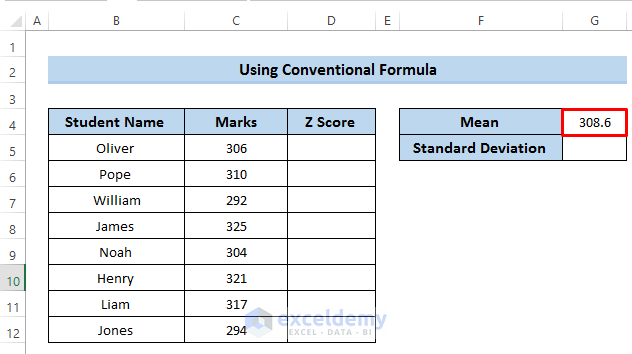
- Press Enter to apply the formula.
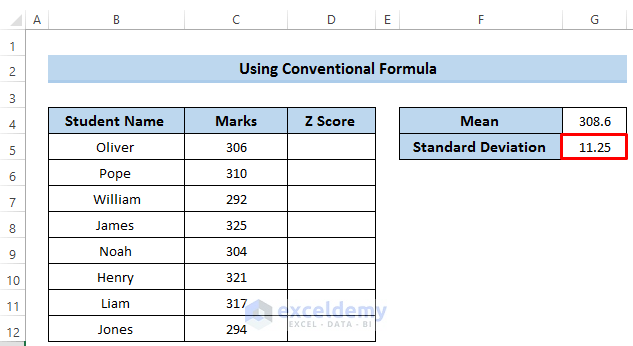
Step 2: Calculate Standard Deviation of Dataset
- Select cell G5.
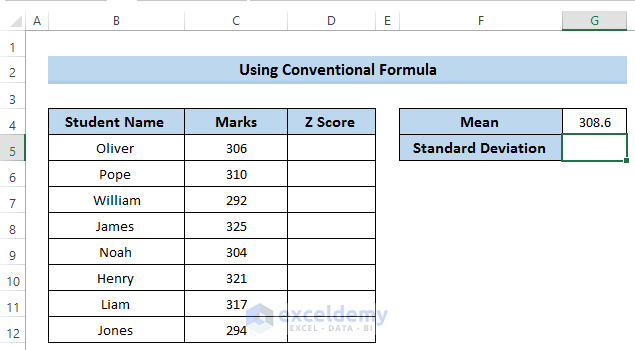
- Enter the following formula in the formula box.
=STDEVPA(C5:C12)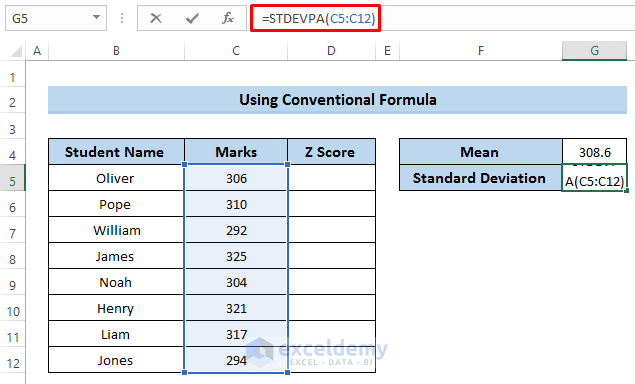
- Press Enter to apply the formula.
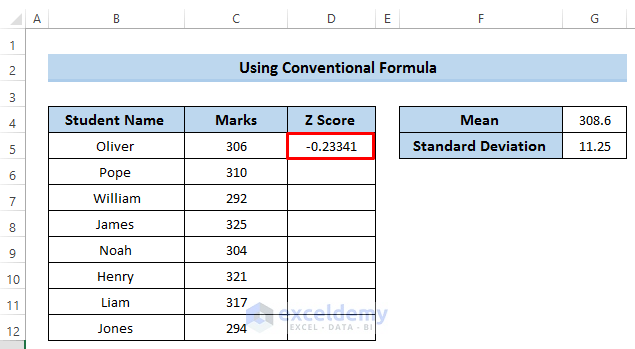
Step 3: Calculate Z Score
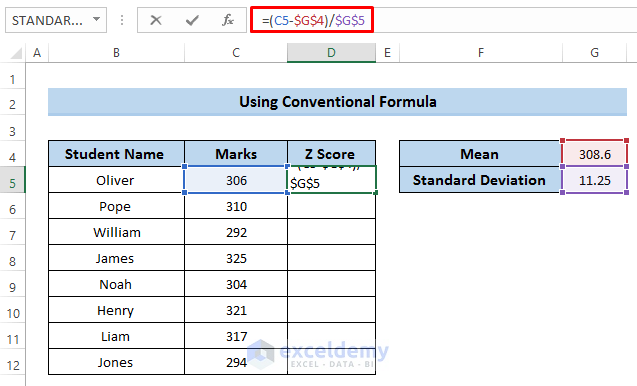
- Select cell D5.
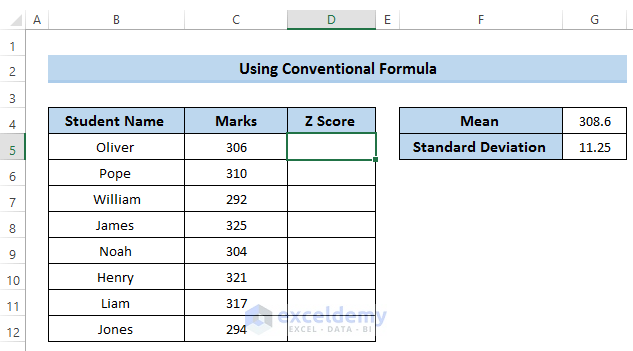
- Enter the following formula in the formula box.
=(C5-$G$4)/$G$5The cell G4 and cell G5 denote the mean and standard deviation respectively. We have made these cells absolute by using the ($) sign. That means it is fixed.
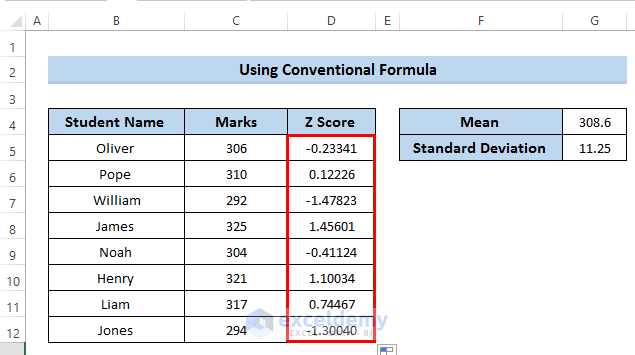
- Press Enter to apply the formula.
- Use the Fill Handle tool for the remaining cells.
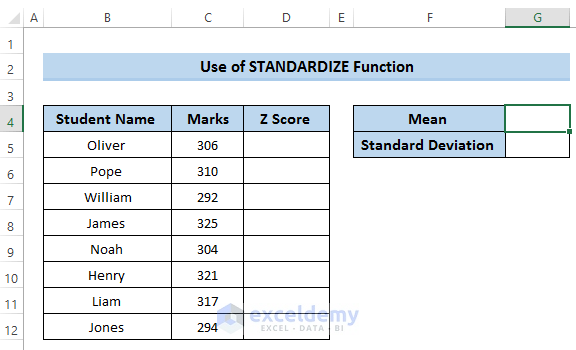
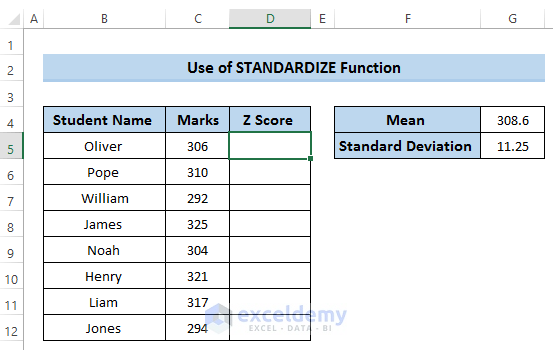
Method 2 – Use of STANDARDIZE Function to Calculate Z Score
Step 1: Calculate Mean of Dataset
- Select cell G4.
- Go to the Formulas tab in the ribbon.
- From the Function Library, select More Functions.
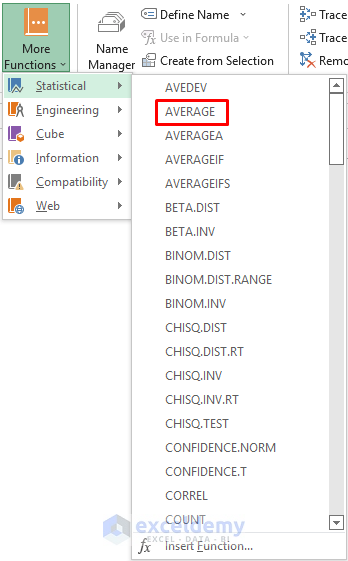
- In the More Functions option, select Statistical.
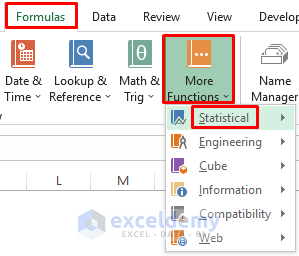
- In the Statistical section, select the AVERAGE function.
- A Function Arguments dialog box will pop up.
- In the Number1 section, select the total range of cells.
- Click on OK.
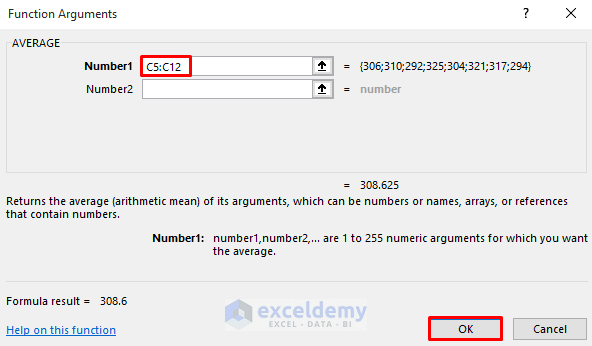
- It will provide the mean value of the dataset in cell G4.
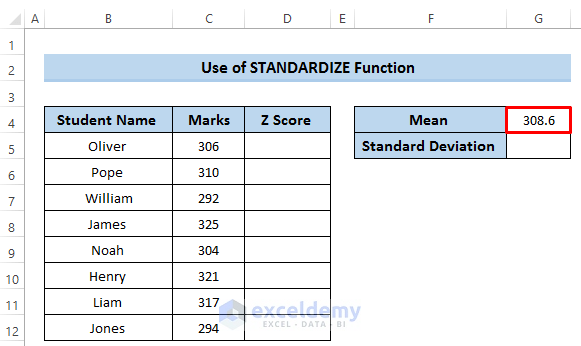
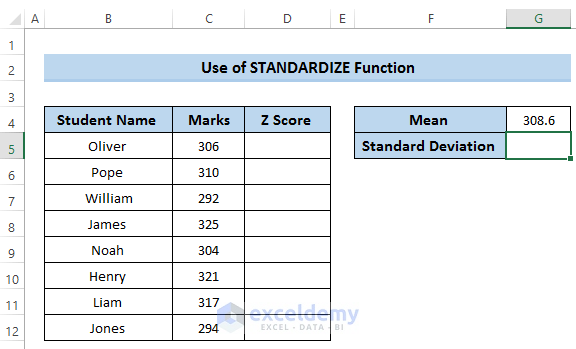
Step 2: Calculate Standard Deviation of Dataset
- Select cell G5.
- Go to the Formulas tab in the ribbon.
- From the Function Library, select More Functions.
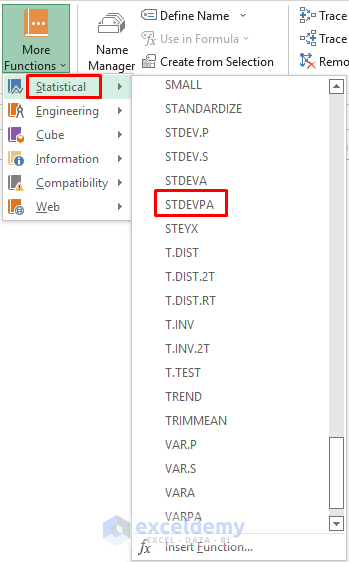
- In the More Functions option, select Statistical.
- In the Statistical section, scroll down and select the STDEVPA function.
- A Function Arguments dialog box will pop up.
- In the Value1 section, select the range of cells C5 to C12.
- Click on OK.
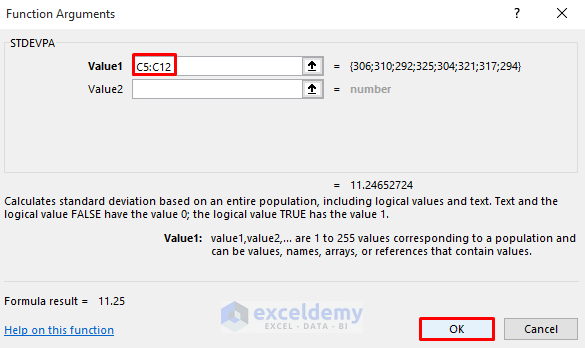
- We will get the following standard deviation.

Step 3: Calculate Z Score
- Select cell D5.
- Go to the Formulas tab in the ribbon.
- From the Function Library, select More Functions.
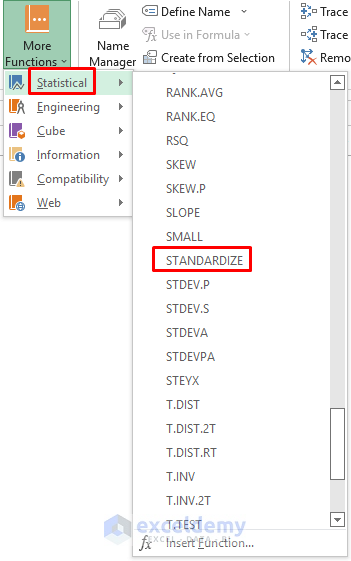
- In the More Functions option, select Statistical.
- In the Statistical section, scroll down and select the STANDARDIZE function.
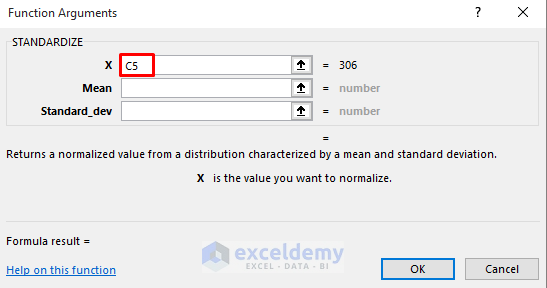
- A Function Arguments dialog box will pop up.
- In the X section, select cell C5.
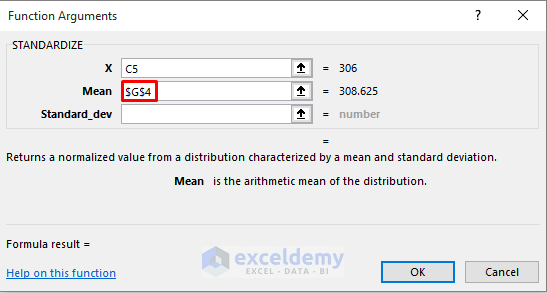
- In the Mean section, select cell G4 which is the required mean value of this dataset. As we want to use this value for other calculations, we need to make it an absolute cell reference.
- In the Standard_dev section, select cell G5 which is the required standard deviation of this dataset. We have made this cell absolute by using the ($) sign.
- Click on OK.
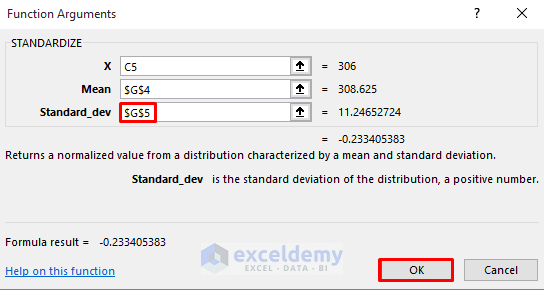
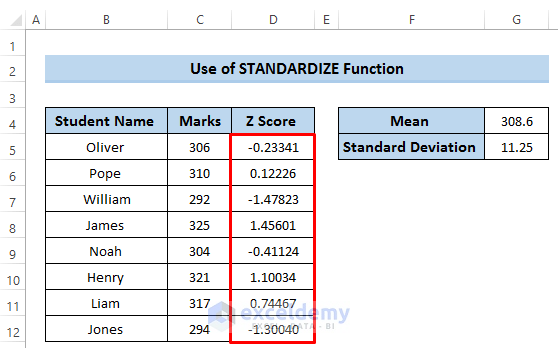
- We get the following Z-score. See the screenshot.
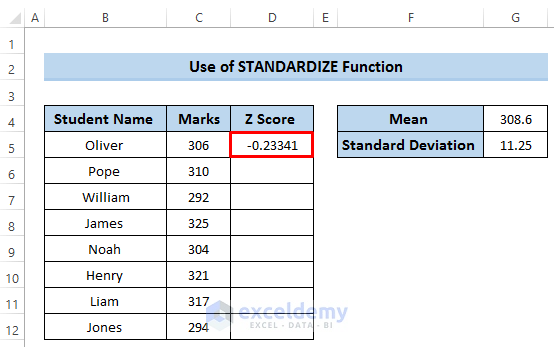
- Use the Fill handle tool for the remaining cells.
Read More: How to Calculate Critical Z Score in Excel
Interpretation of Z Score in Excel
When we illustrate the Z-score, we need to identify how many standard deviations above or below the value are from the mean. The Z-score can be positive, negative or zero. A positive Z-score can be defined as a specific value that is above the mean value whereas a negative Z-score can be defined as a specific value that is below the mean value. When the Z-score is zero it is equal to the mean value.
- In our dataset, the mean value is 6 and the standard deviation is 25. If we consider the specific value e 306, the Z-score for this value is -0.23341. Which means 306 has the standard deviation of 0.23341. Which is below the mean or average value.
- When the value is 310, we get the z-score as 12226. That means that 310 has the standard deviation of 1226. Which is above the mean value.
Download Practice Workbook
Related Articles
- How to Calculate Altman Z Score in Excel
- How to Calculate Z-Score with 95 Confidence Interval in Excel
- How to Calculate P Value from Z Score in Excel
- How to Calculate Probability from Z-Score in Excel
<< Go Back to Statistical Significance in Excel | Excel for Statistics | Learn Excel
Get FREE Advanced Excel Exercises with Solutions!
