The manual calculation process of the Z score:
Steps:
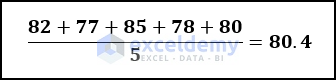
- Choose a dataset. Here, we use a simple dataset with five values: 82, 77, 85, 78, and 80.
- Estimate the simple Mean of this dataset.
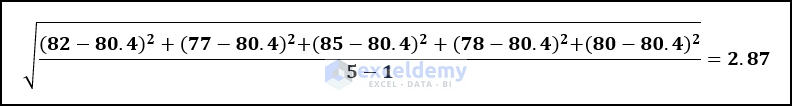
- Evaluate the Standard Deviation of our data.
- The standard deviation is 2.87, which indicates that the dataset is normally distributed.
- Choose your desired confidence level interval. For our data, we set it at 95%.
- In the Z-Score chart, we must find the value of 0.975 (e.g., 0.95+(0.05/2)=0.975).
- You may notice that the Vertical Axis value for 0.975 is 1.9 and the Horizontal Axis value is 0.06.
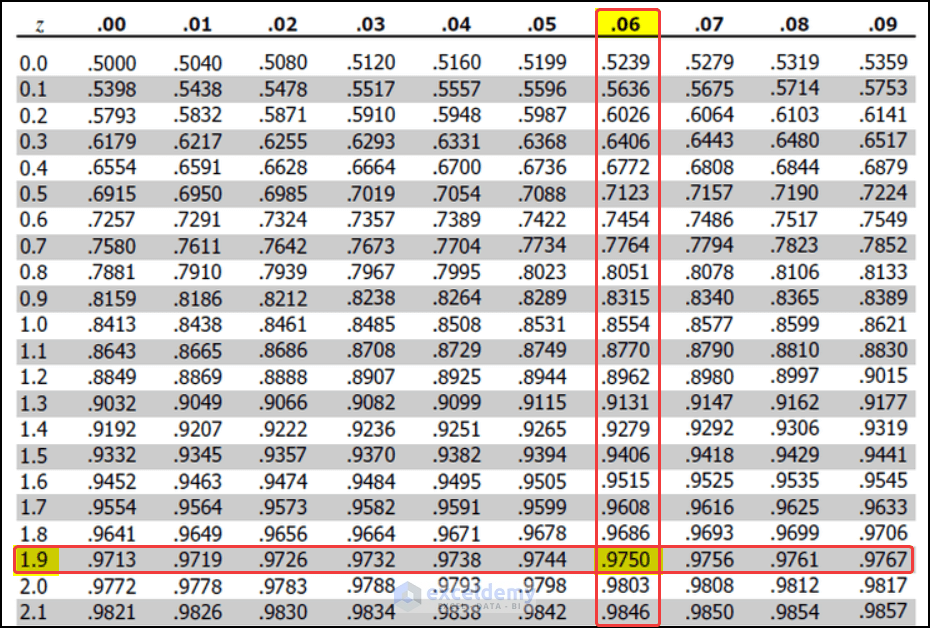
- Our 95% confidence interval Z-score value will be 1.9+0.06 = 1.96.
We can estimate the Z score with a 95 confidence interval manually.
Step-by-Step Procedure
Step 1: Calculate the Mean of the Dataset
- Select cell F5.
- Enter the following formula in the cell:
=AVERAGE(C5:C14)
- Press Enter.
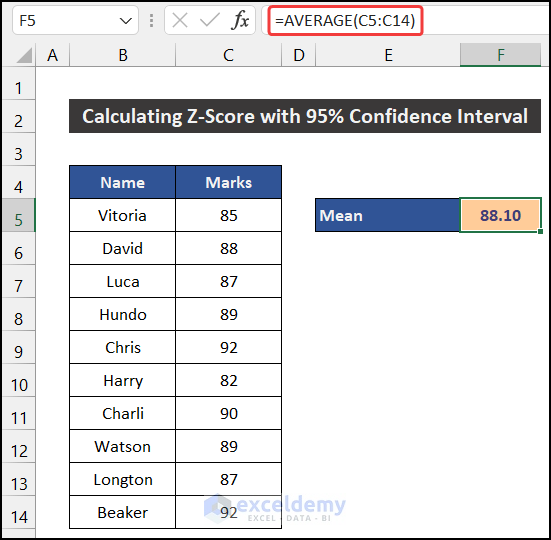
- You will get the mean value of our dataset.
Step 2: Estimate Standard Deviation
- Select cell F6.
- Enter the following formula in the cell:
=STDEV.P(C5:C14)
- Press Enter.
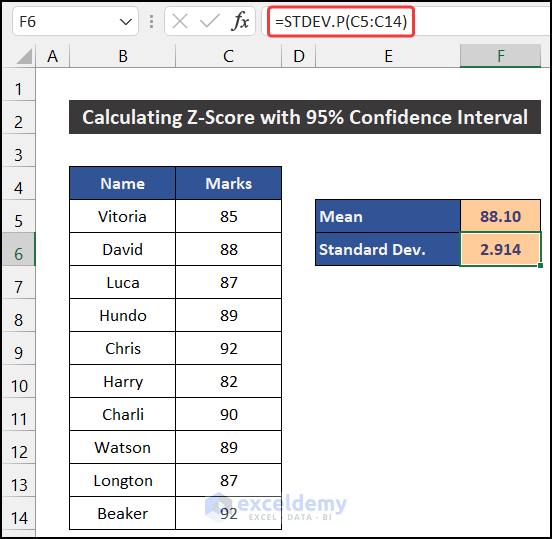
- You will get the value of the Standard Deviation.
- You may notice that the Standard Deviation is 2.914. We can decide whether our dataset will be normally distributed.
Step 3: Define the Confidence Interval Level
- Title cells E7 and E8 as Confidence level and Alpha.
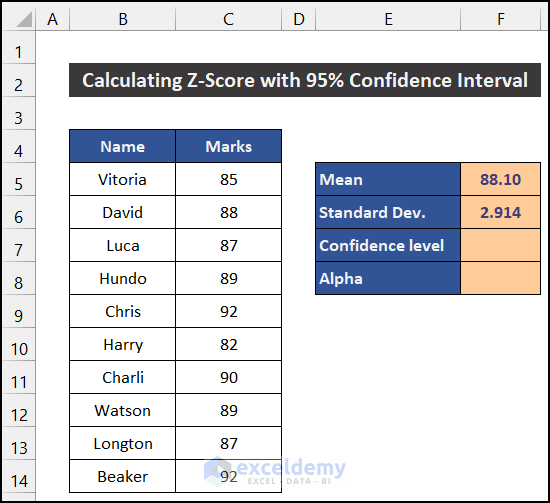
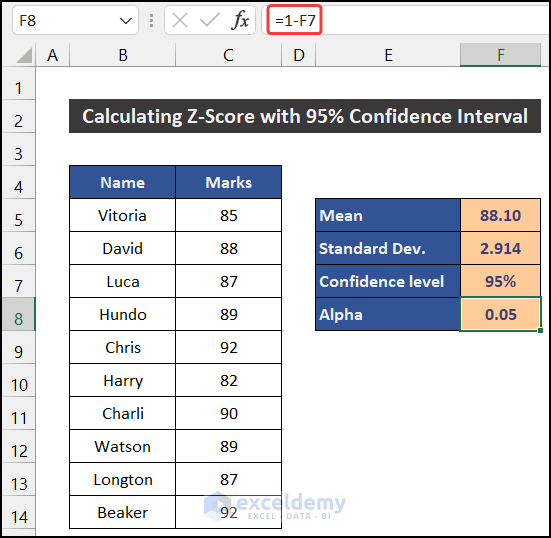
- In cell F7, define the Confidence level. Here, we define our confidence interval as 95%.

- Enter the following formula to get the Alpha value in cell F7:
=1-F7
- Press Enter.
Step 4: Estimate the Z Score for the Desired Confidence Interval
- Select cell F10.
- Enter the following formula in the cell:
=ABS(NORM.S.INV((F8)/2))
- Press Enter.
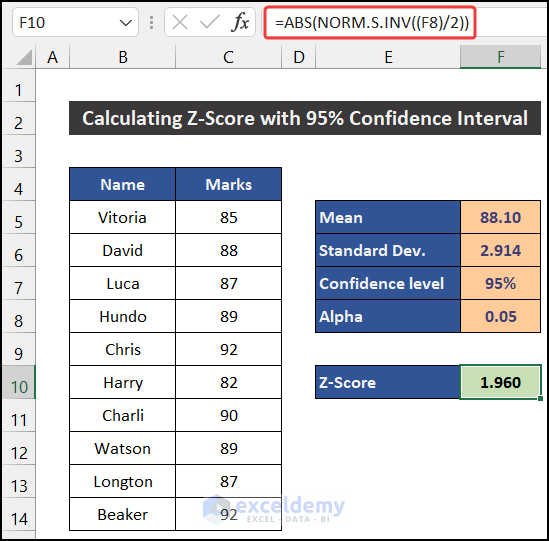
- You will get the Z score value with a 95 confidence interval level, equal to the manual procedure.
Breakdown of the Formula
We are breaking down the formula for cell F10.
NORM.S.INV((F8)/2): The NORM.S.INV function gives us the Z-score value of 0.025. The value will show a negative sign as this interval level is at the right side of the mean position. Here, the function returns -1.960.
ABS(NORM.S.INV((F8)/2)): The ABS function will show the absolute value of the result of the NORM.S.INV function. For this cell, the function returns 1.960.
Read More: How to Calculate Critical Z Score in Excel
Download the Practice Workbook
Download this workbook for practice.
Related Articles
- How to Calculate Altman Z Score in Excel
- How to Calculate P Value from Z Score in Excel
- How to Calculate Probability from Z-Score in Excel
<< Go Back to Statistical Significance in Excel | Excel for Statistics | Learn Excel
Get FREE Advanced Excel Exercises with Solutions!
