What Is Z-Score?
Z-Score is a special type of value that indicates how far the value is from the mean. The general formula for the Z-score is:

- Z represents the value of the Z-score
- X is the value of any case
- µ stands for the mean value
- σ represents the value of the Standard Deviation
Read More: How to Calculate Z Score in Excel
What Is Probability?
Probability represents the possibility of occurring any events with respect to the total number of events. The mathematical expression of probability is:

How to Calculate Probability from Z-Score in Excel with Quick Steps
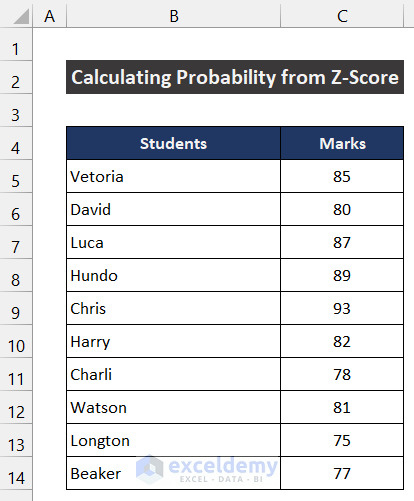
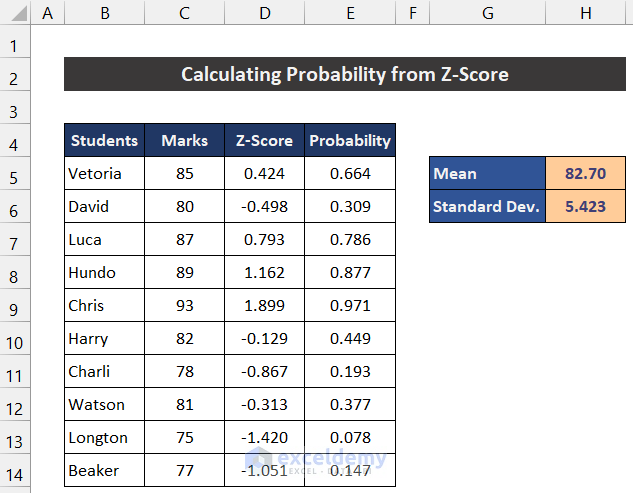
We’ll consider a dataset of 10 students at a school. The names of the students are in column B and their examination marks are in column C.
Step 1 – Estimate the Mean Value of the Dataset
- Select cell F5.
- Insert the following formula in the cell.
=AVERAGE(C5:C14)
- Press Enter.
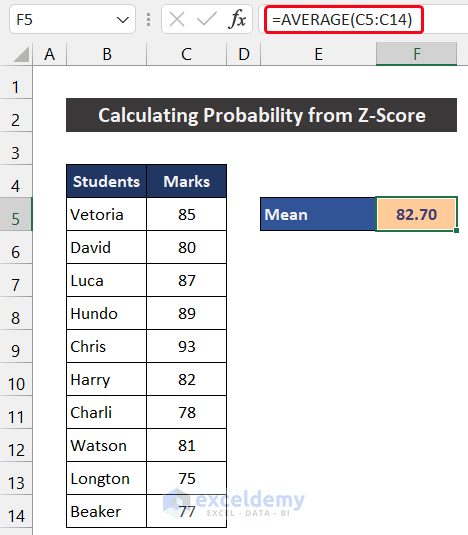
- You will get the value of the mean of our dataset.
Step 2 – Evaluate the Standard Deviation
- Select cell F6.
- Use the following formula in the cell.
=STDEV.P(C5:C14)
- Press the Enter key.
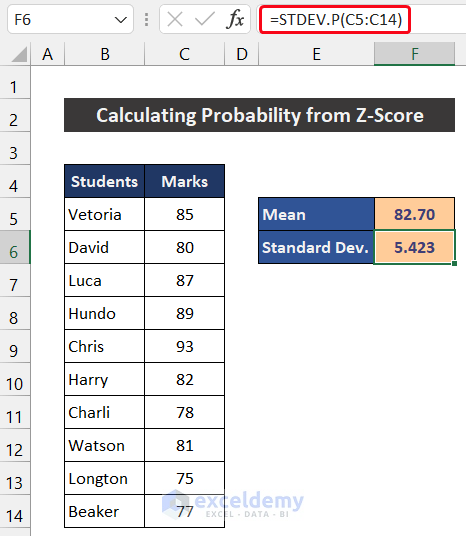
- You will get the value of the standard deviation.
Step 3 – Determine the Z-Score
- Insert a Column between columns C and D.
- Rename the column as Z-Score.
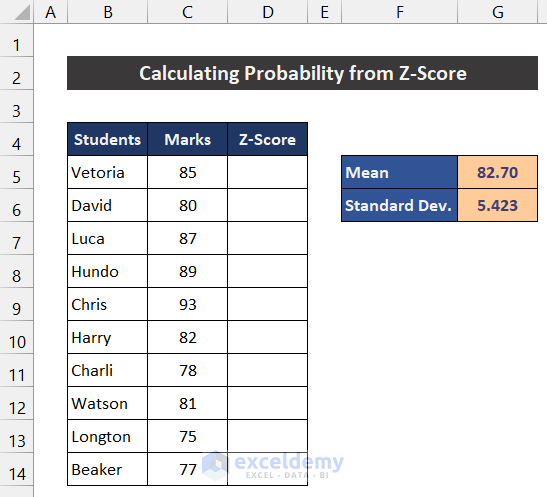
- Select cell D5 and use the following formula in the cell:
=(C5-$G$5)/$G$6
- Press Enter.
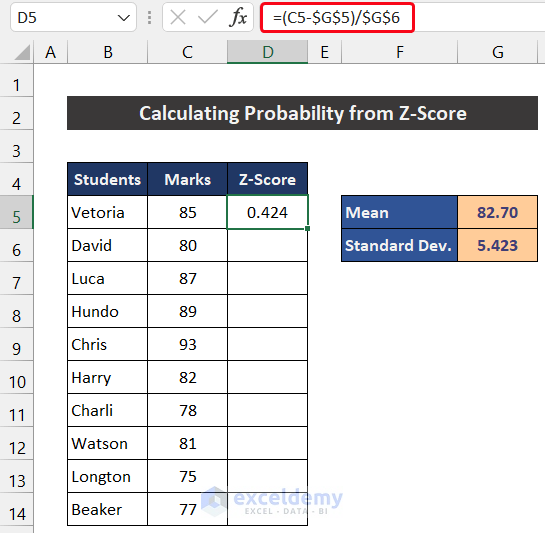
- Double-click on the Fill Handle icon to copy the formula down to cell D14.
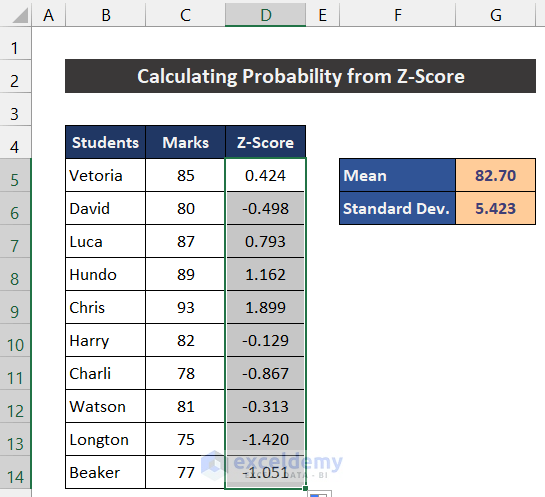
- You will get all the values of Z-Scores for the datasheet.
Step 4 – Calculate the Probability for Each Data Point
- Insert a Column between columns D and E.
- Rename the column as Probability.
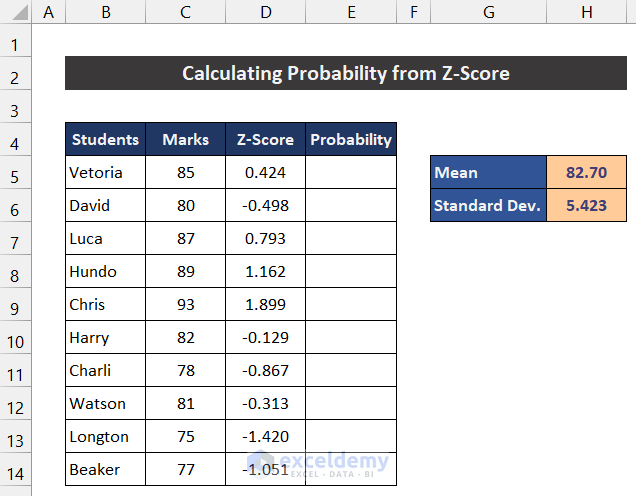
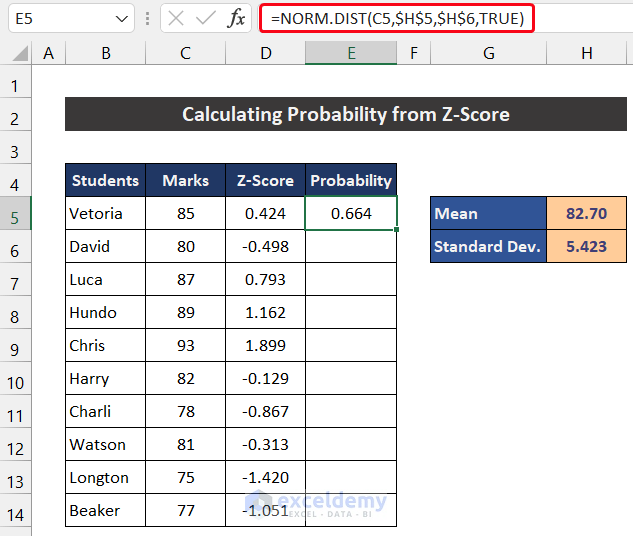
- Select cell E5 and insert the following formula for the cell:
=NORM.DIST(C5,$H$5,$H$6,TRUE)
- Press Enter.
- Double-click on the Fill Handle icon to copy the formula down to cell E14.
- You will get all the values of probability.
Interpretation of the Result
We are illustrating the result for cell E5. The value of probability is 0.664. The value means that the possibility of happening that event is 0.664 with respect to the total number of events.
Read More: How to Calculate P Value from Z Score in Excel
Download the Practice Workbook
Related Articles
- How to Calculate Critical Z Score in Excel
- How to Calculate Altman Z Score in Excel
- How to Calculate Z-Score with 95 Confidence Interval in Excel
<< Go Back to Statistical Significance in Excel | Excel for Statistics | Learn Excel
Get FREE Advanced Excel Exercises with Solutions!
