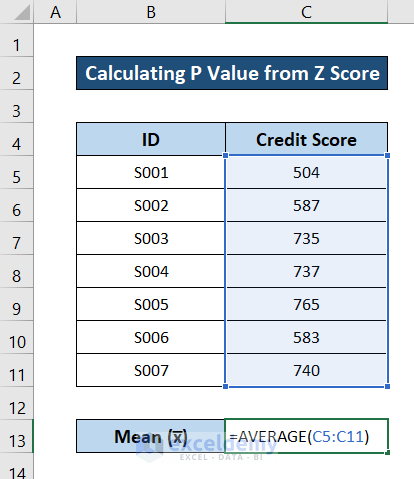
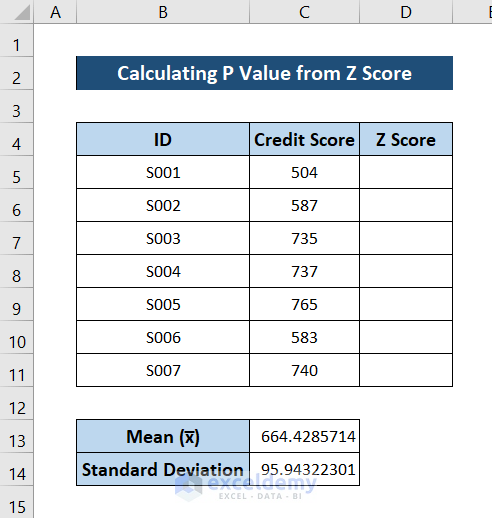
Method 1 – Calculate Mean of Dataset
- Select cell C13.
- Insert the following formula into the cell.
=AVERAGE(C5:C11)
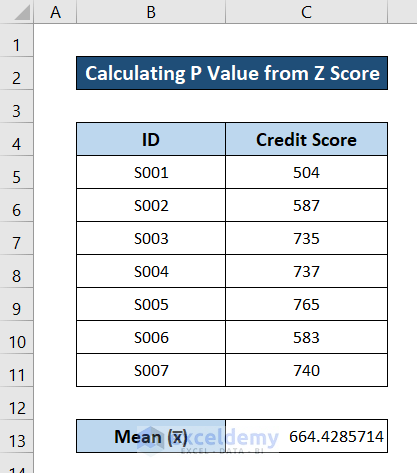
- Press Enter on your keyboard. You will have the mean of all the data.
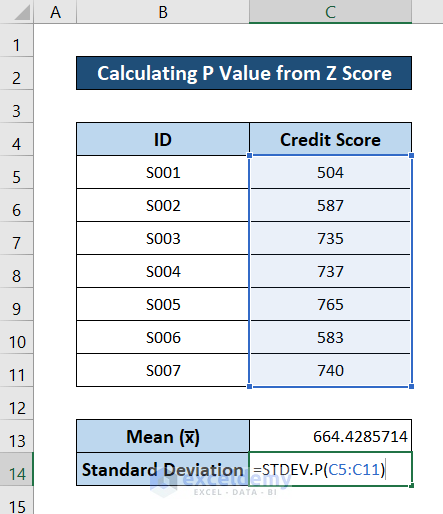
Method 2 – Estimate Standard Deviation
- To determine the standard deviation, select cell C14.
- Write down the following formula in the cell.
=STDEV.P(C5:C11)
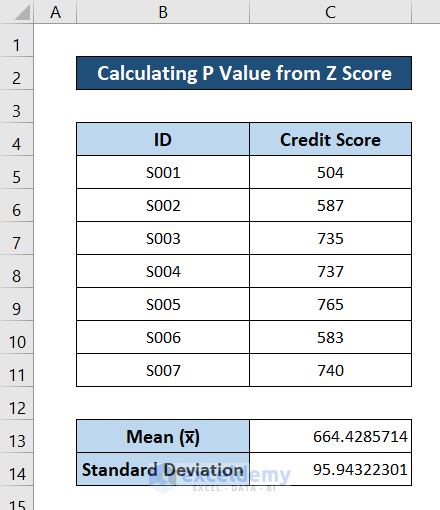
- Press Enter on your keyboard. You will now have the dataset’s standard deviation.
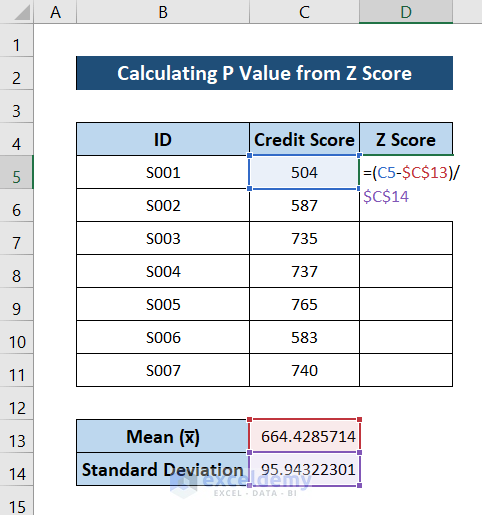
Method 3 – Evaluate Z Score
- Insert a column for the Z score.
- Select cell D5.
- Write down the following formula in the cell.
=(C5-$C$13)/$C$14
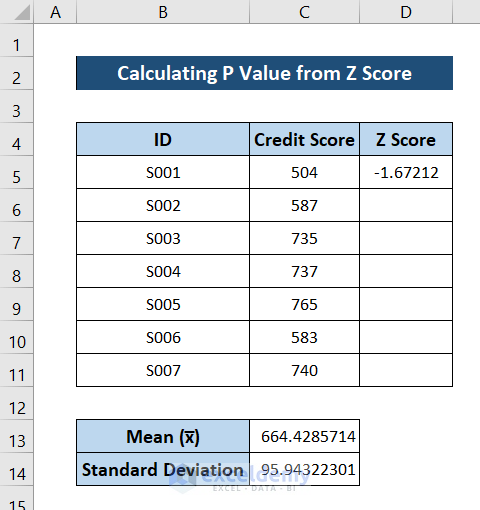
- Press Enter on your keyboard. You will now have the Z score for the first value in the dataset.
- Select the cell again and click and drag the fill handle icon to fill out the rest of the cells in the column with the formula.
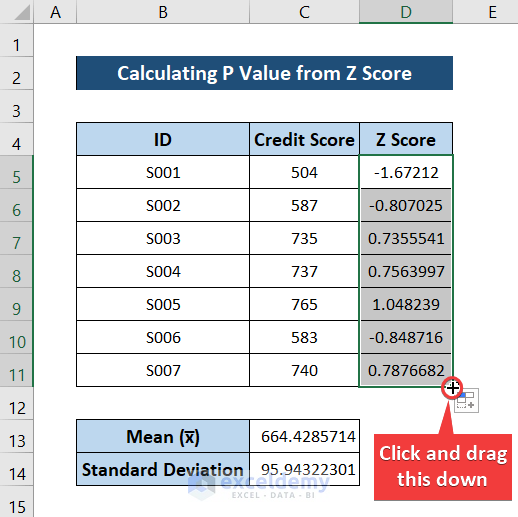
This way, you will have Z scores for all the dataset entries.
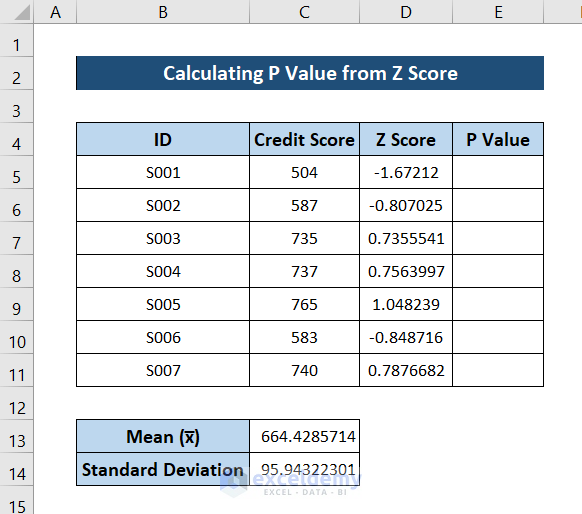
Method 4 – Calculate P Value from Z Score
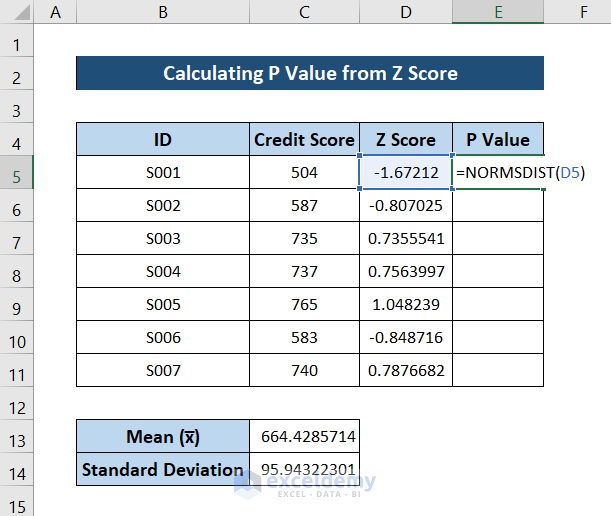
- Insert a column for the P values.
- Select cell E5.
- Write down the following formula in the cell.
=NORMSDIST(D5)
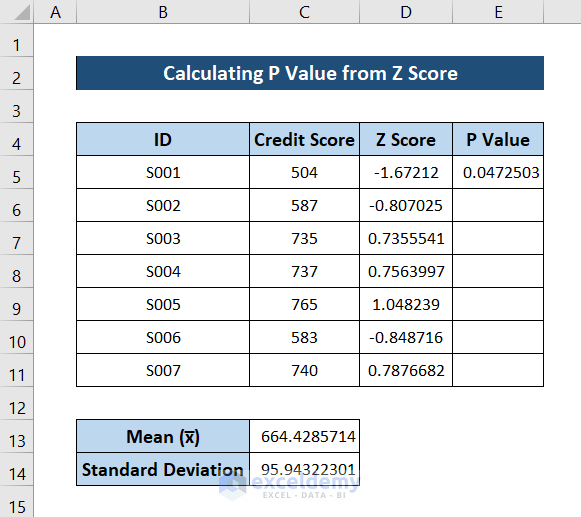
- Press Enter on your keyboard. You will have the P value for the first entry.
- Select the cell again. Click and drag the fill handle icon to the end of the column to fill the rest of the cells with the formula.
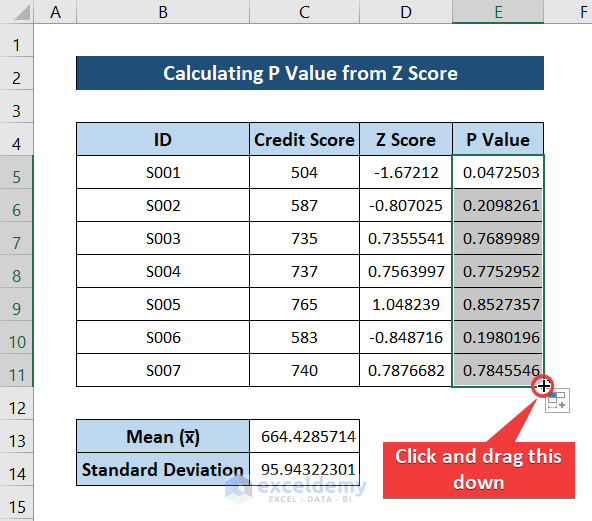
You will have the P values for all the entries.
Download Practice Workbook
Download the workbook used for this example from the link below. It contains the dataset and the result in different sheets. Try yourself while you go through the step-by-step process.
Related Articles
- How to Calculate Critical Z Score in Excel
- How to Calculate Altman Z Score in Excel
- How to Calculate Z-Score with 95 Confidence Interval in Excel
<< Go Back to Statistical Significance in Excel | Excel for Statistics | Learn Excel
Get FREE Advanced Excel Exercises with Solutions!
