Normal Probability Distribution is the single most important and most commonly used Probability Distribution in probability and statistics. It follows a bell-shaped density function, which can be easily created in Excel. So, what is the application of the normal probability distribution in Excel? Well, consider the following example and follow the article to find that out.
Suppose that a containment from samples of a city’s water supply has a mean of 500 ppm and a standard deviation of 100 ppm. What is the probability that bacteria in a randomly selected water sample will be less than 600 ppm, greater than 500 ppm, and between 350 ppm and 450 ppm? Follow the article to be able to solve it on your own.
What Is Normal Probability Distribution?
Probability is a mathematical concept that predicts the likelihood of the occurrence of an event during an experiment. A probability distribution, on the other hand, is a mathematical/statistical function that describes the likelihood of the occurrence of all possible events during that experiment. Of the few types, the normal probability distribution is the single most important and the most commonly used probability distribution in probability and statistics. The Normal Probability Distribution can be characterized by its Mean and Standard Deviation.
Abraham de Moivre, a French mathematician, introduced the normal probability distribution in 1733. It is also known as the Gaussian distribution.
How to Use Normal Probability Distribution in Excel: 3 Useful Cases
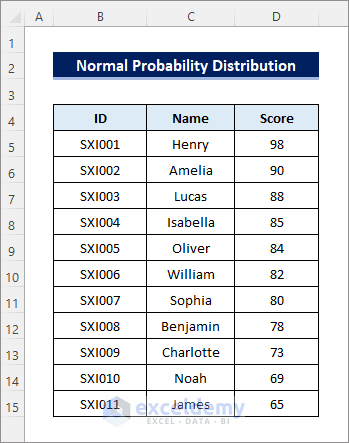
Assume you have the following dataset containing the test scores obtained by your students. Now you want to create a probability distribution curve to see how the scores are distributed, assuming a normal distribution.
Follow the steps below to be able to do that.
- First, you need to calculate the mean of the scores using the AVERAGE function as in the following formula in cell H4.
=AVERAGE(D5:D15)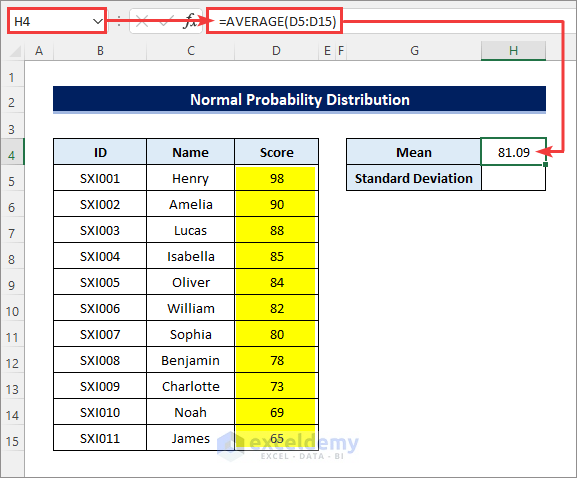
- Then, you need to calculate the standard deviation using the STDEV.P function as in the following formula in cell H5.
=STDEV.P(D5:D15)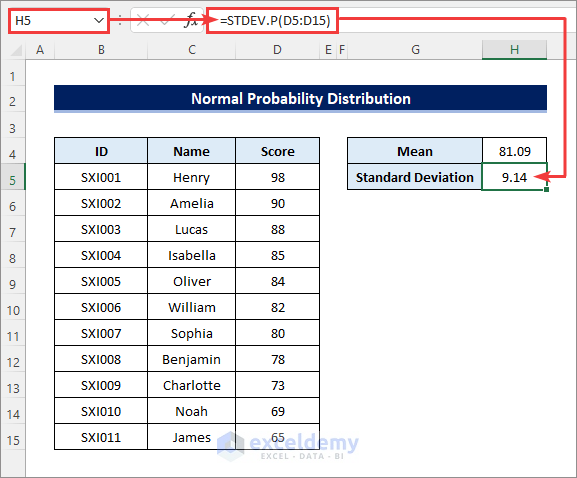
- Next, you need to calculate the probability density using the NORM.DIST function as in the following formula in cell E5. Drag the Fill Handle icon to copy the formula down.
=NORM.DIST(D5,$H$4,$H$5,FALSE)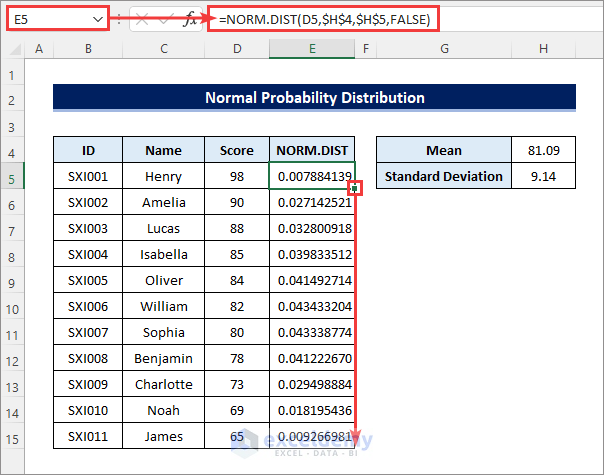
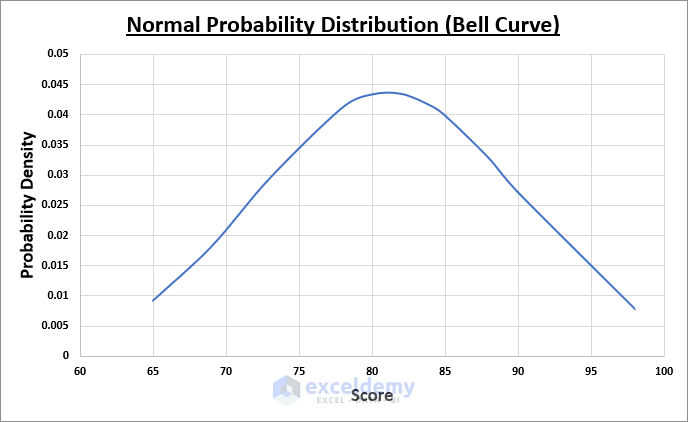
- Now select the range D4:E15 as shown below and go to Insert >> Insert Scatter (X, Y) or Bubble Chart >> Scatter with Smooth Lines to create the desired distribution curve.

- Finally, the following Bell Curve will be created.
Case 1: Probability of a Random Score Being Less Than
- Now suppose you picked a random score. What is the probability of it being less than 80? You can find that out by entering the following formula in cell H8 as shown below.
=NORM.DIST(H7,H4,H5,TRUE)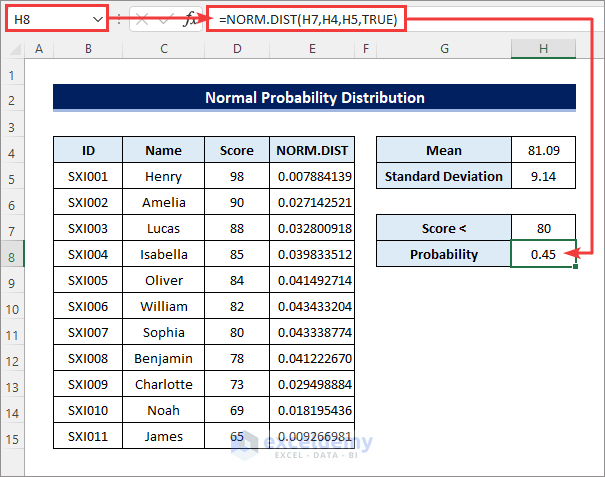
Read More: How to Calculate Probability Distribution in Excel
Case 2: Probability of a Random Score Being Greater Than
- Now, what is the probability of that random score being greater than 80? Well, you can just subtract the probability of it being less than that from 1 as shown in the following formula in cell H11.
=1-NORM.DIST(H10,H4,H5,TRUE)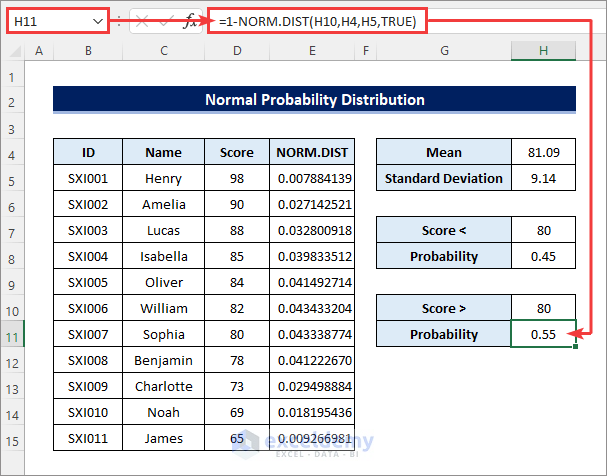
Read More: How to Use Continuous Probability Distribution in Excel
Case 3: Probability of a Random Score Being in Between
- Now, what is the probability of it being between 80 and 90? Well, you can find that out by subtracting the probability of it being less than 80 from the probability of it being less than 90 as shown in the following formula in cell H15.
=NORM.DIST(H14,H4,H5,TRUE)-NORM.DIST(H13,H4,H5,TRUE)
Read More: Exponential Probability Distribution in Excel
Things to Remember
- You must use absolute cell references for the Mean and Standard Deviation to avoid erroneous results.
- You need to use the NORMDIST function instead of the NORM.DIST function if you are not using Excel 2010 or later versions.
Download Practice Workbook
You can download the practice workbook from the download button below.
Conclusion
Now you know how to use the Normal Probability Distribution in Excel. Do you recall the water sample example at the beginning of this article? Did you figure it out? Please let us know in the comment section below. Don’t hesitate to reach out to us for further queries or suggestions. Stay with us and keep learning.
Related Articles
- How to Find Discrete Probability Distribution in Excel
- How to Calculate Variance of Probability Distribution in Excel
- Poisson Probability Distribution in Excel
- How to Model Uniform Probability Distribution in Excel
- How to Calculate Probability of Hypergeometric Distribution in Excel
- How to Find Standard Deviation of Probability Distribution in Excel
<< Go Back to Excel Probability Distribution | Excel Probability | Excel for Statistics | Learn Excel
Get FREE Advanced Excel Exercises with Solutions!
