The Poisson probability distribution is one of the most essential key factors in statistics to measure and visualize the probability of a particular event. In this article, I will show you 4 practical examples of the Poisson probability distribution in Excel.
What is Poisson Probability Distribution?
The Poisson probability distribution is the measurement of the probability of a particular event happening a specific number of times within a specified time or space range. You will have to know the mean of the given dataset and specify the number of events for which you want to calculate the probability to calculate the Poisson probability distribution. The formula would be:
Where,
λ = Mean or expected number of events.
x = Number of events for which we want to calculate probability.
Say, you are given a dataset of a factory’s production scenario. You have the data on the total production and the number of defective products on average. Now, you need to calculate the Poisson probability distribution of different numbers of defective products in Excel. Follow the article below carefully to learn about this whole process.
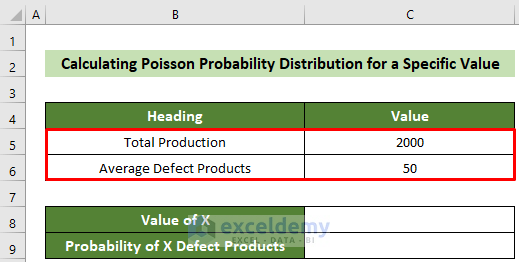
Example 1: Poisson Probability Distribution for a Specific Value
Say, you need to calculate the Poisson probability distribution for 40 defective products. Follow the steps below to do this.
📌 Steps:
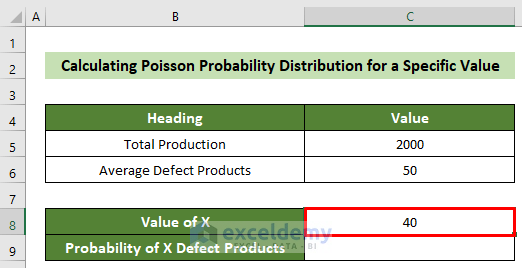
- First, click on cell C8 and insert the value (40 here) that you want to calculate the probability for.
- Afterward, click on cell C9 and insert the following formula.
=POISSON.DIST(C8,C6,FALSE)- Subsequently, press the Enter key.
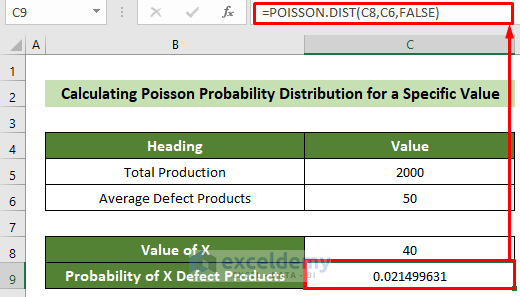
Thus, you will get the Poisson probability distribution for exactly 40 defective products in cell C9.
Read More: How to Calculate Probability Distribution in Excel
Example 2: Poisson Probability Distribution for Greater or Less Than a Specific Value
For Equal or Greater Than a Specific Value:
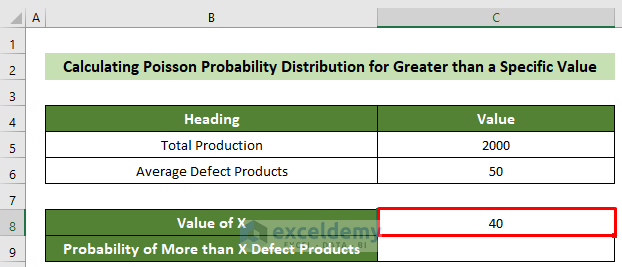
Now, say, you need to calculate the Poisson probability distribution for 40 or more than 40 defective products. Go through the steps below to accomplish this.
📌 Steps:
- At the very beginning, put your desired value limit (40 here) in cell C8.
- Following, click on cell C9 and insert the formula below.
=1-POISSON.DIST(C8,C6,TRUE)- Subsequently, hit the Enter key.
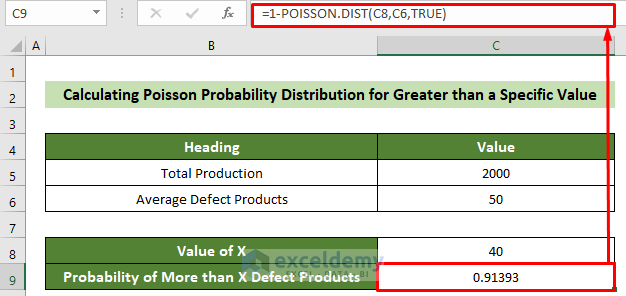
As a result, you will get the Poisson probability distribution for 40 or more than 40 defective products in accordance with the given dataset.
For Equal or Less Than Specific Value:
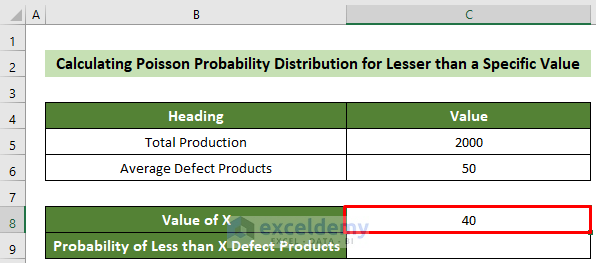
Now, if you want to calculate the Poisson probability distribution for equal or lesser than 40 defective products, follow the steps below.
📌 Steps:
- First, click on cell C8 and insert the specific value of your requirements (40 here).
- Afterward, click on cell C9 and insert the following formula.
=POISSON.DIST(C8,C6,TRUE)- Subsequently, hit the Enter key.
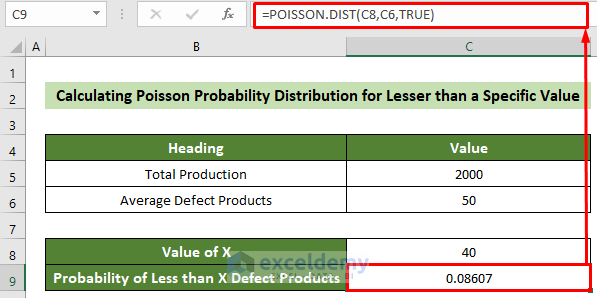
Consequently, you will get your desired result.
Read More: How to Find Standard Deviation of Probability Distribution in Excel
Example 3: Poisson Probability Distribution for a Range of Values
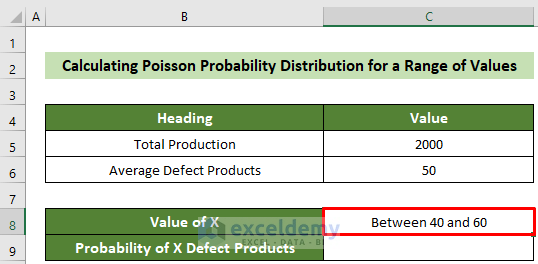
Besides, you might need to calculate the Poisson probability distribution for a particular range of values. Say, you need to calculate the answer for defective products between 40 and 60. Follow the steps below to do this.
📌 Steps:
- Initially, record your requirement in cell C8.
- Afterward, click on cell C9 and insert the following formula.
=POISSON.DIST(60,C6,TRUE)-POISSON.DIST(39,C6,TRUE)🔎 Formula Breakdown:
→ POISSON.DIST(60,C6,TRUE)
- This calculates the cumulative Poisson probability distribution for 60 or less than 60 defective products.
- Result: 0.9278
→ POISSON.DIST(39,C6,TRUE)
- This calculates the Poisson probability distribution for 39 or less than 39 defective products.
- Result:0.0646
→ POISSON.DIST(60,C6,TRUE)-POISSON.DIST(39,C6,TRUE)
- This subtracts the previous results and gives you the Poisson probability distribution for 40 to 60 defective products.
- Result:0.8633
- Finally, press the Enter key.

Thus, you will get the Poisson probability distribution for 40 to 60 defective products of the factory in cell C9.
Read More: How to Calculate Variance of Probability Distribution in Excel
Example 4: Poisson Probability Distribution for Percentage Values
Now, say you are not given the actual number of defective products. Rather, you are given the percentage of defective products in your production. You can also calculate the Poisson probability distribution from this dataset by following the steps below.
📌 Steps:
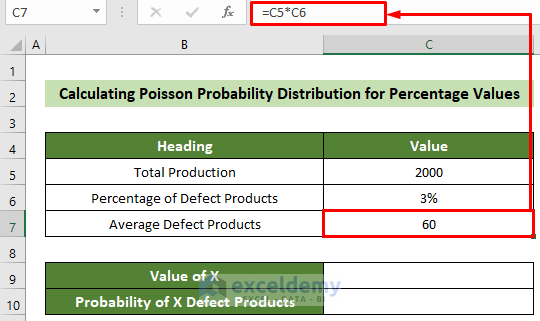
- First and foremost, click on cell C7 and insert the following formula to calculate the actual amount of average defective products.
=C5*C6- Subsequently, hit the Enter key.
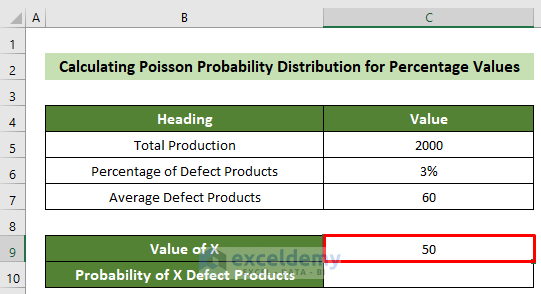
- Afterward, click on cell C9 and insert the value that you want to calculate the Poisson probability distribution for (50 here).
- Following, click on cell C10 and insert the formula below.
=POISSON.DIST(C9,C7,FALSE)- Subsequently, hit the Enter key.
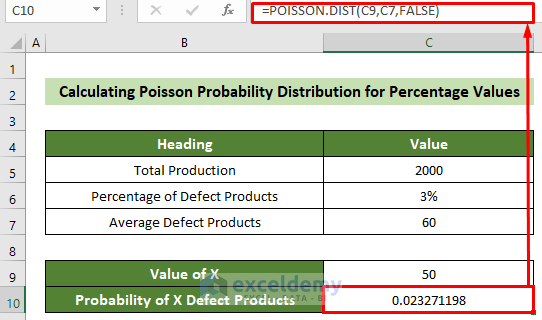
As a result, you will get the required Poisson probability distribution from the given percentage values.
Read More: Exponential Probability Distribution in Excel
💬 Things to Remember
- X can not be less than 0. If it is less than 0, the function will return #NUM! error.
- Similarly, if the mean value is less than 0, the function would return #NUM! error value.
- If the mean or X value is non-numeric, the function would return #VALUE! Error.
- If x is not an integer, it would be truncated.
Download Practice Workbook
You can download our practice workbook from here for free!
Conclusion
So, in this article, I have shown you 4 practical examples of calculating the Poisson probability distribution in Excel. You can also download our free workbook to practice. I hope you find this article helpful and informative. If you have any further queries or recommendations, please feel free to comment here. Have a nice day!
Thank you!
Related Articles
- How to Use Normal Probability Distribution in Excel
- How to Find Discrete Probability Distribution in Excel
- How to Model Uniform Probability Distribution in Excel
- How to Calculate Probability of Hypergeometric Distribution in Excel
- How to Use Continuous Probability Distribution in Excel
<< Go Back to Excel Probability Distribution | Excel Probability | Excel for Statistics | Learn Excel
Get FREE Advanced Excel Exercises with Solutions!
