Suppose the car tires of a certain company lasted for a mean of 40,000 km and had a standard deviation of 2,500 km. If you buy one tire from this company, what is the probability of it lasting between 38,000 km and 45,000 km? Can you solve it? It’s the direct role of the continuous probability distribution. Here, we’ll show the use of continuous probability distribution in Excel through 2 easy and relatable examples. After completing the article, you’ll be able to solve the above problem on your own.
What Is Continuous Probability Distribution?
A probability distribution where the value of the random variable x is unbounded (is continuous). The likelihood of x taking on any one particular value is zero because there are an unlimited number of possible values for it. As a result, we frequently use ranges of values (P(x>05) =.25). One illustration of a continuous distribution is the normal distribution. The integral (area under the curve) from a to b equals the chance that x lies between these two values (a and b).
The most common types of continuous distributions are as follows:
Of these two, the most popular and useful is the second one. It’s also called the Gaussian distribution.
How to Model Continuous Probability Distribution in Excel: 2 Examples
Here, we will show two examples of the use of continuous probability distribution in Excel. Follow the steps of every example to learn the procedures to calculate the continuous probability distribution in Excel. Moreover, I have added illustrations to make the procedures more understandable.
Example 01: Uniform Probability Distribution in Excel
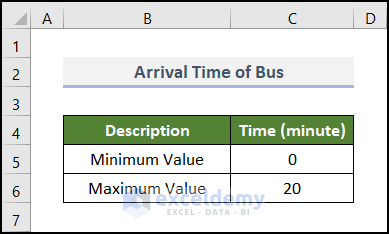
First, we’ll learn the uniform probability distribution in Excel. From the name, we can guess that it’s something that remains unchanged with time. Here, we are going to use the Arrival Time of Bus at a certain bus stand. This dataset includes the Description and Time in columns B and C respectively.
We’ll discuss the concept, usage, and features of uniform probability distributions considering the above dataset. Let’s go through the process below.
📌 Steps:
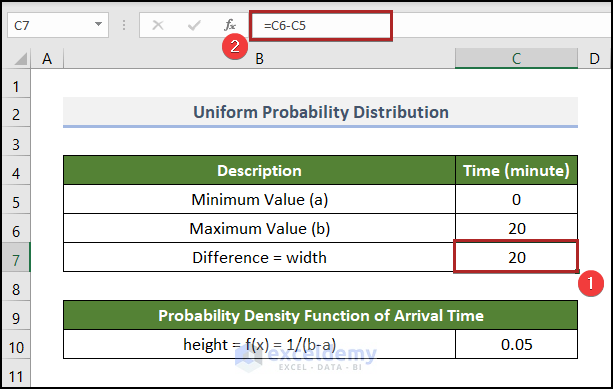
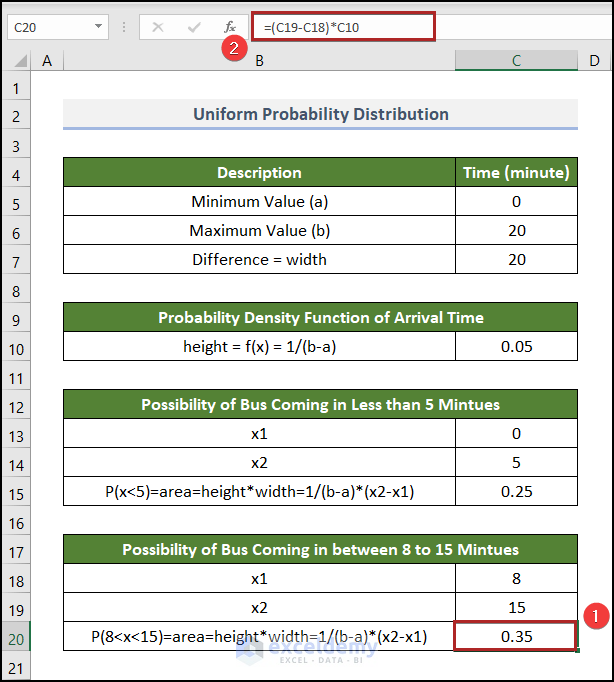
In the previous image, the minimum and maximum values indicate the arrival time of a bus. It actually means that a bus arrives after 20 (every) minutes at that particular bus stand all day long. Then, we denoted the Minimum Value and Maximum Value with a and b correspondingly. After that, we’re going to determine the Difference between them, which works as the width of the uniform probability distribution graph.
- So, select cell C7 and write down the formula below.
=C6-C5
- Then, press ENTER.
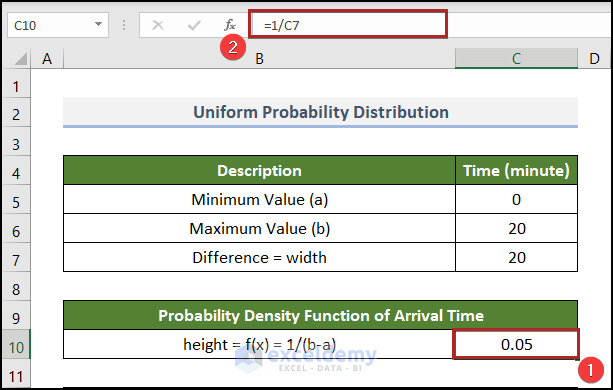
Another important factor in calculating the uniform probability distribution is the PDF, which means the probability density function. The generic formula to determine it is the following.
That means it’s actually the inverse of the Difference we calculated a little earlier.
To calculate this in Excel:
- Firstly, go to cell C10 and enter the following formula into the Formula Bar.
=1/C7
- Thus, hit the ENTER key.
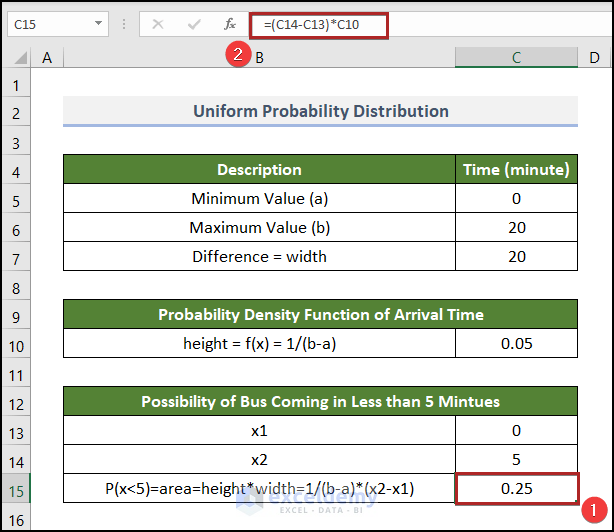
Let’s say you go to the bus stand. What is the probability that the bus will arrive in 5 minutes? How can you find out? Here comes the necessity of uniform probability distribution.
Take your arrival time of 0 minutes as x1 and your maximum waiting time of 5 minutes as x2. Also, write them in the B13:C14 range. See the image below.

The probability of the bus coming in 5 minutes equals the area on the graph with the determined height and width. So, the formula is given as follows:
To compute this in Excel:
- Initially, select cell C15 and insert the following formula.
=(C14-C13)*C10
- As usual, press ENTER.
You can also determine the probability of the coming between 8 and 15 minutes.
- Firstly, enter the parameters in the worksheet like below.

- Following this, move to cell C20 and paste the formula into that cell.
=(C19-C18)*C10
- As always, tap ENTER.
Read More: Exponential Probability Distribution in Excel
Example 02: Normal Probability Distribution in Excel
The normal probability distribution is the single most important and most commonly used probability distribution in probability and statistics. It follows a bell-shaped density function, which can be easily created in Excel. So, what is the application of the normal probability distribution in Excel? Well, consider the following dataset and follow the steps to find that out.
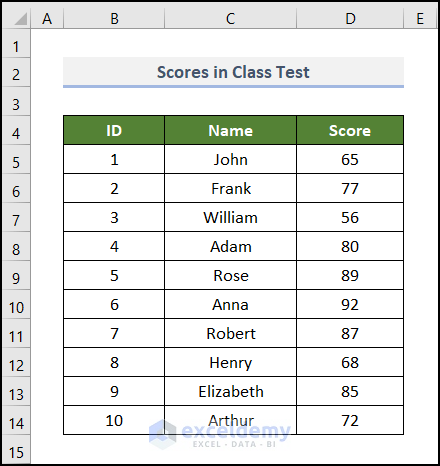
Here, we have a list of Scores in Class Test of a particular section in a certain institution. This dataset concludes the ID, Name, and corresponding Scores in columns B, C, and D respectively.
📌 Steps:
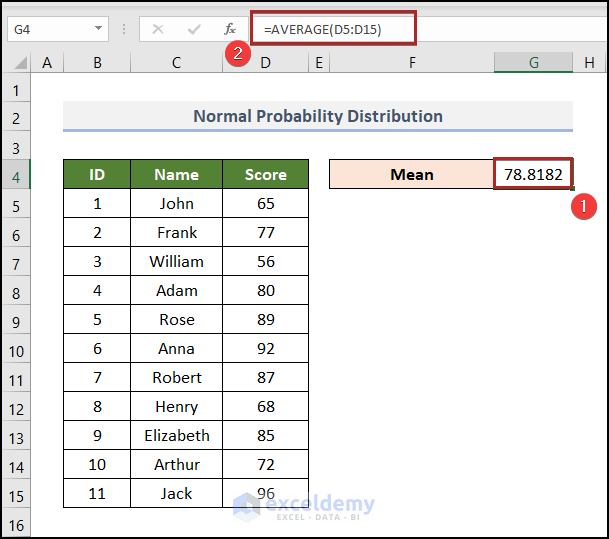
To get the normal probability distribution, we’ve to calculate the mean and standard deviation first.
- Primarily, select cell G4 and enter the formula below.
=AVERAGE(D5:D15)
Here, the AVERAGE function returns the arithmetic average value of numbers in the D5:D15 range.
- Hence, tap ENTER.
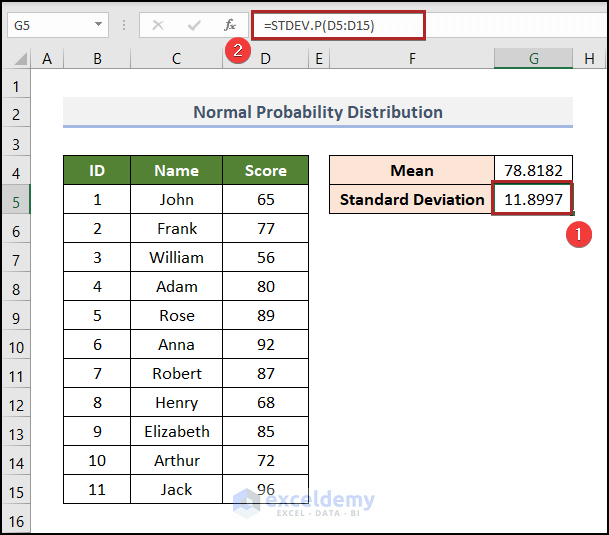
- Secondarily, go to cell G5 and put in the following formula.
=STDEV.P(D5:D15)
The STDEV.P function is a statistical function. It helps us to calculate the standard deviation utilizing the total population provided as parameters.
- Following this, hit ENTER.
At this time, we’ll compute the normal distribution for each x value.
- So, go to cell E5 and paste the formula below.
=NORM.DIST(D5,$H$4,$H$5,FALSE)
The NORM.DIST function is also a statistical function that has an extremely broad range of applications in different sectors. This function gives us back a normal distribution for the given mean and standard deviation.
- Later, press the ENTER key.

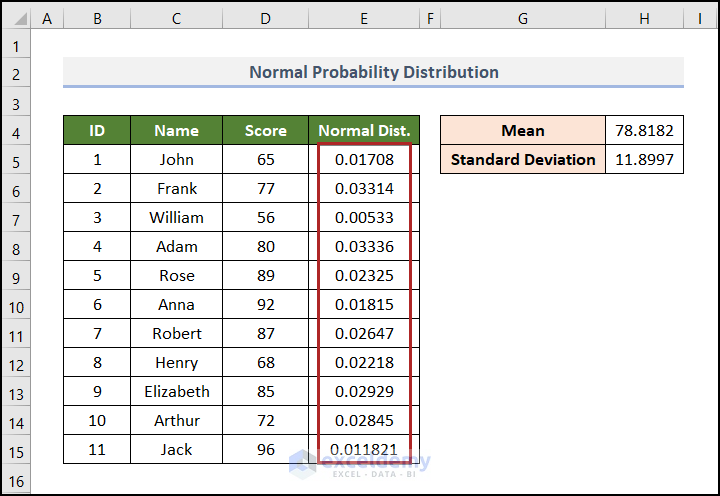
- Now, bring the cursor to the right-bottom corner of cell E5 and it will look like a plus (+) sign. It’s the Fill Handle tool. Then, double-click on it.
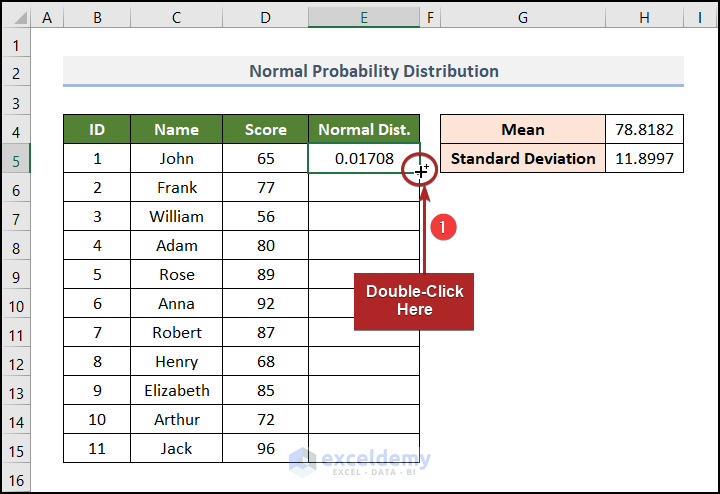
Immediately, all the following cells get the desired results.
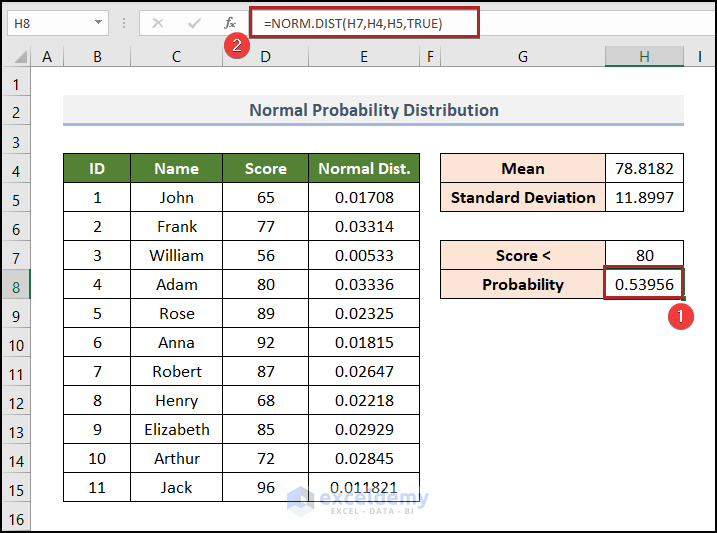
Now, suppose you picked a random score. What is the probability of it being less than 80? You can find that out by entering the following formula in cell H8 as shown below.
=NORM.DIST(H7,H4,H5,TRUE)
- Simply, press ENTER.
Now, what is the probability of that random score being greater than 80? Well, you can just subtract the probability of it being less than that from 1 as shown in the following formula in cell H11.
=1-NORM.DIST(H10,H4,H5,TRUE)
- After inserting the formula, press ENTER.

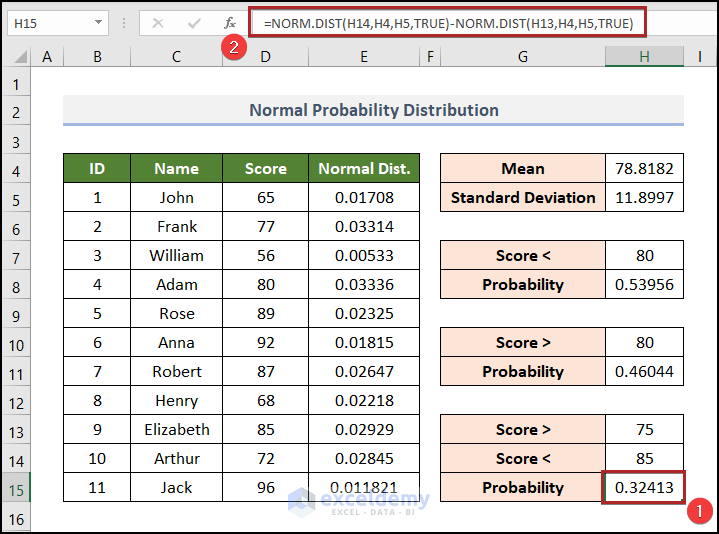
Now, what is the probability of it being between 75 and 85? Well, you can find that out by subtracting the probability of it being less than 75 from the probability of it being less than 85 as shown in the following formula in cell H15.
=NORM.DIST(H14,H4,H5,TRUE)-NORM.DIST(H13,H4,H5,TRUE)
- Equivalently, press ENTER.
Read More: How to Calculate Probability Distribution in Excel
Continuous Probability Distribution vs Discrete Probability Distribution
A variable is referred to as a “continuous variable” if it can have any value between two predetermined values; otherwise, it is referred to as a discrete variable. In the continuous probability distribution, a variable can take one of an infinite number of values. But in the case of discrete probability distributions, a variable can be assumed to have one of the finite numbers of values. Let’s look at the two examples below to understand them better.
- Let’s assume, students of a class weigh between 45 and 70 kgs. The weight of a particular boy can be any number between these two upper and lower limits. It could be an integer or could be a float number. It can take any value from an infinite range of values. So, it’s an example of a continuous variable and its probability will be called the continuous probability distribution.
- On the other hand, if you throw a die, it could be any number among 1, 2, 3, 4, 5, or 6. So, the result will be from a finite number of values. It’s called a discrete variable and this kind of probability takes the term discrete probability distribution.
In a continuous probability distribution, we cannot determine the probability of the exact x value. Rather, we need to find out the probability between two x values. However, in the discrete probability distribution, we can find the probability for the exact x value.
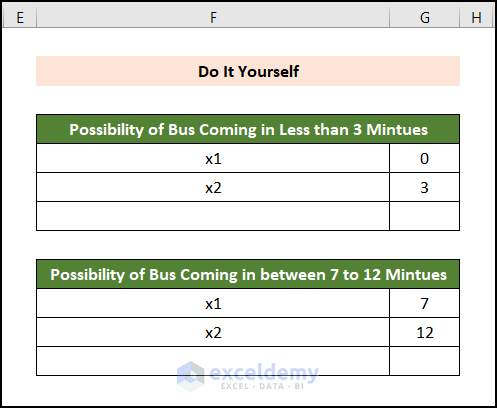
Practice Section
For doing practice by yourself we have provided a Practice section like the one below in each sheet on the right side. Please do it by yourself.
You may download the following Excel workbook for better understanding and practice yourself.
Conclusion
This article explains how to use a continuous probability distribution in Excel in a simple and concise manner. Don’t forget to download the Practice file. Thank you for reading this article. We hope this was helpful. Please let us know in the comment section if you have any queries or suggestions.
Related Articles
- How to Find Discrete Probability Distribution in Excel
- How to Calculate Variance of Probability Distribution in Excel
- Poisson Probability Distribution in Excel
- How to Calculate Probability of Hypergeometric Distribution in Excel
- How to Find Standard Deviation of Probability Distribution in Excel
<< Go Back to Excel Probability Distribution | Excel Probability | Excel for Statistics | Learn Excel
Get FREE Advanced Excel Exercises with Solutions!
