Looking for ways to model uniform probability distribution in Excel? Then, this is the right place for you. Here, you will find 3 suitable ways to model uniform probability distribution in Excel.
What Is Uniform Probability Distribution?
Uniform Probability Distribution is a type of distribution where the probability of all the events in the distribution is almost equal. If we try to plot a graph using the value of probability for this kind of distribution, we will get a rectangular form that represents the equality between the probability values.
How to Model Uniform Probability Distribution in Excel: 3 Effective Ways
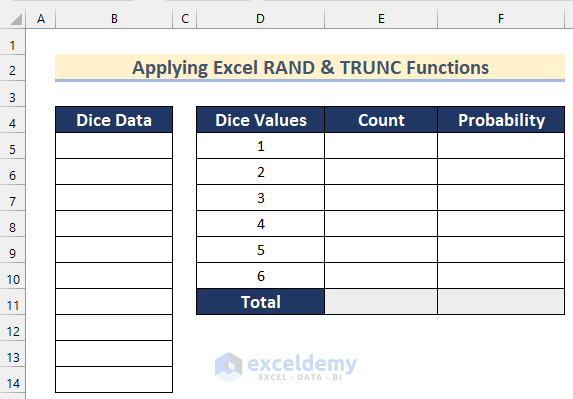
Here, we will show you 3 different ways to model Uniform Probability Distribution in Excel. Suppose, we have a dataset containing the Dice Values from 1 to 6. Now, we will model a Uniform Probability Distribution using random values.
1. Apply Excel RAND & TRUNC Functions to Model Uniform Probability Distribution
In the first method, we will use the RAND and TRUNC functions to generate random data to model a Uniform Probability Distribution in Excel.
Here are the steps.
Steps:
- Firstly, select Cell B5 and insert the following formula.
=TRUNC(RAND()*6+1)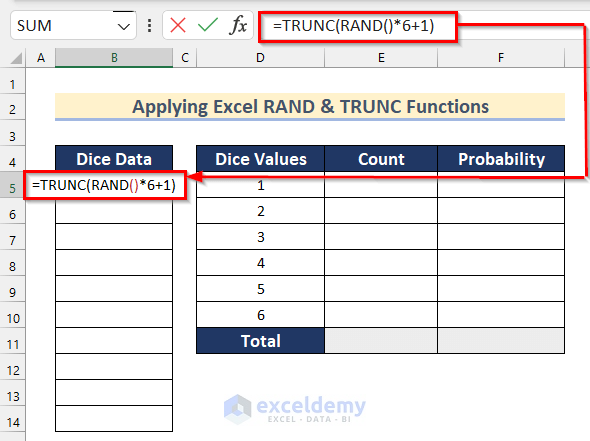
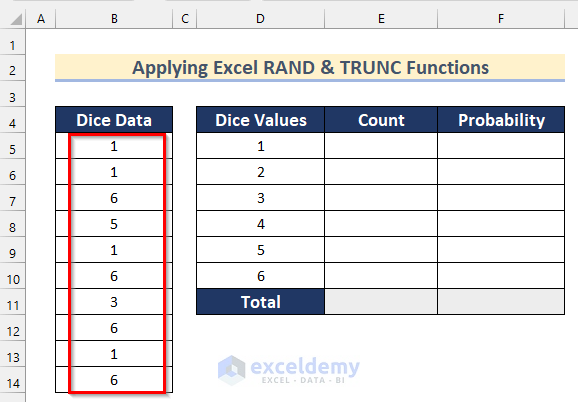
- After that, drag down the Fill Handle tool to AutoFill the formula for the rest of the cells.

- Thus, some random data will be created from 1 to 6.
- Then, select Cell E5 and insert the following formula.
=COUNTIF(B5:B14,D5:D10)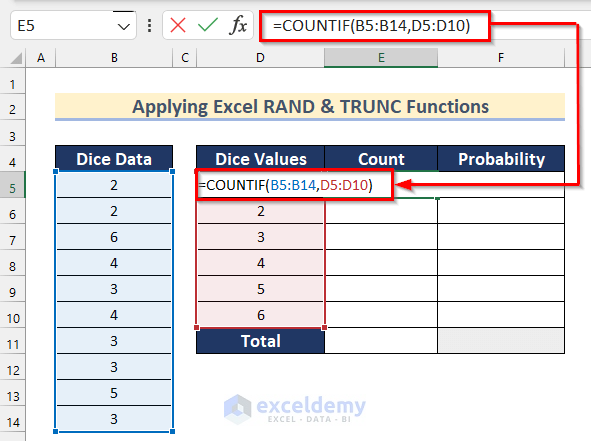
- Next, press Enter to get all the Count values.

- Next, select Cell E11 and insert the following formula.
=SUM(E5#)
- After that, press Enter.

- Further, select Cell F5 and insert the following formula.
=E5/$E$11
- Then, press Enter and drag down the Fill Handle tool to AutoFill the formula for the rest of the cells.

- Finally, you will get all the Probability values for each Dice value.

- Next, select Cell F11 and insert the following formula.
=SUM(F5:F10)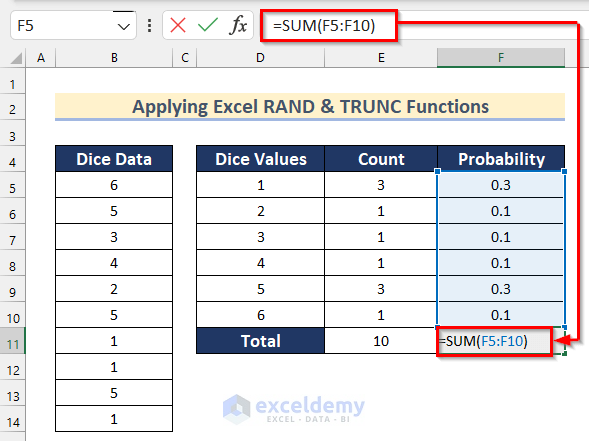
- Then, press Enter.

Read More: How to Calculate Probability Distribution in Excel
2. Illustrate Uniform Probability Distribution Using RANDBETWEEN Function
You can also use the RANDBETWEEN function to illustrate a Uniform Probability Distribution. Now, we will create some random data between 1 to 6 using this function to model Uniform Probability Distribution.
Follow the steps given below to do it on your own.
Steps:
- To start with, select Cell B5 and insert the following formula.
=RANDBETWEEN(1,6)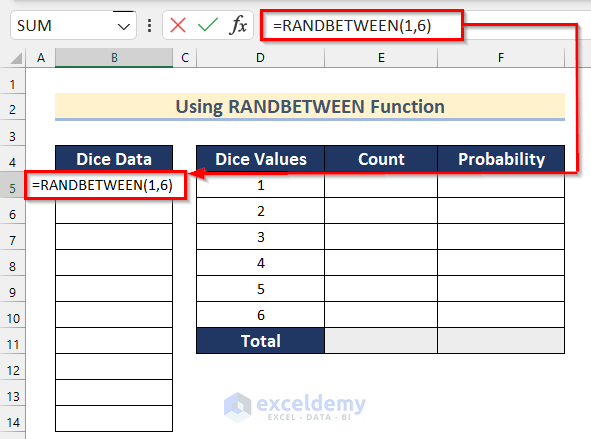
- Then, drag down the Fill Handle tool to AutoFill the formula for the rest of the cells.

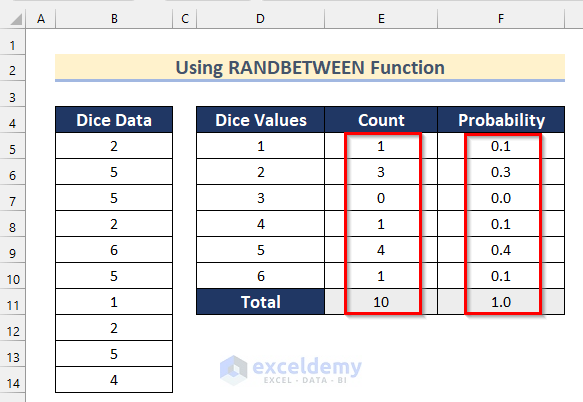
- Thus, you can create some random data using the RANDBETWEEN function.

- Finally, model a Uniform Probability Distribution going through the same steps shown above.
Read More: How to Use Continuous Probability Distribution in Excel
3. Insert Simple Formula to Get Probability in Uniform Distribution in Excel
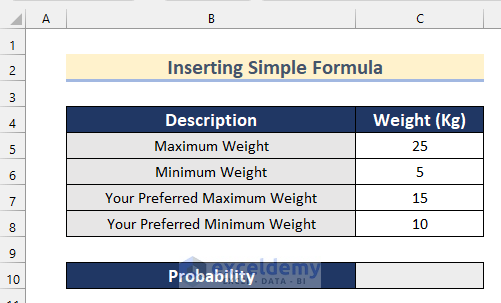
In the last method, we will show you how you can get the probability of some specific data in a Uniform Distribution by inserting a simple formula. Suppose you have some parcel having a uniformly distributed weight from 5kg to 25kg. Now, you want to know the probability of parcels having 10kg to 15kg weight in that distribution. You can solve this problem by going through the steps given below.
Steps:
- Firstly, select Cell C10 and insert the following formula.
=(C7-C8)/(C5-C6)
- Then, press Enter to get the probability.

Read More: How to Calculate Variance of Probability Distribution in Excel
Practice Section
In the article, you will find an Excel workbook like the image given below to practice on your own.

Download Practice Workbook
You can download the workbook to practice yourself.
Conclusion
So, in this article, we have shown you 3 ways to model uniform probability distribution in Excel. I hope you found this article interesting and helpful. If something seems difficult to understand, please leave a comment. Please let us know if there are any more alternatives that we may have missed. Thank you!
Related Articles
- How to Use Normal Probability Distribution in Excel
- How to Find Discrete Probability Distribution in Excel
- Exponential Probability Distribution in Excel
- Poisson Probability Distribution in Excel
- How to Calculate Probability of Hypergeometric Distribution in Excel
- How to Find Standard Deviation of Probability Distribution in Excel
<< Go Back to Excel Probability Distribution | Excel Probability | Excel for Statistics | Learn Excel
Get FREE Advanced Excel Exercises with Solutions!
