You have come to the right place if you are looking for the answer or some unique tips to calculate Probability Distribution in Excel. There are some quick steps to calculate Probability Distribution in Excel. This article will walk you through each and every step with appropriate examples. As a result, you can use them easily for your purpose. Let’s move on to the article’s main discussion.
What Is Probability Distribution?
The term Probability Distribution is in general a representation of the Frequency Distribution of a specific data series. It illustrates the possibility of certain trials under specific conditions among the variable values. The basic rule of the probability distribution is the probability of a value, the higher the frequency is, and vice versa.
Probability Distribution can be shown with or without a graph based on the function used. It is a very useful Excel feature to project population, performance, climatic forecast, business proposition, etc.
How to Calculate Probability Distribution in Excel: with Easy Steps
In this section, I will show you the quick and easy steps to calculate Probability Distribution in Excel on the Windows operating system. This article contains detailed explanations with clear illustrations for everything. I have used the Microsoft 365 version here. However, you may use any other version depending on your availability. Please leave a comment if any part of this article does not work in your version.
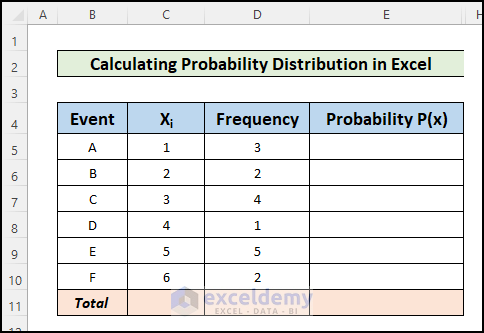
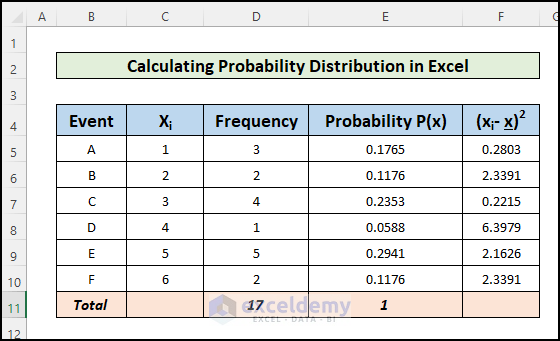
📌 Step 1: Create a Dataset
First, you have to create a dataset including events occurring, the Frequency of each event (xi), and a column to get the probability of each event P(x).
- Then, calculate the sum of the frequency of the events. For this, insert the following formula using the SUM function in cell D11:
=SUM(D5:D10)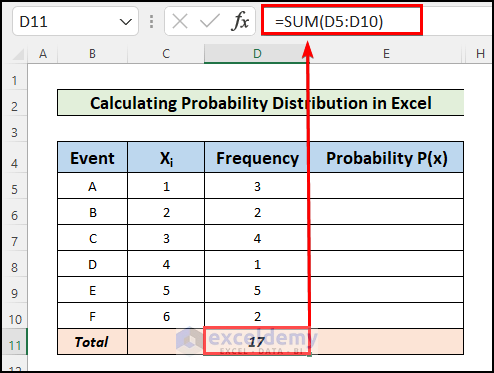
Read More: How to Calculate Variance of Probability Distribution in Excel
📌 Step 2: Calculate Probability P(x) for Each Event
After that, you will calculate the probability of each event in the dataset. You have to divide the frequency by the total of the events occurring to get the probability value.
- For this, use the following formula in cell E5:
=D5/$D$11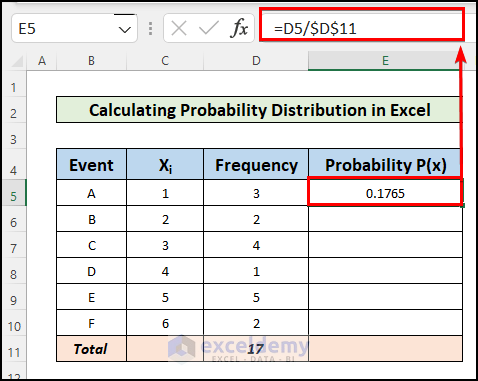
- Now, drag the Fill Handle icon to paste the used formula to the other cells of the column or use Excel keyboard shortcuts Ctrl+C and Ctrl+V to copy and paste.
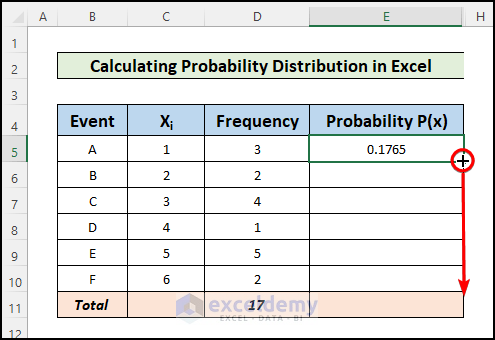
- Now, calculate the total of the probability values, which will be 1.
Read More: How to Find Discrete Probability Distribution in Excel
📌 Step 3: Calculate Mean of Probability Distribution in Excel
Now, you will use the following formula to get the Mean value from the probability distribution value.
![]()
- For this, you can use the SUMPRODUCT function to multiply the Xi value with the P(x) value and to find the summation of those multiplications.
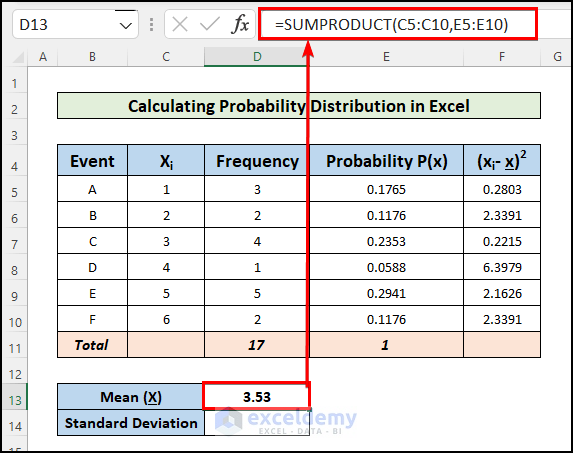
- Thus, you have calculated the mean value from the probability distribution in Excel. ‘
Read More: Exponential Probability Distribution in Excel
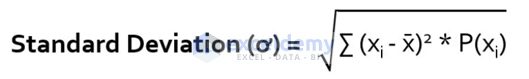
📌 Step 4: Calculate Standard Deviation Probability Distribution in Excel
Then you have to calculate the Standard Deviation from the probability distribution in Excel. The formula for the Standard Deviation of the Probability Distribution is:
- For this, first, insert the following formula in cell F5,
=(D5-$D$13)^2
- Then, drag the Fill Handle icon to apply the same formula to the other cells.
- Now, multiply the values of the D and F columns. Insert the following formula in cell G5, and then Autofill the column:
=(D5-$D$13)^2
- Finally, to get the standard deviation, you have to square-root the sum total of the values of Column G. For this, insert the following formula in cell D14:
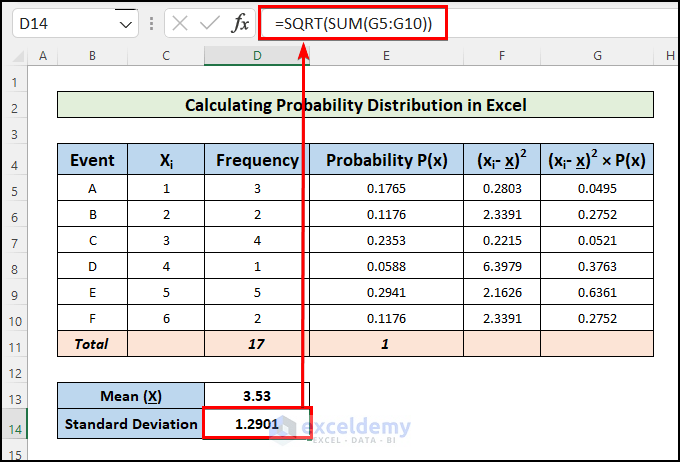 Thus, you have calculated the standard deviation from the probability data.
Read More: How to Find Standard Deviation of Probability Distribution in Excel
How to Calculate Normal Probability Distribution in Excel
Probability is a mathematical concept that predicts the likelihood of the occurrence of an event during an experiment. A probability distribution, on the other hand, is a mathematical/statistical function that describes the likelihood of the occurrence of all possible events during that experiment. Of the few types, the normal probability distribution is the single most important and the most commonly used probability distribution in probability and statistics. The Normal Probability Distribution can be characterized by its Mean and Standard Deviation.
- First, prepare a dataset with the information of 10 students’ names and their grades.
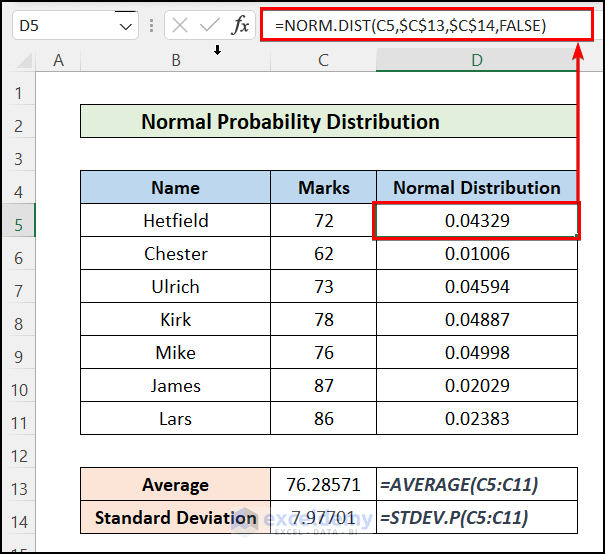
- Then, insert the following formula using the AVERAGE function in cell C13:
=AVERAGE(C5:C11)- After this, insert the following formula using the STDEV.S function in cell C14.
=STDEV.S(C5:D11)
- At this stage, use the NORM.DIST function to calculate the Normal Distribution for Mean and Standard Deviation in cell D5.
=NORM.DIST(D5,$E$5,$F$5,FALSE)- Then, drag the fill handle to autofill the column.
Now, you have to plot the Normal Distribution graph.
- First, you have to sort the Grade and Normal Distribution values from smallest to largest from the Sort & Filter section in the Home
- Then, insert a Scatter Chart and select the Marks column as the X-axis data and the Normal Distribution column as the Y-axis
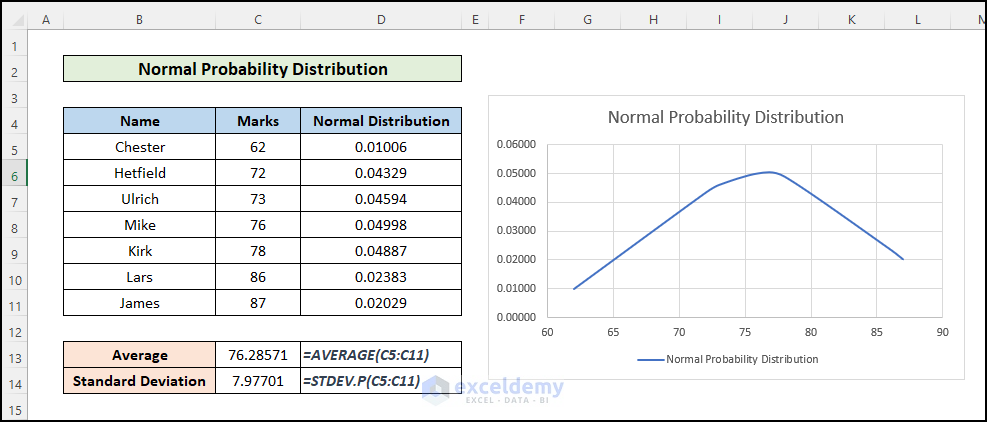
- Thus, you have created the Normal Distribution curve for your dataset.
Read More: How to Use Normal Probability Distribution in Excel
Download Practice Workbook
You can download the practice workbook from here:
Conclusion
In this article, you have learned how to calculate Probability Distribution in Excel. I hope you found this article helpful. Please leave comments, suggestions, or queries if you have any in the comment section below.
Related Articles
- Poisson Probability Distribution in Excel
- How to Model Uniform Probability Distribution in Excel
- How to Calculate Probability of Hypergeometric Distribution in Excel
- How to Use Continuous Probability Distribution in Excel
<< Go Back to Excel Probability Distribution | Excel Probability | Excel for Statistics | Learn Excel
Get FREE Advanced Excel Exercises with Solutions!
