In this article, you will learn about two easy examples of exponential probability distribution in Excel. We will be using the Microsoft 365 version. However, you can use any version of Microsoft Excel from 2010 and follow this tutorial.
Exponential Probability Distribution
We use the term “exponential” to describe increases that happen quickly. A particular event’s occurrence time is connected to the exponential distribution. We mostly use this to determine a product’s lifespan or dependability. The number of infections during the most recent pandemic is distributed exponentially. There are two equations for this probability distribution:
- The first equation for the “probability density function”
- We can get point values on the graph by using this formula.
- Here, x is the value of the function and λ is the rate parameter. We can get this value by dividing the mean time by 1.

- When the rate parameter (lambda) is 0.5 then the graph will look like this.

- The second equation for the “cumulative distribution function”
- Using this formula, we can get the area under the graph.

- Again, the chart will look like this for a rate parameter (lambda) of 0.5.

How to Perform Exponential Probability Distribution in Excel: 2 Suitable Examples
There will be two examples for this article. In the first example, we will find the probability density function. Then, we will plot the distribution. Afterward, we will calculate the probability using the cumulative distribution function. For this, we will use the EXPON.DIST function in Excel.
1. Finding Distribution Properties
We will find the probability density function and then plot that in this first example. Inside the EXPON.DIST function, we will set the third argument to false. This will cause that function to return the probability density function. Next, we will state our problem. Moreover, we will use the EXP function.
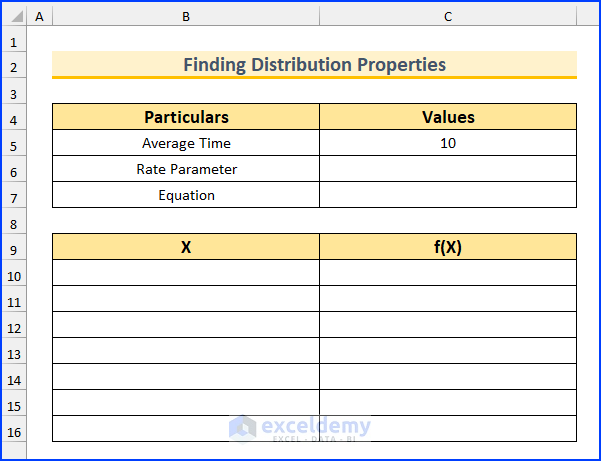
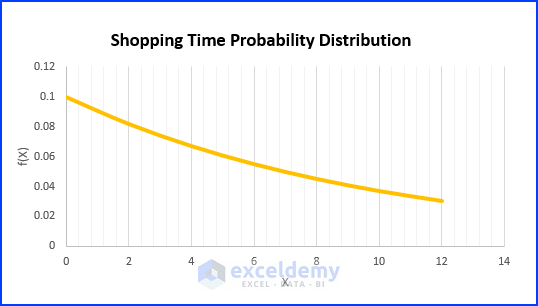
The shopping time in a grocery store can be fitted into an exponential distribution. Additionally, the average shopping time is 10 minutes. Our task is to find these –
- Type the formula for this distribution
- Plot the distribution
Steps:
- Firstly, create the following sections in Excel.
- Afterward, type this formula to find the rate parameter.
=1/C5

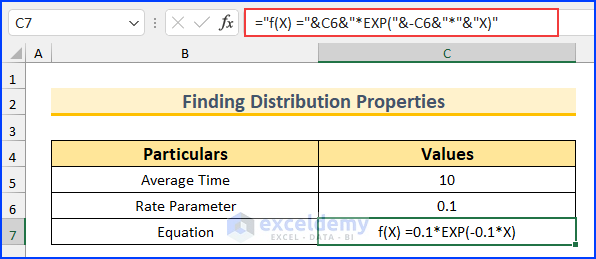
- Then, insert this formula to display the distribution equation.
="f(X) ="&C6&"*EXP("&-C6&"*"&"X)"
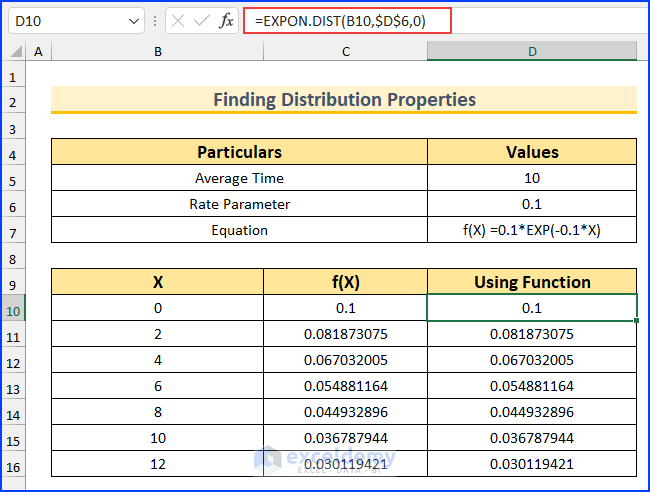
- After that, type this formula to return the value of f(X).
=$C$6*EXP(-$C$6*B10)

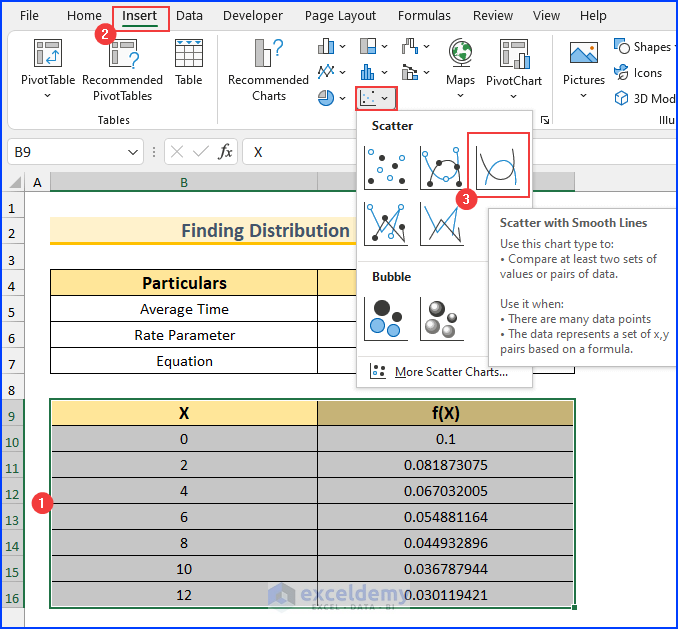
- Next, select the cell range B9:C16.
- Then, from the Insert tab → Insert Scatter (X,Y) or Bubble Chart → select Scatter with Smooth Lines.
- So, the default chart will look like this.
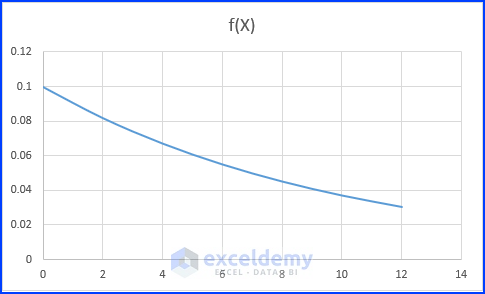
- We can adjust some options to make the chart better.
- Moreover, you can also use this formula to find the value of f(X).
=EXPON.DIST(B10,$D$6,0)
Read More: How to Calculate Probability Distribution in Excel
2. Calculating Probability of Exponential Distribution
We will find the probability of a certain condition in this second example. Inside the EXPON.DIST function, we will set the third argument to true. This will cause that function to return the cumulative distribution function. Moreover, we will use a modified version of the first problem for this section.
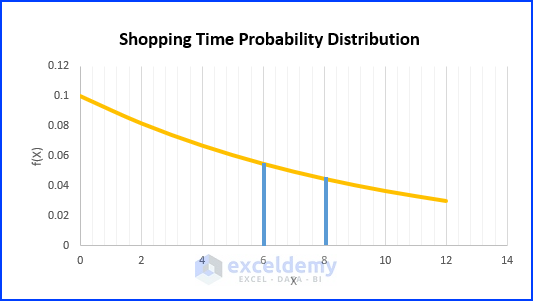
The shopping time in a grocery store can be fitted into an exponential distribution. Additionally, the average shopping time is 10 minutes. Our task is to determine the likelihood of a salesperson spending 6 to 8 minutes with a randomly chosen customer.
Steps:
- To begin with, this graph shows the region that we need to calculate.
- Then, type the conditions.
- Afterward, find the probability using the following formula.
=1-EXP(-C6*8)

- Then, insert another formula to return the probability of less than 6.
=1-EXP(-C6*6)

- Finally, use this formula to calculate the goal of this example.
=C10-C11

- We can see that the value is approximately 10%. So, there is a 10% chance that the salesperson will spend 6 to 8 minutes with a randomly picked customer.
Read More: How to Find Standard Deviation of Probability Distribution in Excel
Download Practice Workbook
You can download the Excel file from the link below.
Conclusion
We have shown you two easy examples of how to work with the exponential probability distribution in Excel. If you face any problems regarding these methods or have any feedback for me, feel free to comment below.
However, remember that our website implements comment moderation. Therefore, your comments may not be instantly visible. So, have a little bit of patience, and we will solve your query as soon as possible.
Related Articles
- How to Use Normal Probability Distribution in Excel
- How to Find Discrete Probability Distribution in Excel
- How to Calculate Variance of Probability Distribution in Excel
- Poisson Probability Distribution in Excel
- How to Model Uniform Probability Distribution in Excel
- How to Calculate Probability of Hypergeometric Distribution in Excel
- How to Use Continuous Probability Distribution in Excel
<< Go Back to Excel Probability Distribution | Excel Probability | Excel for Statistics | Learn Excel
Get FREE Advanced Excel Exercises with Solutions!
