If you have a hypergeometric distribution problem and you are looking for a way to calculate the probability, then this article will be beneficial to you. The focus of this article is to explain how to calculate the probability of hypergeometric distribution in Excel.
Formula for Probability of Hypergeometric Distribution
Hypergeometric Distribution generally refers to a Discrete Probability Distribution. It mainly describes the probability of success in a draw. The formula for the probability of Hypergeometric Distribution is,
Here,
K = Number of Successes in Population
N = Population Size
k = Number of Successes in Sample (Observed Successes)
n = Sample Size (Number of Draws)
Now, KCk is the combination of k things drawn from K things. The formula for combination is,
The same formula can be used to find other combinations.
How to Calculate Probability of Hypergeometric Distribution in Excel: 2 Simple Ways
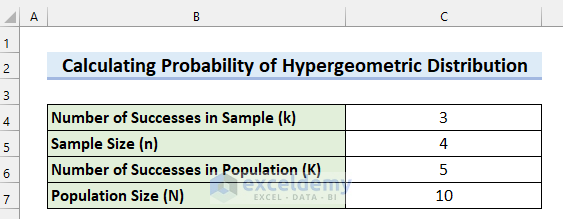
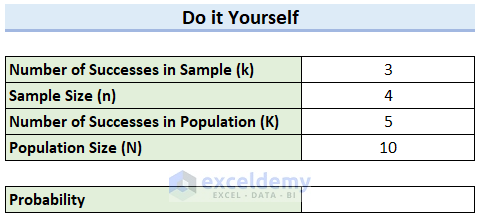
Suppose, you have 10 flags in a box. 5 of the flags are black and the other 5 are white. Now, you want to calculate the probability of drawing 3 black flags if you randomly draw 4 flags from the box. So, the Sample Size is 4, the Number of Successes in Sample is 3, the Number of Successes in Population is 5, and the Population Size is 10. You can see that I have entered these data in the following dataset. I will use this dataset to show you how to calculate the probability of Hypergeometric Distribution in Excel.
1. Apply COMBIN Function to Calculate Probability of Hypergeometric Distribution in Excel
In this first method, I will use the COMBIN function to calculate the probability of Hypergeometric Distribution in Excel. Here, I will use the generic formula and, in the formula, I will use the COMBIN function to calculate the combinations. Let’s see the steps of this calculation.
Steps:
- Firstly, select the cell where you want to calculate the Probability. Here, I selected cell C9.
- Secondly, in cell C9 write the following formula.
=COMBIN(C6,C4)*COMBIN(C7-C6,C5-C4)/COMBIN(C7,C5)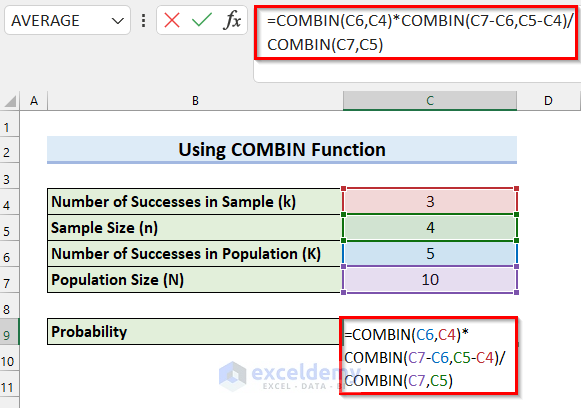
- Finally, press Enter to get the Probability.

🔎 How Does the Formula Work?
- COMBIN(C6,C4): Here, in the COMBIN function, I selected cell C6 as the number and cell C4 as the number_chosen. The formula returns the number of combinations for these specified number of items.
- COMBIN(C7-C6,C5-C4): Now, the COMBIN function returns the number of combinations for C7-C6 and C5-C4.
- COMBIN(C7,C5): Here, the COMBIN function returns the number of combinations for the values in cells C7 and C5.
- COMBIN(C6,C4)*COMBIN(C7-C6,C5-C4)/COMBIN(C7,C5): Now, the first 2 numbers of combinations are multiplied and then the result is divided by the last number of combinations.
Read More: How to Calculate Probability Distribution in Excel
2. Get Hypergeometric Probability Distribution Using Excel HYPGEOM.DIST Function
Here, I will use the HYPGEOM.DIST function to calculate the probability of Hypergeometric Distribution in Excel. The HYPGEOM.DIST function returns the Probability of a given Number of Successes in the Sample, given the Sample Size, Number of Successes in Population, and Population Size. Here, I will explain 2 different calculations using the same function. One for probability density and another for Cumulative Distribution.
2.1. Use HYPGEOM.DIST Function to Get Probability Density
In this first method, I will calculate the probability of Hypergeometric Distribution in Excel using the HYPGEOM.DIST function. I will calculate the probability of drawing 3 black flags if you randomly draw 4 flags from a box containing 10 flags among which 5 are black.
Let’s see the steps.
Steps:
- In the beginning, select the cell where you want the Probability.
- Then, write the following code in the selected cell.
=HYPGEOM.DIST(C4,C5,C6,C7,FALSE)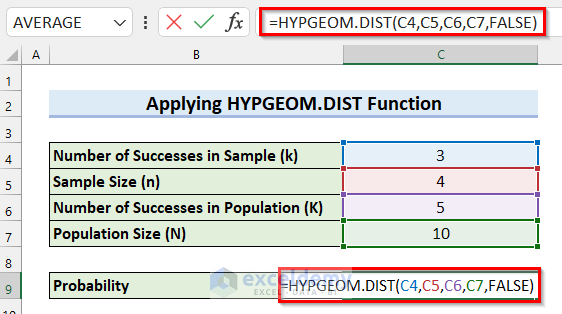
- Lastly, press Enter and you will get the Probability.

2.2. Employ HYPGEOM.DIST Function to Calculate Cumulative Distribution
Now, I will calculate the Cumulative Distribution using the HYPGEOM.DIST function in Excel. Suppose you want to calculate the probability of drawing at most 3 black flags if you randomly draw 4 flags from a box containing 10 flags among which 5 are black. Here, you will get the Cumulative Probability of drawing 1 black flag, 2 black flags, and 3 black flags. Let’s see the calculation.
Steps:
- Firstly, select the cell where you want the Probability. Here, I selected cell C9.
- Next, in cell C9 write the following formula.
=HYPGEOM.DIST(C4,C5,C6,C7,TRUE)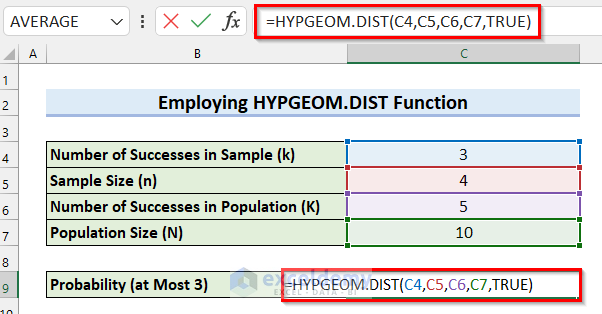
- After that, press Enter to get the result.

Read More: How to Use Continuous Probability Distribution in Excel
Practice Section
Here, I have provided a practice sheet for you to calculate the probability of Hypergeometric Distribution in Excel.
Download Practice Workbook
Conclusion
Finally, you have come to the end of my article. Here, I tried to explain 2 different methods of calculating the probability of Hypergeometric Distribution in Excel. I hope this article was clear to you. Lastly, if you have any questions feel free to let me know in the comment section below.
Related Articles
- How to Use Normal Probability Distribution in Excel
- How to Find Discrete Probability Distribution in Excel
- How to Calculate Variance of Probability Distribution in Excel
- Exponential Probability Distribution in Excel
- Poisson Probability Distribution in Excel
- How to Model Uniform Probability Distribution in Excel
- How to Find Standard Deviation of Probability Distribution in Excel
<< Go Back to Excel Probability Distribution | Excel Probability | Excel for Statistics | Learn Excel
Get FREE Advanced Excel Exercises with Solutions!
