Probability distribution indicates the probability of a variable depending on a certain value. While working on probability distribution, we must find out the standard deviation. In this tutorial, I will write about how to Calculate the Standard Deviation of Probability Distribution in Excel.
How to Calculate Standard Deviation of Probability Distribution in Excel: 2 Simple Methods
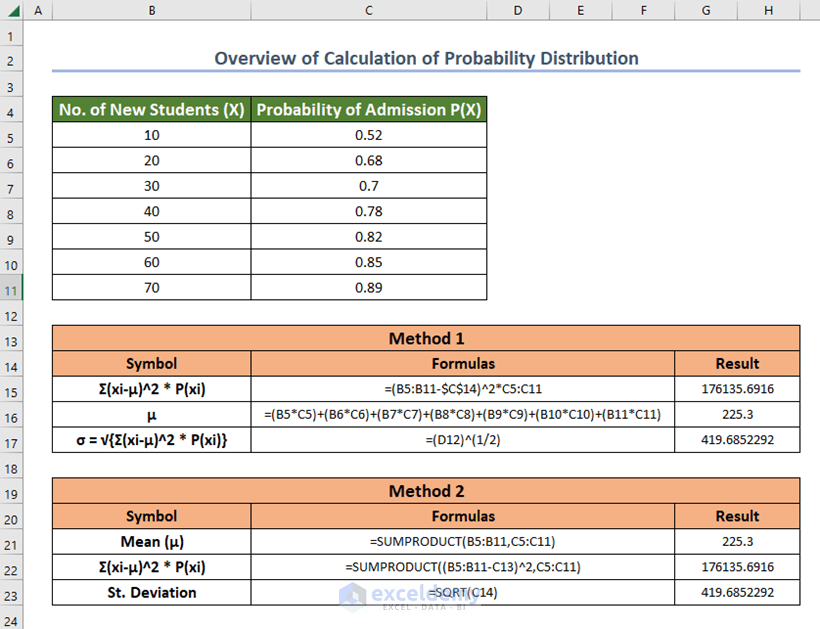
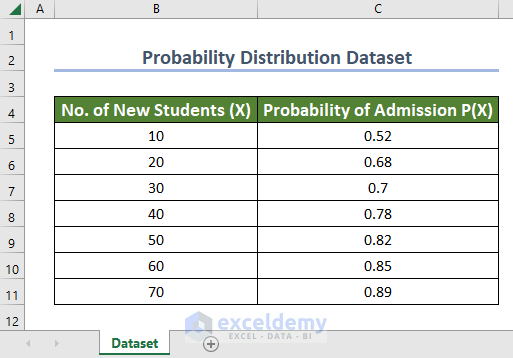
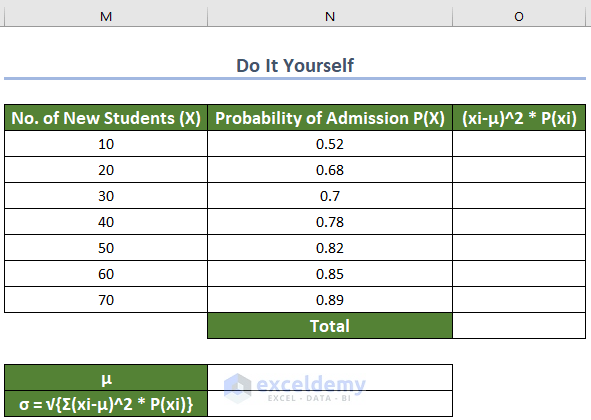
I have a dataset of Probability Distribution, where the attributes are No. of New Students (X) and Probability of Admission P(X). Here, I will show the calculation of the Standard Deviation of Probability Distribution in both generic and function methods. For this tutorial, I used the Microsoft Excel 365 version.
1. Using Generic Formula to Calculate Standard Deviation of Probability Distribution
You can use generic formulas to calculate the Standard Deviation of the probability distribution. The formula of Standard Deviation is:
σ = √{Σ(xi-μ)^2 * P(xi)}Steps:
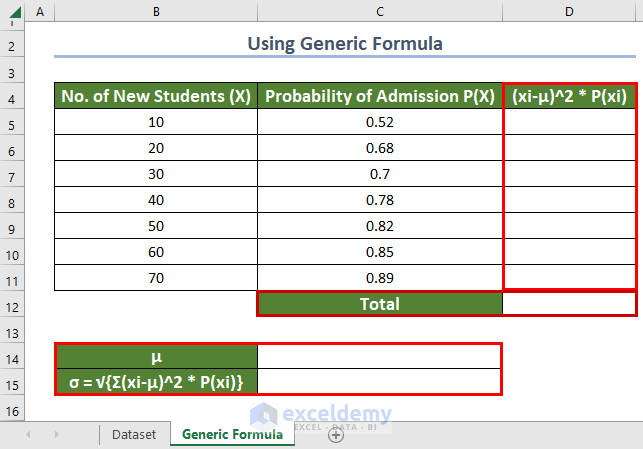
- First, I created a column of (xi-μ)^2 * P(xi), a cell to calculate the Total of all the values of (xi-μ)^2 * P(xi). In addition, I have added two rows of μ and σ = √{Σ(xi-μ)^2 * P(xi)}.
- Select cell D14.
- I will calculate μ by multiplying each cell value of No. of New Students (X) with their respective cell value of Probability of Admission P(X) and then by adding up altogether.
=(B5*C5)+(B6*C6)+(B7*C7)+(B8*C8)+(B9*C9)+(B10*C10)+(B11*C11)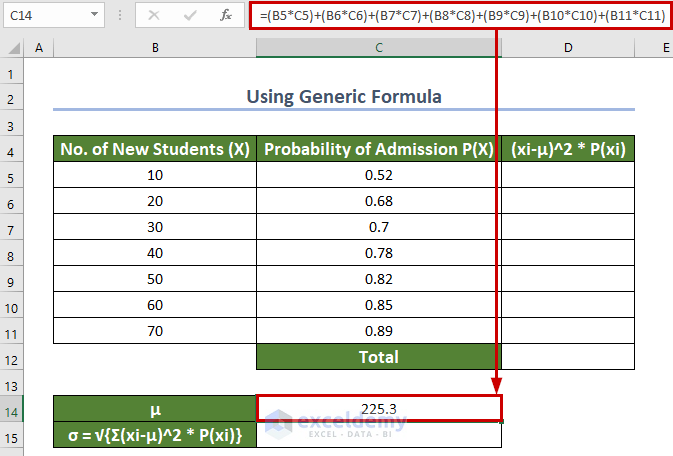
- Select cell D5.
- To calculate the (xi-μ)^2 * P(xi), I will subtract the μ from each of the cells of No. of New Students (X) and then square it to multiply the value with each of the cells of Probability of Admission P(X).
=(B5-$C$14)^2*C5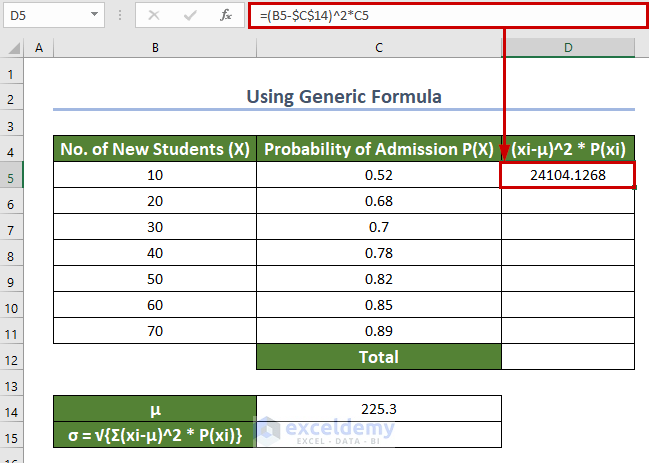
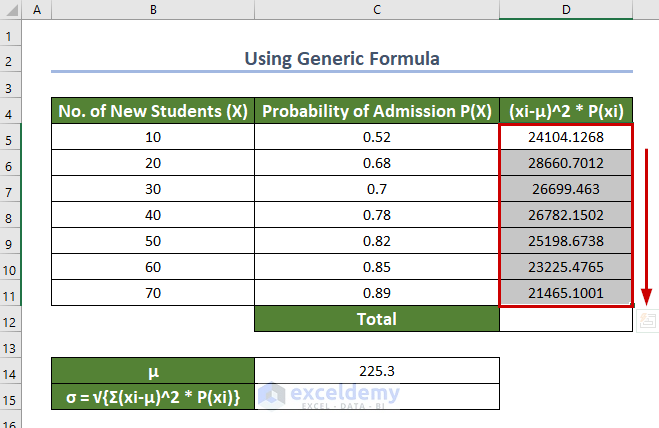
- After that, I Filled other cells using the Autofill Feature.
- Select cell D12.
- Type the following formula of cell references, to sum up, the values of every (xi-μ)^2 * P(xi) cell:
=D5+D6+D7+D8+D9+D10+D11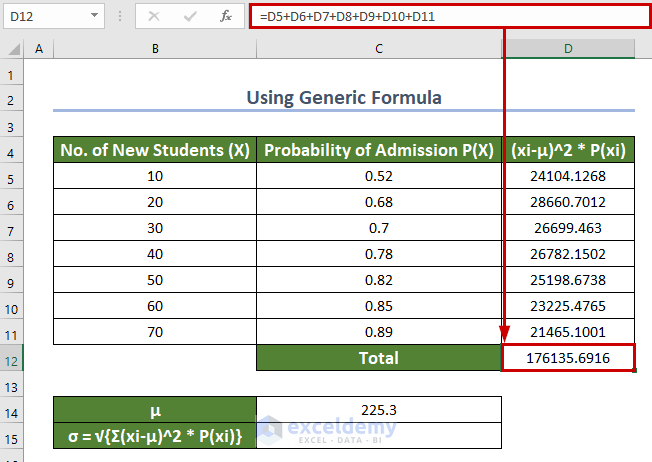
- Select cell D15.
- Type the following formula of cell references to calculate σ = √{Σ(xi-μ)^2 * P(xi)}:
=(D12)^(1/2)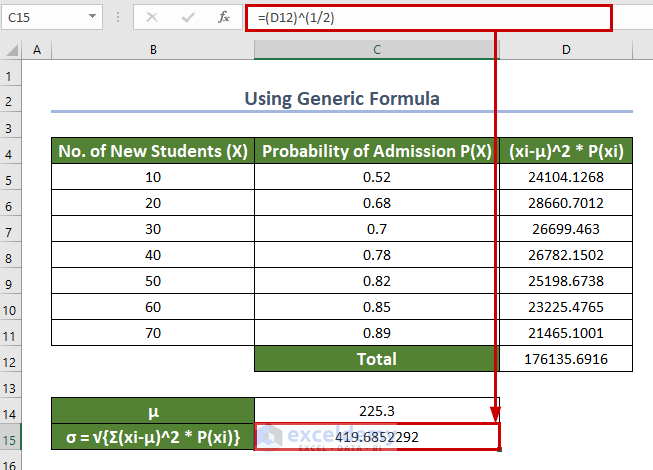
The final value is the Standard Deviation of Probability Distribution.
Read More: How to Calculate Variance of Probability Distribution in Excel
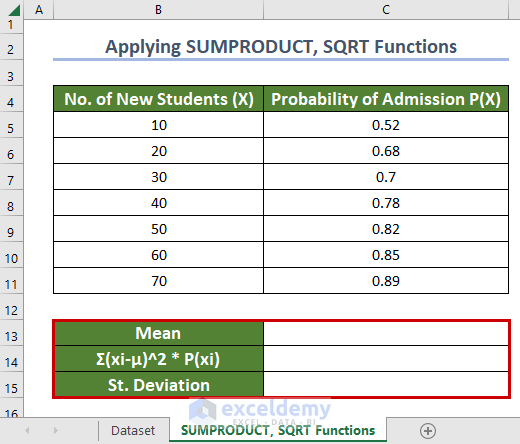
2. Applying SUMPRODUCT, SQRT Functions to Calculate Standard Deviation of Probability Distribution
You can also use SUMPRODUCT and SQRT functions to calculate the Standard Deviation of Probability Distribution.
Steps:
- First, create rows for Mean, Σ(xi-μ)^2 * P(xi), and Deviation. Here, St. Deviation is a short form used for Standard Deviation.
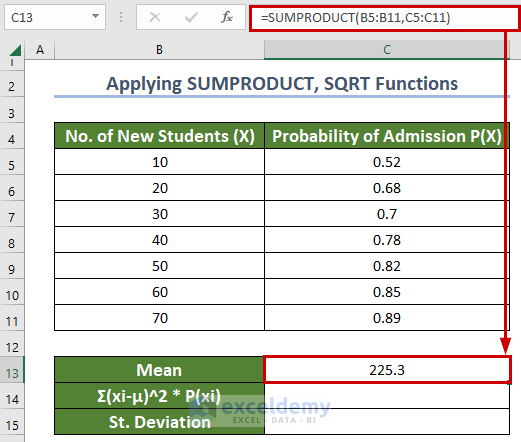
- Select cell C13.
- Type the following formula to calculate the Mean:
=SUMPRODUCT(B5:B11, C5:C11)Formula Breakdown
- SUMPRODUCT(B5:B11, C5:C11) → The SUMPRODUCT function will add values after multiplying each cell value of No. of New Students (X) with the respective cell value of Probability of Admission P(X).
- B5:B11 is the cell range of the No. of New Students (X) column.
- C5:C11 is the cell range of the Probability of Admission P(X)
- Output → 225.3.
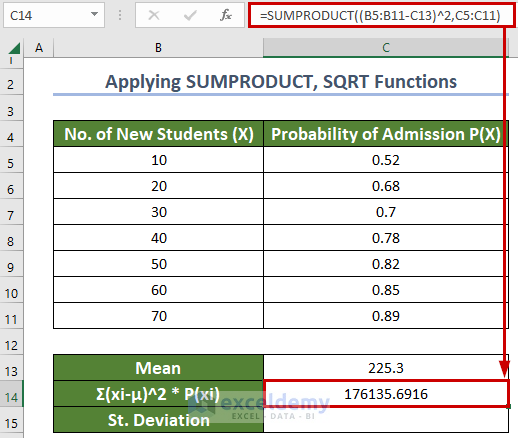
- Select cell C14.
- Type the following formula to calculate Σ(xi-μ)^2 * P(xi):
=SUMPRODUCT((B5:B11-C13)^2, C5:C11)How Does This Formula Work?
- SUMPRODUCT((B5:B11-C13)^2, C5:C11) → The SUMPRODUCT function will add values after multiplying each cell of the given cell ranges.
- (B5:B11-C13)^2 is for subtracting Mean from each of the cell values from No. of New Students (X) and square the value afterward.
- C5:C11 is the total cell range of the Probability of Admission P(X)
- Output → 176135.6916.
- Select cell C15.
- Then type the following formula to calculate St. Deviation:
=SQRT(C14)Formula Breakdown
- SQRT(C14) → becomes
- SQRT(176135.6916) → The SQRT function will square root the given value of Σ(xi-μ)^2 * P(xi).
- Output → 419.6852292.
- SQRT(176135.6916) → The SQRT function will square root the given value of Σ(xi-μ)^2 * P(xi).
Now, we have the standard deviation of probability distribution in cell C15.
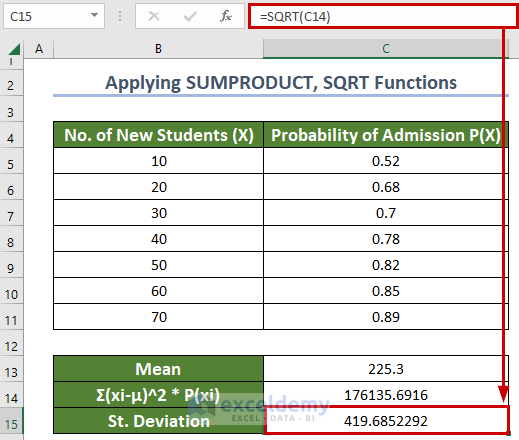
Finally, the value you get is the Standard Deviation of Probability Distribution.
Read More: How to Use Continuous Probability Distribution in Excel
Practice Section
On the right side of each worksheet, you will find a practice section to practice on your own.
Download Practice Workbook
You can download the practice workbook here.
Conclusion
In this article, you will be able to learn how to calculate the Standard Deviation of probability distribution in Excel. You can suggest your thoughts about this article in the comment section below.
Related Articles
- How to Calculate Probability Distribution in Excel
- How to Use Normal Probability Distribution in Excel
- How to Find Discrete Probability Distribution in Excel
- Exponential Probability Distribution in Excel
- Poisson Probability Distribution in Excel
- How to Model Uniform Probability Distribution in Excel
- How to Calculate Probability of Hypergeometric Distribution in Excel
<< Go Back to Excel Probability Distribution | Excel Probability | Excel for Statistics | Learn Excel
Get FREE Advanced Excel Exercises with Solutions!
