In this article, we will learn to find the Discrete Probability Distribution in Excel. A discrete probability distribution indicates the probability of the occurrence of a random variable. This random variable can take only a certain number of values. Today, we will show 3 easy ways. Using these methods, you can easily find the Discrete Probability Distribution in Excel.
What Is Discrete Probability Distribution?
A discrete probability distribution counts the occurrences of a random variable that has finite outcomes. A discrete probability distribution must satisfy two conditions. They are:
- 0≤P(X=x)≤1: The discrete probability of a random variable must be between 0 and 1.
- ∑P(X = x) =1: It denotes the sum of all probabilities must be 1.
For example, if you roll a fair dice, then there can be six possible outcomes {1,2,3,4,5,6}. So, the total outcome is 6. This indicates that the probability of getting any one number is 1/6. The most common discrete probability distributions are Geometric distributions, Binomial distributions, and Bernoulli distributions.
How to Find Discrete Probability Distribution in Excel: 3 Easy Ways
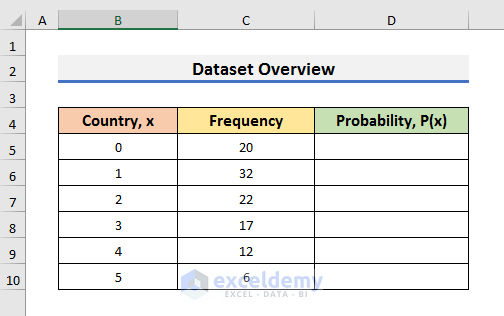
To explain discrete probability distribution, we will use a dataset that contains the number of persons visiting different countries. From the dataset, we can see that 20 people visited no countries, 32 visited 1, 22 visited 2, 17 visited 3, 12 visited 4, and 6 people visited 5 countries. We will try to find the discrete probability distribution of the number of visited countries, P(x). So, without further ado, let’s start the discussion.
1. Apply Simple Formula to Find Discrete Probability Distribution in Excel
In the first method, we will apply a simple mathematical formula to find the discrete probability distribution in Excel. The basic concept of discrete probability distribution says that you need to divide the occurrence of a random variable number by the total number of occurrences. That is why we will sum the number of total frequencies first and then divide each frequency by it. Let’s follow the steps below to get a clearer concept of the method.
STEPS:
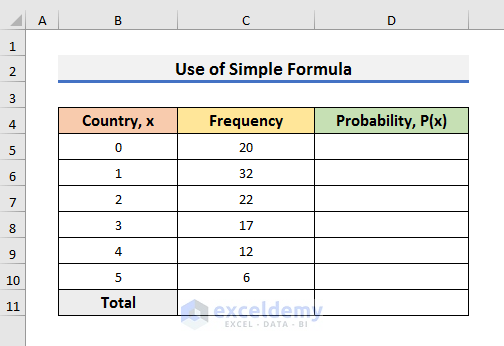
- Firstly, insert a row to count the total frequency.
- In our case, the 11th row is the Total row.
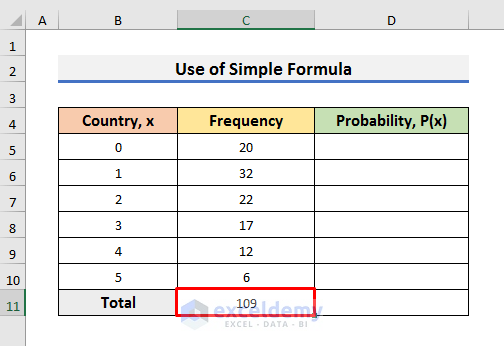
- Secondly, select Cell C11 and type the formula below:
=SUM(C5:C10)
Here, we have used the SUM function to count the total frequency. Basically, it is the total number of people who visited different countries.
- Press Enter to see the total frequency.
- Thirdly, select Cell D5 and type the formula below to find the probability:
=C5/$C$11
Here, we have divided the frequency of Cell C5 by the total frequency of Cell C11. In each case, we need to divide the frequency by the total frequency of Cell C11. That is why we have locked Cell C11 in this formula.
- Now, press Enter and drag the Fill Handle down to Cell C10.

- As a result, you will find the discrete probability distribution for the random variable.

From the results, we can say that the probability of visiting 3 countries is 0.156. We can see that all the probabilities are between 0 and 1. So, it meets the first condition.
- To check the sum of probabilities, use the formula in Cell D11:
=SUM(D5:D10)
- Finally, press Enter to see the sum of all probabilities is 1 which is the second condition of the discrete probability distribution.

Note: In the last section, we have described the way to find the discrete probability distribution Mean or Expected Value, Variance, and Standard Deviation.
Read More: How to Use Normal Probability Distribution in Excel
2. Insert Excel PROB Function to Determine Discrete Probability Distribution
In the second method, we will determine the discrete probability distribution in a limit. We can do so by using the PROB function in Excel. In this case, we need to have the probabilities for each occurrence. The dataset below contains the probability of visiting 0 to 5 countries. Using this, we can find the probability of visiting 1 to 3 countries easily. Let’s follow the steps below to see how we can implement the method.

STEPS:
- First of all, select Cell B13 and type the formula below:
=PROB(B5:B10,C5:C10,1,3)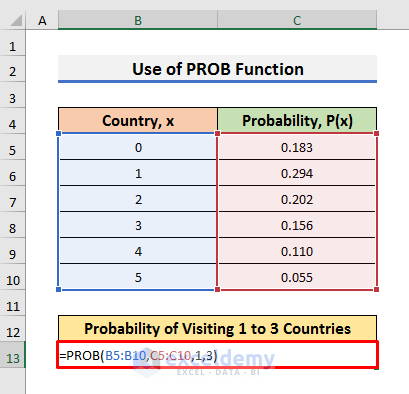
Here, we have used the PROB function to find the probability of visiting 1 to 3 countries. You need to change the limit for calculating the probability of a different range.
- After that, press Enter to see the result.

Read More: Exponential Probability Distribution in Excel
3. Calculate Discrete Probability Distribution Using Excel COUNTIF Function
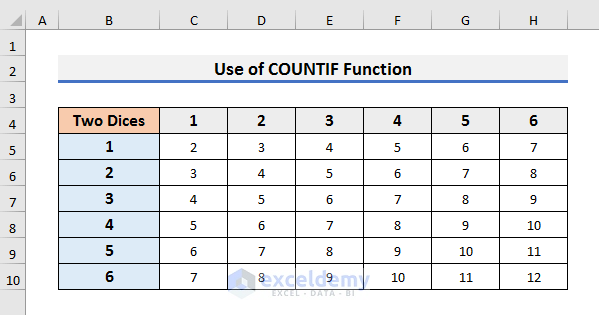
In the third example, we will use the COUNTIF function to find the discrete probability distribution in Excel. To explain the method, we will use a different dataset. Suppose two dice are rolled and the sum of their outcomes is listed in the dataset below. The outcomes are {2,3,4,5,6,7,8,9,10,11,12}. We will find the probability of each outcome.
Let’s follow the steps below to find the probability of each outcome.
STEPS:
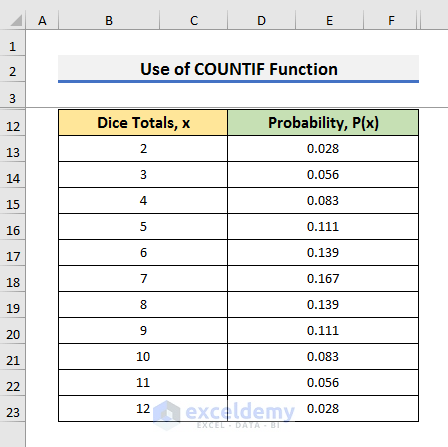
- Firstly, select Cell D13 and type the formula below:
=COUNTIFS($C$5:$H$10,B13)/COUNT($C$5:$H$10)
Here, we have used the COUNTIF and COUNT functions. The COUNTIF function determines the number of occurring 2 in the range C5:H10. The COUNT function finds the number of total events in the range C5:H10.
- Secondly, press Enter and drag the Fill Handle down to Cell D23.

- Finally, you will get the probability of each outcome occurring.
Read More: Poisson Probability Distribution in Excel
How to Find Discrete Probability Distribution Mean/Expected Value, Variance and Standard Deviation in Excel
Sometimes, you need to find the Mean, Variance, and Standard Deviation along with the probability distribution.
- Mean/Expected Value: It is the weighted average of all the possible values of a discrete random variable. It is also called the Expected Value. To calculate the mean, we need to multiply each occurrence of the random variable, x by their probability, P(x), and then, sum them up. The formula can be written as:
E[X]=∑x*P(X=x)- Variance: It is the measure of the dispersion of all the events about the mean. The formula of variance is:
V[X]=∑[x^2*P(X=x)]-E[X]^2- Standard Deviation: We can calculate the standard deviation by taking the square root of the variance. It also indicates dispersion.
To calculate the mean, variance, and standard deviation, we will use the dataset of Method 1.
So, let’s follow the steps below to know more.
STEPS:
- Firstly, select Cell E5 and type the formula below:
=B5*D5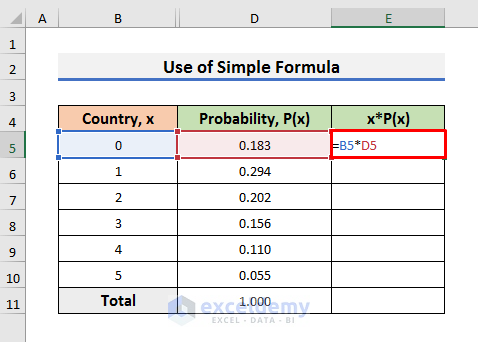
Here, we are multiplying x with P(x).
- Secondly, press Enter and drag the Fill Handle down to Cell E10.

- Now, select Cell E11 and type the formula below to sum all the products:
=SUM(E5:E10)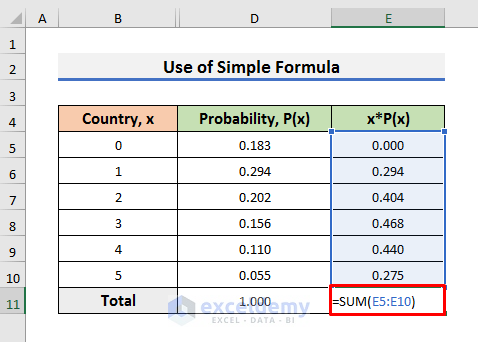
- Press Enter to see the Mean or Expected Value.

- In the following step, we will calculate the variance.
- To do so, select Cell F5 and type the formula below:
=B5^2*D5
- After that, press Enter and drag down the Fill Handle to Cell F10.
- Now, type the formula in Cell F11 to calculate the variance:
=SUM(F5:F10)-(E11^2)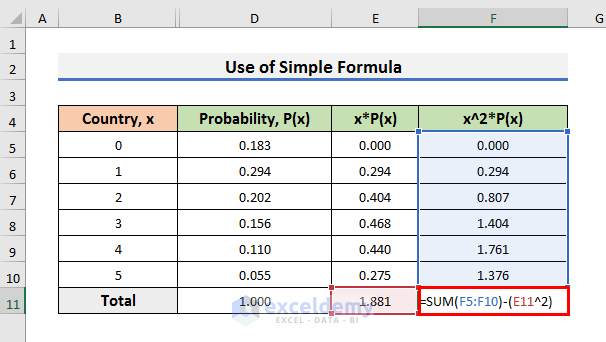
- Hit Enter to see the variance.

- Finally, to calculate Standard Deviation, type the formula in any cell and press Enter:
=SQRT(F11)
Here, we have used the SQRT function to find the standard deviation. Because the SQRT function gives us the square root of the variance.
Read More: How to Find Standard Deviation of Probability Distribution in Excel
Download Practice Workbook
You can download the practice workbook from here.
Conclusion
In this article, we have discussed 3 easy methods to find Discrete Probability Distribution in Excel. I hope this article will help you to perform your tasks efficiently. Furthermore, we have also added the practice book at the beginning of the article. To test your skills, you can download it to exercise. Lastly, if you have any suggestions or queries, feel free to ask in the comment section below.
Related Articles
- How to Calculate Probability Distribution in Excel
- How to Calculate Variance of Probability Distribution in Excel
- How to Model Uniform Probability Distribution in Excel
- How to Calculate Probability of Hypergeometric Distribution in Excel
- How to Use Continuous Probability Distribution in Excel
<< Go Back to Excel Probability Distribution | Excel Probability | Excel for Statistics | Learn Excel
Get FREE Advanced Excel Exercises with Solutions!
