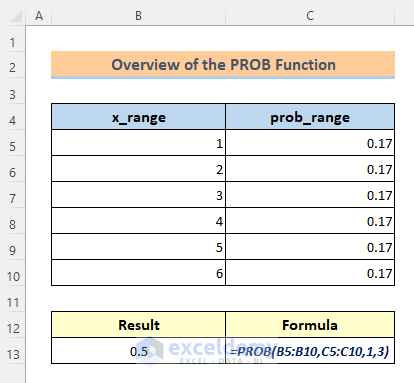
Here’s an overview of the PROB function in Excel.
What Is Probability?
Probability defines the chance of occurrence of an event. There are many real-life situations in which we may need to predict the outcome of an event. We may be sure or not sure of the occurrence of an event. In that case, we may say that there is a probability of this event to occur or not occur.
The probability can be calculated with a simple formula by dividing the favorable number of outcomes by the total number of possible outcomes. The value of the probability lies between 0 and 1 because the possible number of outcomes can never cross the total number of outcomes. Also, the favorable number of outcomes cannot be negative.
Probability = Favorable Number of Outcomes/Total Possible Outcomes = x/NIntroduction to the Excel PROB Function
The PROB function is categorized under Statistical functions.
Purpose:
To numerically anticipate that a set of values in a given range are between two limits.
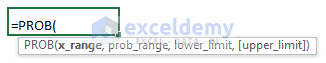
Syntax:
=PROB(x_range, prob_range, [lower_limit], [upper_limit])Arguments:
| Arguments | Required/Optional | Explanation |
|---|---|---|
| x_range | Required | The range of numeric values which are associated with probabilities. |
| prob_range | Required | A set of probabilities that are associated with the values in x_range. |
| lower_limit | Optional | The lower bound on the x_range for which you want a probability. |
| upper_limit | Optional | The upper bound on the x_range for which you want a probability. |
Return Parameter:
The probability for a set of events associated with a given range.
Available in:
MS Excel 2007 and newer versions.
Using the PROB Function in Excel: 3 Easy Examples
Example 1 – Find the Probability of a Single Event with the PROB Function
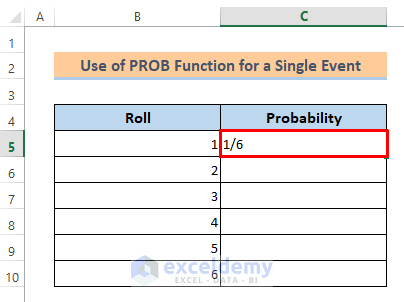
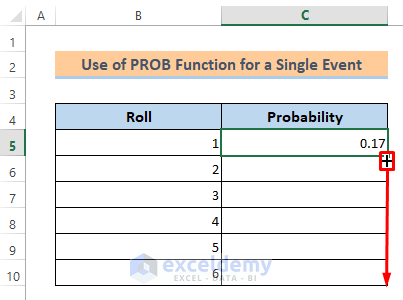
We have made a dataset that represents the 6 rolls of a dice. By using the PROB function, we’ll be able to find the probability of any roll or for any range of roll. But before that, we have to find the probability of each roll manually.

We have a total of 6 rolls. The probability of getting roll 1 will be 1/6.
- Type this in cell C5 and press the Enter button.
- We’ll get the probability of 0.17 for roll 1. You can increase the decimals if needed.
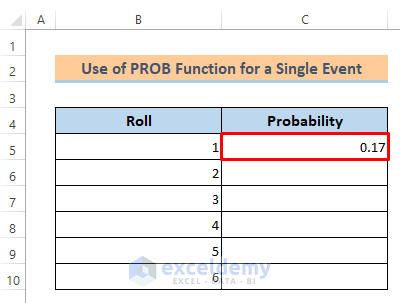
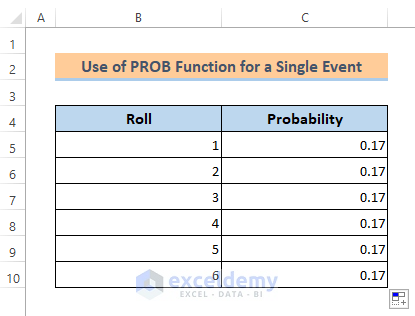
The probability of other rolls will be the same because each roll has one chance.
- Drag the Fill Handle icon to copy the value for the other cells.
- We got all the roll probabilities.
The Probability of Getting the Rolls from 4 to 6:
Steps:
- Use the following formula in cell C5:
=PROB(B5:B10,C5:C10,4,6)- Press the Enter button.
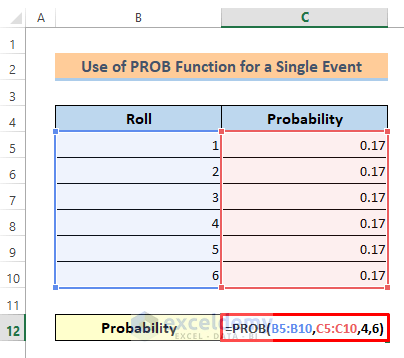
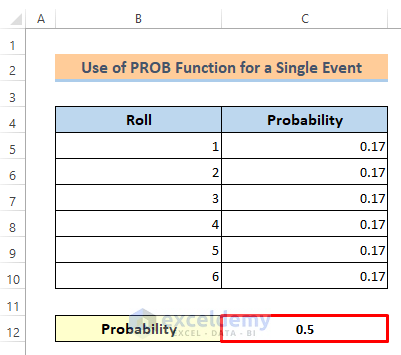
- You will get the probability of getting the rolls from 4 to 6 is 0.5.
Example 2 – Excel PROB Function to Find the Probability for Two Simultaneous Events
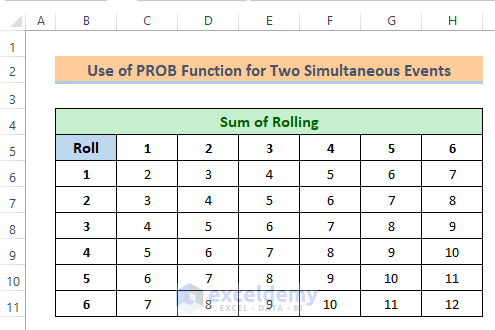
We have made a new dataset that represents the rolls of two dice. We placed the rolls of the first dice in Row 3 and the rolls of the second dice in Column B.
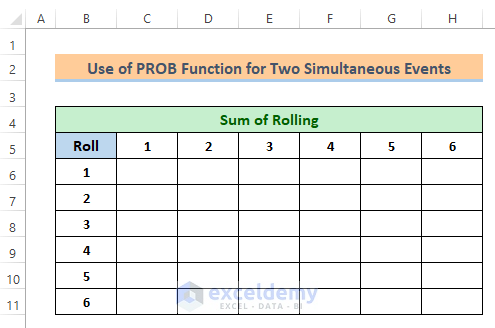
We’ll find the probable sum of each simultaneous roll by using a formula.
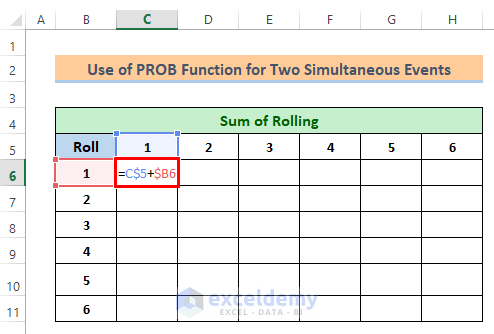
- To get the sum in cell C6, use the following formula-
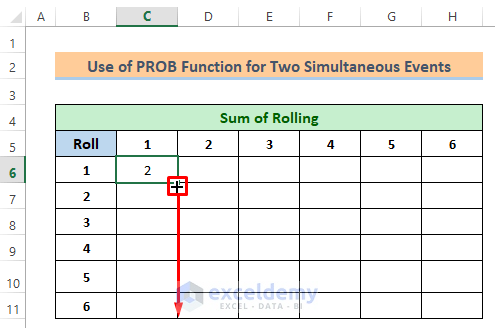
=C$5+$B6- Press the Enter button.
- Drag down the Fill Handle icon as shown in the image below-
- Drag the Fill Handle icon to the right, and you will get all the sums.
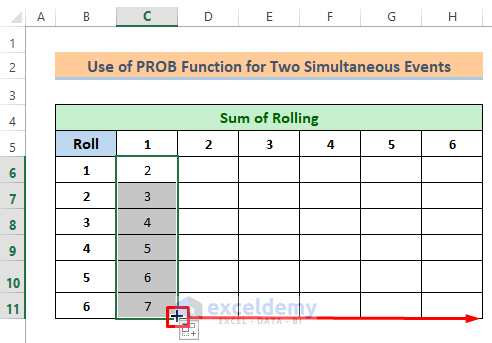
The lowest sum is 2 and the highest sum is 12.
- We placed the sum values in a new table as x_range for the PROB function.
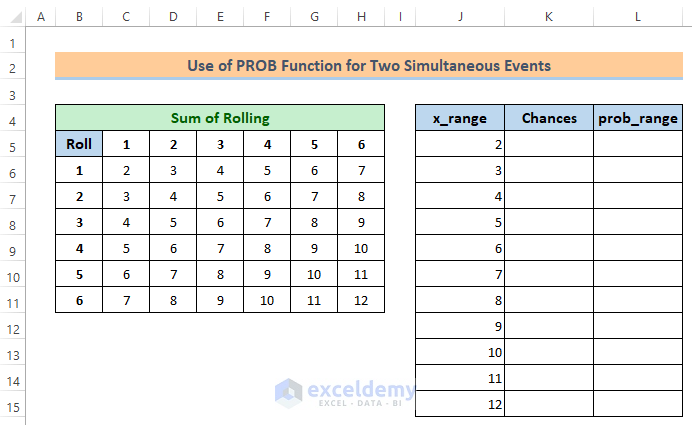
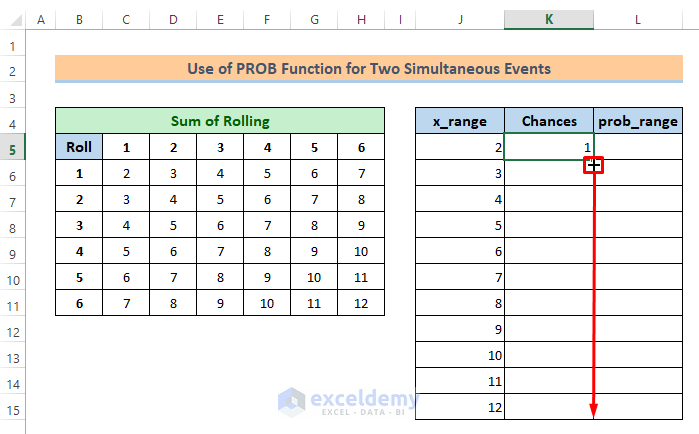
We’ll find the chances of each sum using the COUNTIF function.
Steps:
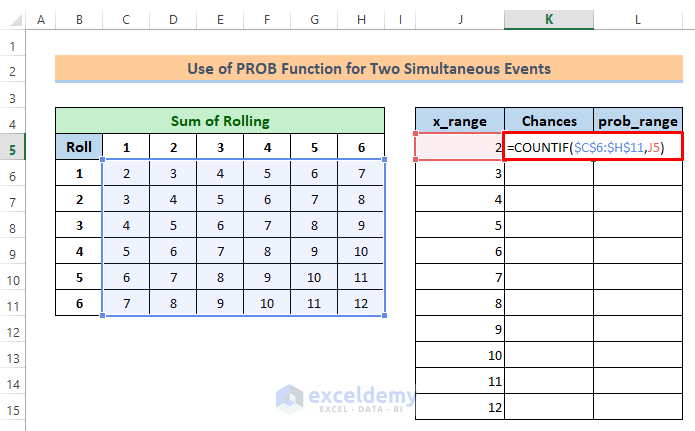
- In cell K5, insert the following formula:
=COUNTIF($C$6:$H$11,J5)- Hit the Enter button.
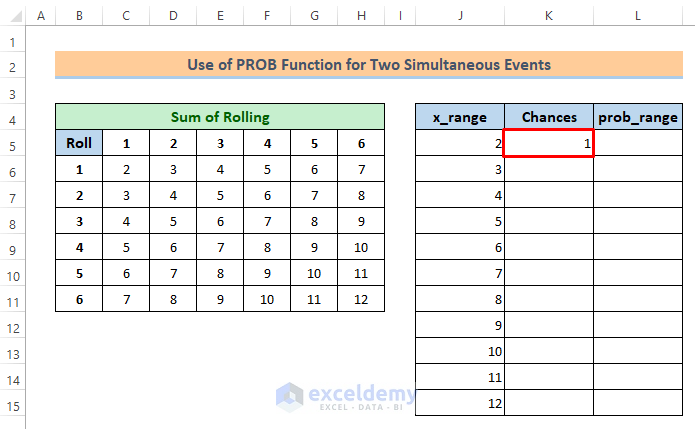
Here’s the first result, 1, since there’s only one such value in the table.
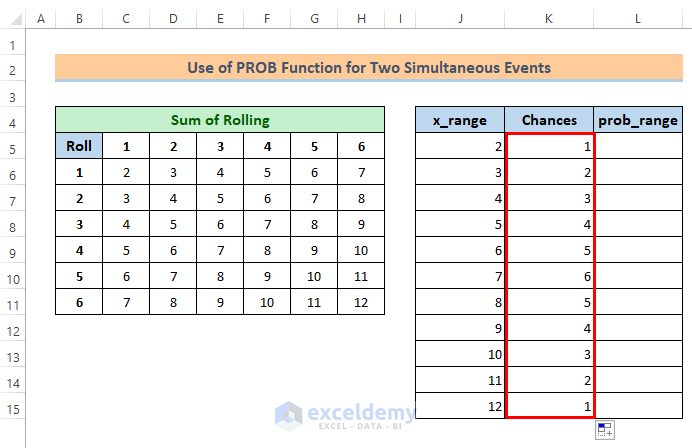
- Drag the Fill Handle icon over the cells as shown in the image below.
We got all the chances.
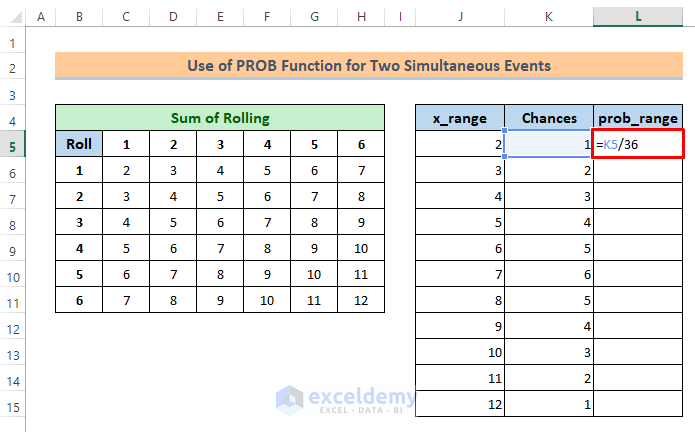
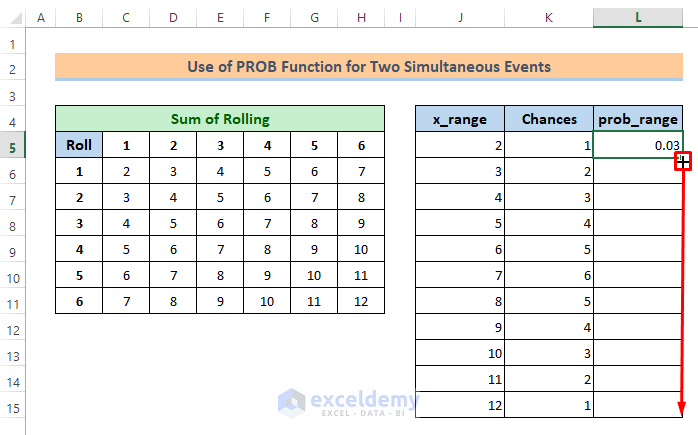
We’ll find the probability of chances and will place it in column L as prob_range for the PROB function.
Probability = Favorable Number of Outcomes/Total Possible Outcomes
Calculate the Probability for Each Sum:
- Use the following formula in cell L5:
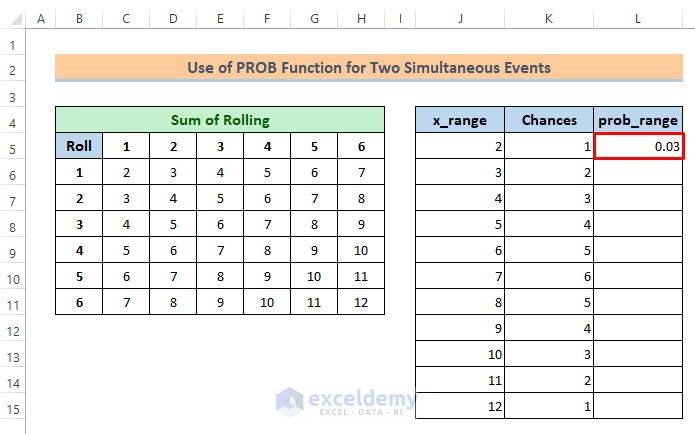
=K5/36- Press the Enter button.
You will get the probability for sum 2 as 0.03.
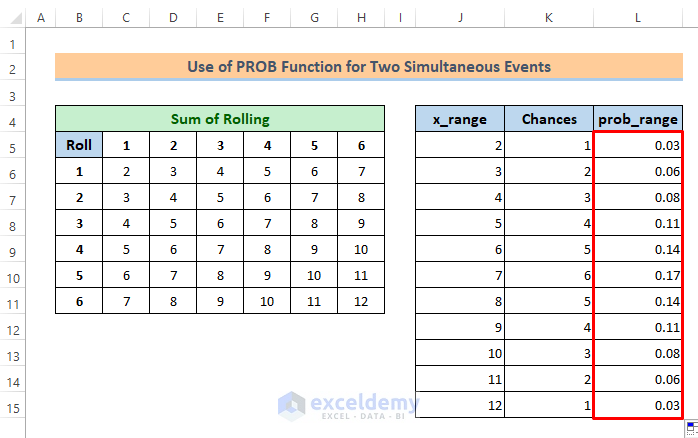
- Drag the Fill Handle icon to get the other probabilities.
We have all the probabilities now which is the prob_range for the PROB function.
Case 1 – Probability of Getting a Sum Less Than 9
- Use the following formula and press the Enter button.
=PROB(J5:J15,L5:L15,2,8)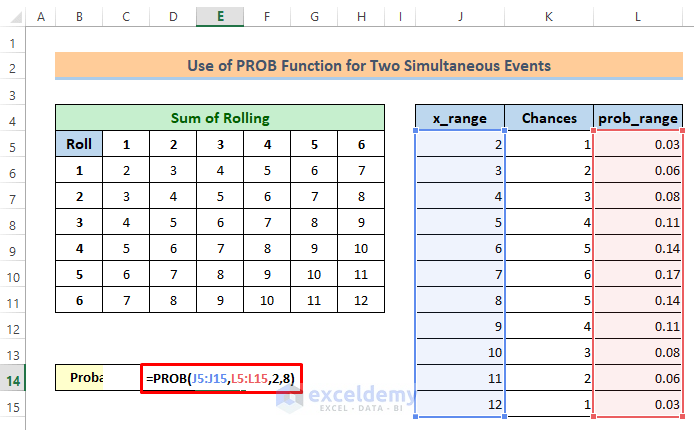
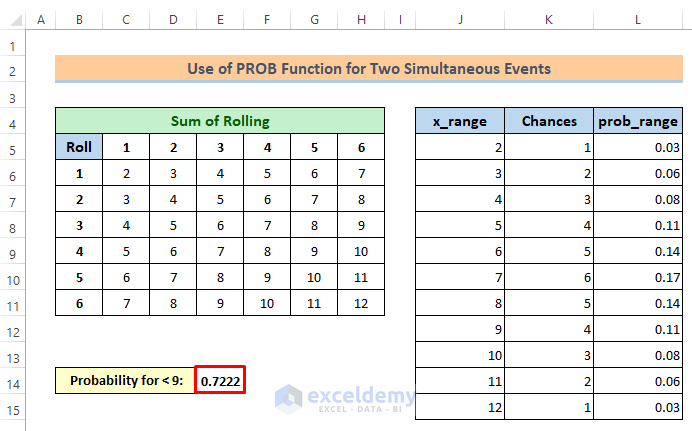
You will get the probability of getting a sum less than 9 as 0.7222.
Case 2 – Probability of Getting a Sum Equal to 9
- Use the following formula:
=PROB(J5:J15,L5:L15,9)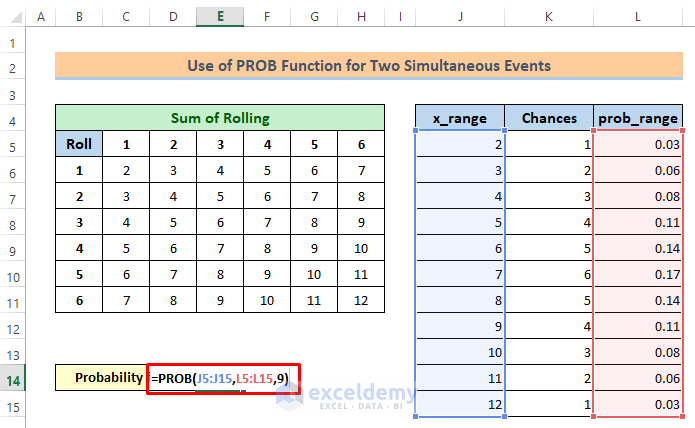
You will get the probability for 9 as 0.1111.

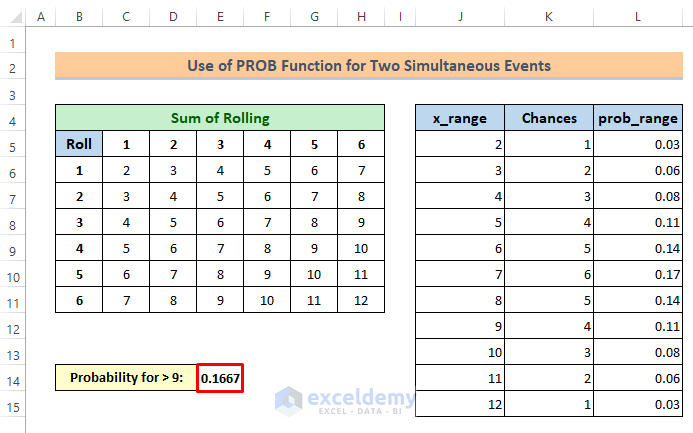
Case 3 – Probability of Getting a Sum Greater Than 9
- Use the following formula:
=PROB(J5:J15,L5:L15,10,12)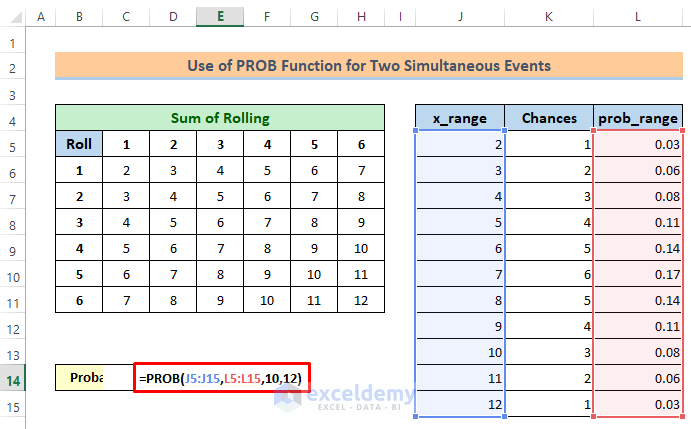
You will get the output like this:
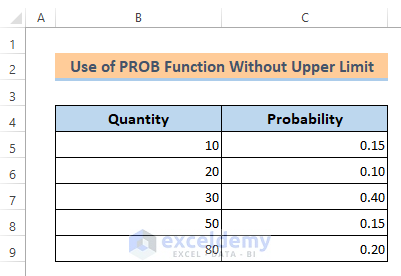
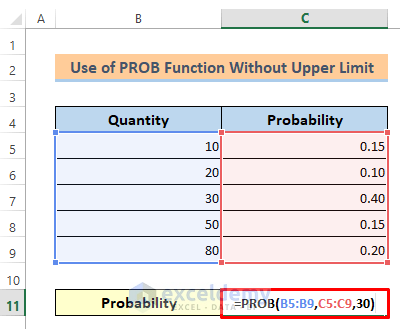
Example 3 – Use of the PROB Function without the Upper Limit
If the upper limit is not given, then the PROB function finds the probability according to the lower limit. We have made a new dataset that represents a product’s selling probability for different quantities.
Steps:
- Use the following formula in cell C11:
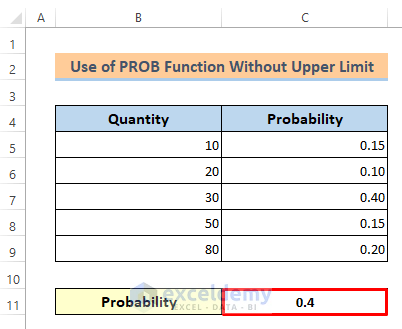
=PROB(B5:B9,C5:C9,30)- Hit the Enter button.
The result is just according to the lower limit which is 0.4.
Things to Remember
- The PROB function will return the #NUM! error if any value in prob_range ≤ 0 or if any value in prob_range > 1.
- The PROB function will return #NUM! error if the sum of the values in prob_range is not equal to 1.
- The PROB function will return the probability for lower_limit if upper_limit is omitted,
- The PROB function will return the #N/A error if x_range and prob_range contain a different number of data points.
Download the Practice Workbook
<< Go Back to Excel Functions | Learn Excel
Get FREE Advanced Excel Exercises with Solutions!

Thank you so much for your fundamental information regarding Excel.