In mathematics, Probability is the measure of the likelihood that an event will occur. Probability is quantified as a number between 0 and 1, where 0 indicates impossibility and 1 indicates certainty. The higher the probability of an event, the more likely it is that the event will occur. Joint Probability is one of a kind. In this article, I will try to explain with step-by-step procedures how to create joint probability table in Excel. I hope you have come to the right place if you are looking for the best possible way to create a joint table in Microsoft Excel.
Introduction to Joint Probability Table
A Joint Probability Table is a mathematical table that shows the probabilities of two or more events occurring together. The table lists all of the possible combinations of events and their corresponding probabilities. It is a powerful tool for statisticians and probability theorists. It can be used to calculate the probability of any combination of events occurring.
How to Create Joint Probability Table in Excel: Step-by-Step Procedures
The creation of a joint probability table in Excel is a systematic process. You just need to follow the following procedure to execute the process perfectly.
Step 1: Create an Organized Dataset
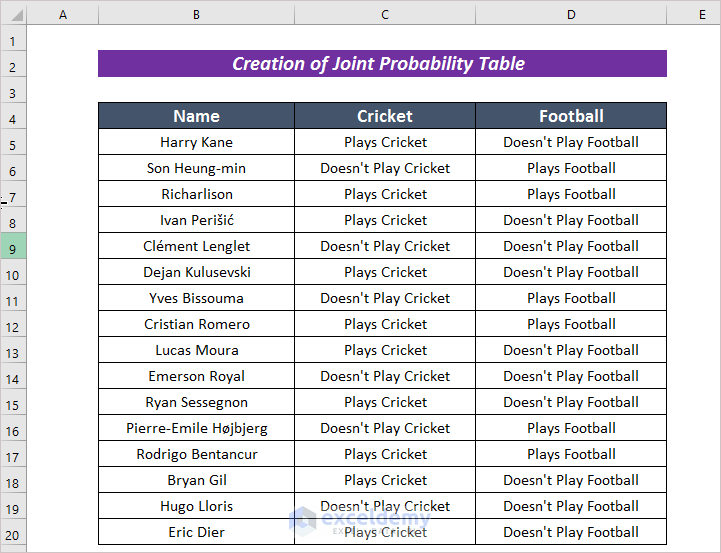
- First of all, arrange the data in a dataset where you can apply probability. In my case, I have decorated a dataset where people play cricket, football, or both. I have arranged them in the Name, Cricket, and Football columns.
Step 2: PivotTable Formation
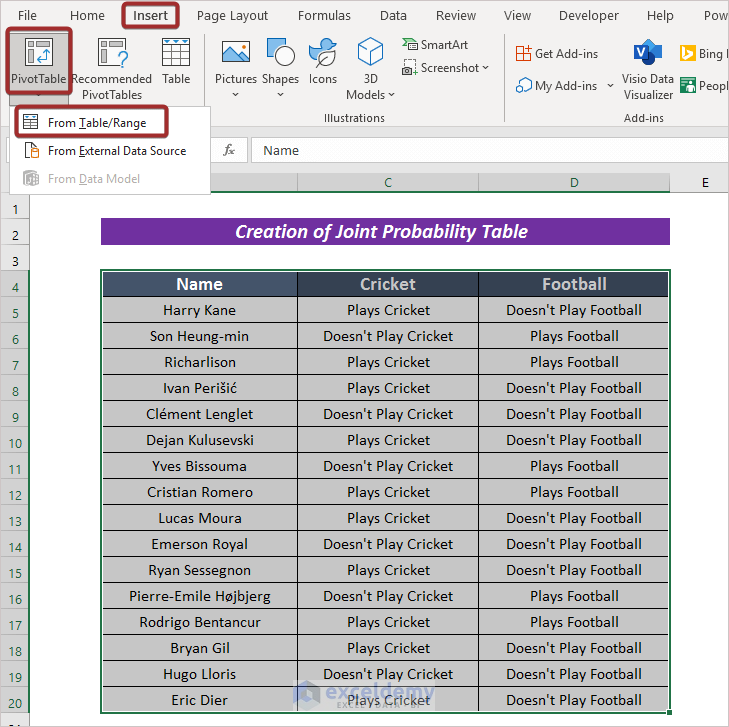
- Select the entire dataset.
- Next, go to the Insert tab.
- Then, click on From Table/Range from the PivotTable option in the ribbon.
- Check the range in the Table/Range section.
- After that, pick your PivotTable location.
- Finally, press OK.

- Assign your Rows, Columns, and Values from the PivotTable Fields.
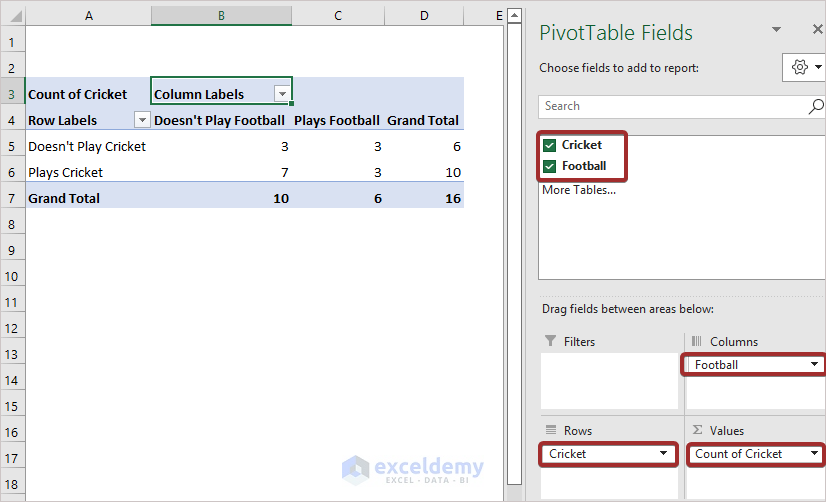
Thus, we can have a PivotTable.
Step 3: Create Joint Probability Table
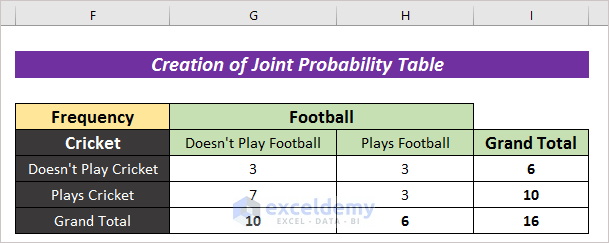
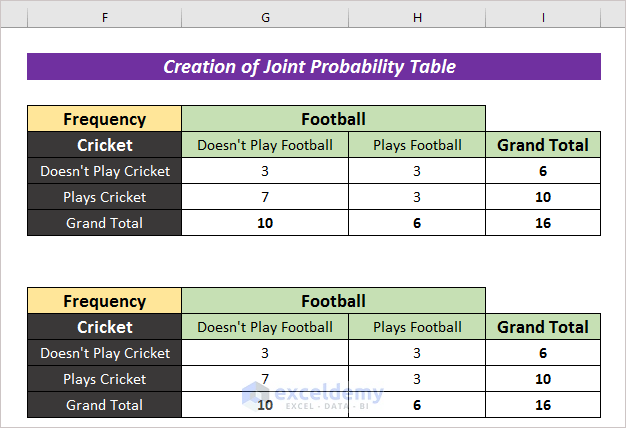
- Now, copy the entire PivotTable and paste the values in your preferred location.
- You can modify the values according to your choice.
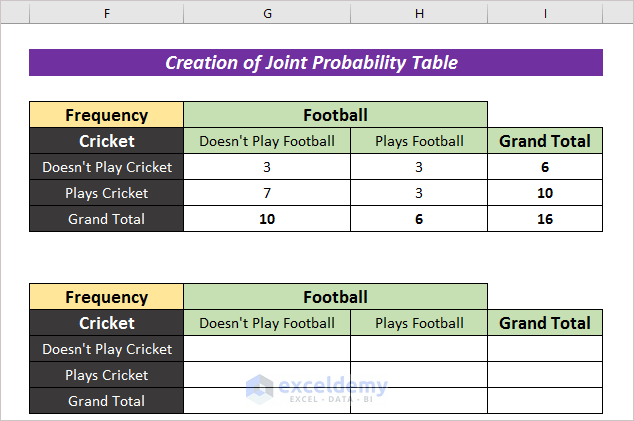
- Now, create another copy of the modified table.
- Remove all the values from the new table.
- Afterward, input the following formula to convert the whole table with respect to the total value.
=G6:I8/I8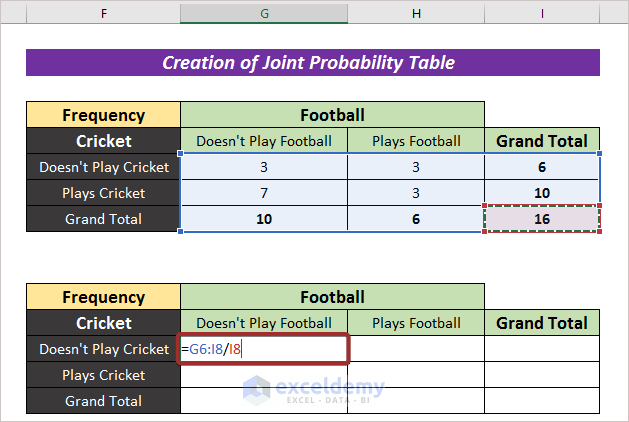
- Press ENTER to have the whole value with respect to 1.
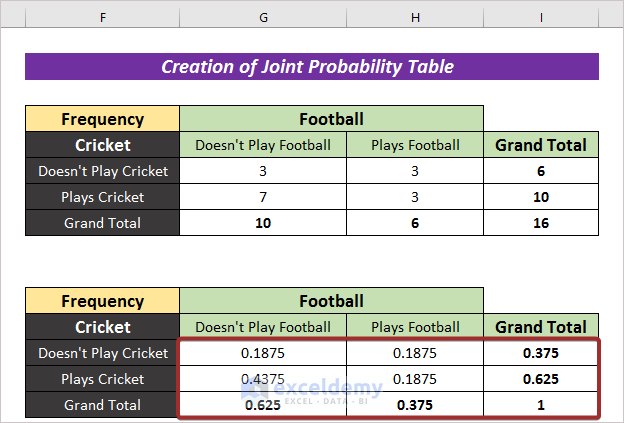
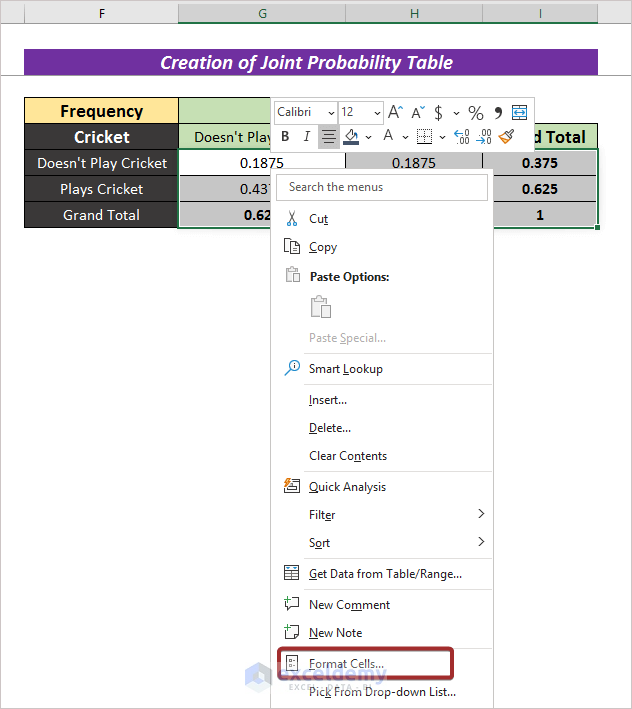
- You can change the number format of the table. For this, right-click on the mouse and select Format Cells…
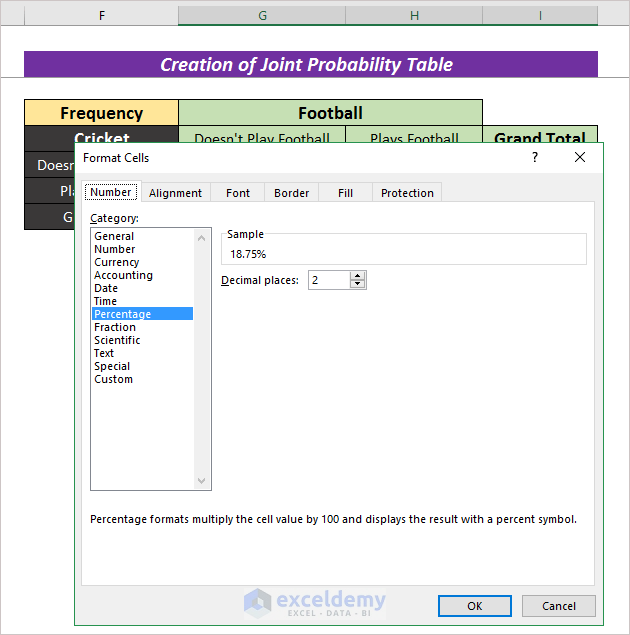
A Format Cells wizard will appear.
- From the Category, pick Percentage and click on OK to convert the whole table into percentage format.
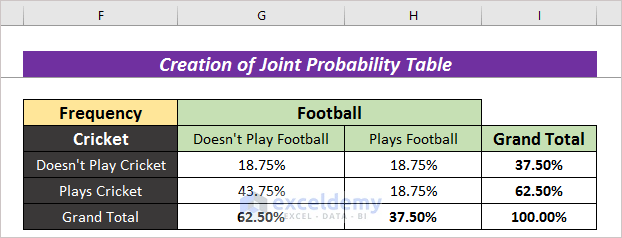
Thus, we can have a joint probability table in percentile format.
Read More: How to Calculate Probability in Excel
Step 4: Different Probabilities Calculation from Joint Probability Table
- We can use the joint probability table to calculate the conditional probability. For a single condition, you can have the value from the probability table. In the following table, we can find the value of people who don’t play cricket with the following formula to have the value.
=I13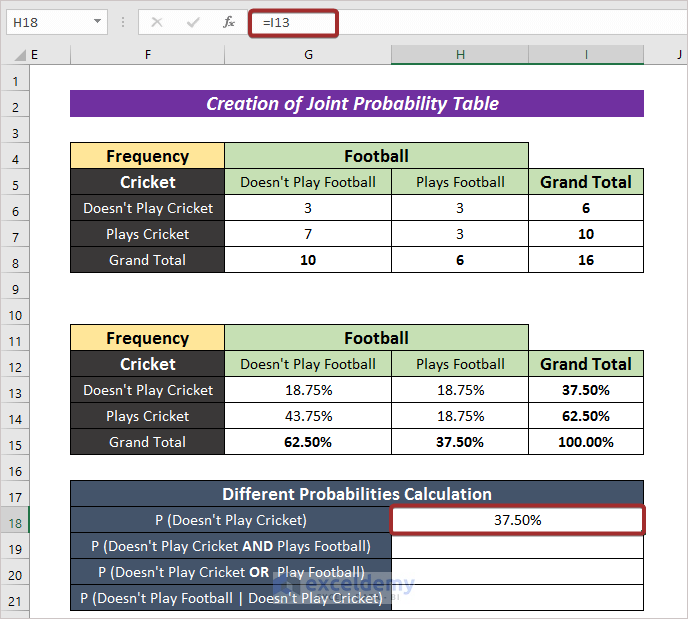
- We can use the following formula to have the value where double conditions are satisfied.
=H13
- To have the value where double conditions are satisfied with OR, apply the following formula:
=I13+H15-H13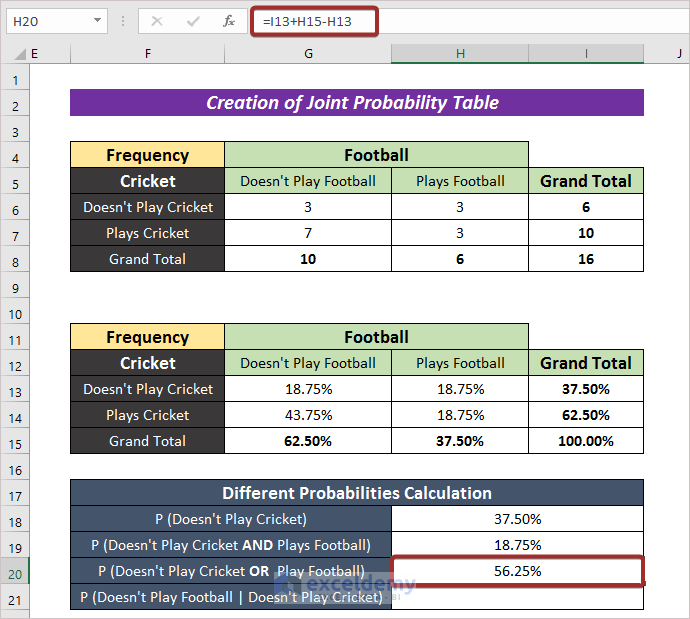
- In order to find the probability of a parameter with respect to another one, divide the intersected value with the correspondent parameter. Now, input the formula mentioned below to have the output:
=G13/I13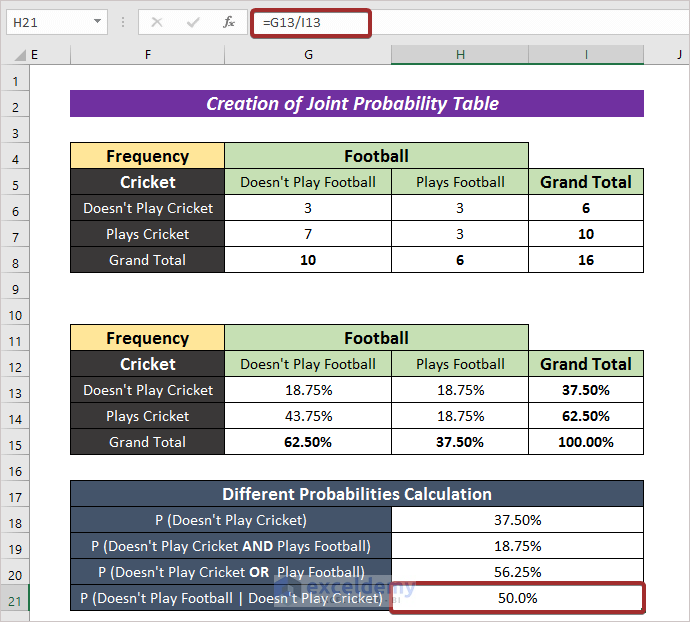
Read More: How to Calculate Joint Probability in Excel
Download Practice Workbook
Conclusion
At the end of this article, I like to add that I have tried to explain every detail of how to create joint probability table in Excel. It will be a matter of great pleasure for me if this article could help any Excel user even a little. For any further queries, comment below. You can visit our site for more articles about using Excel.
Related Articles
- How to Calculate Binomial Probability in Excel
- How to Find Marginal Probability in Excel
- How to Calculate Cumulative Probability in Excel
- How to Calculate Probability of Exceedance in Excel
- Calculating Probability in Excel with Mean and Standard Deviation
<< Go Back to Excel Probability | Excel for Statistics | Learn Excel
Get FREE Advanced Excel Exercises with Solutions!
