In the modern world, most of our work depends on data or report analysis, which helps to make future predictions, business proposals, thoughtful decision-making, etc., but these analyses would have been impossible with only numbers. This is why we use the binomial probability and probability distribution graph in Excel to represent our analysis in a more defined, organized way. In this article, we will learn how to calculate binomial probability in Excel effectively with appropriate illustrations.
Introduction to Binomial Probability
In an experiment with two possible outcomes, the likelihood of exactly x successes on n repeated trials is known as the binomial probability (commonly called a binomial experiment).
The term probability distribution is generally a representation of the frequency distribution of a specific data series. It illustrates the possibility of certain trials under specific conditions among the variable values. The basic rule of probability distribution is that the probability of a value, the higher the frequency is, and vice versa.
A probability distribution can be shown with or without a graph based on the function used. It is a very useful Excel feature to project population, performance, climatic forecast, business proposition, etc.
We can use the BINOM.DIST function to calculate the binomial probability. The syntax of BINOM.DIST function is,
=BINOM.DIST(number_s, trials, probability_s, cumulative) The arguments of the BINOM.DIST function are given below.
Number_s = Required. The number of successes.
Trials = Required. The number of independent trials.
Probability_s = Required. The probability of every trial.
Cumulative = Required. A logical value establishes the function’s shape. The probability that there are at most number_s successes is the cumulative distribution function, which BINOM.DIST returns if cumulative is TRUE; otherwise FALSE, it returns the probability mass function, which is the likelihood that there are number_s successes.

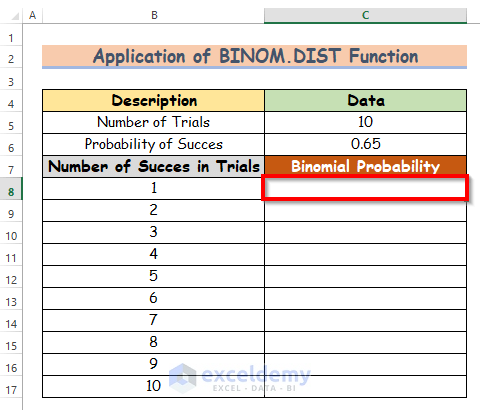
Let’s say, we have a dataset that contains information about the binomial probability. From our dataset, we will apply the BINOM.DIST function in Excel to calculate the binomial probability. Here’s an overview of the dataset for today’s task.

Step 1: Creating a Dataset with Proper Parameters to Calculate Binomial Probability
In this portion, we will consider binomial probability. For instance, data, number of trials, probability of success, number of successes in trials, and so on.

Read More: How to Create Joint Probability Table in Excel
Step 2: Applying BINOM.DIST Function to Calculate Binomial Probability
In this section, we will calculate the binomial probability using our dataset. To do that, we will apply the BINOM.DIST function. Let’s follow the instructions below to learn!
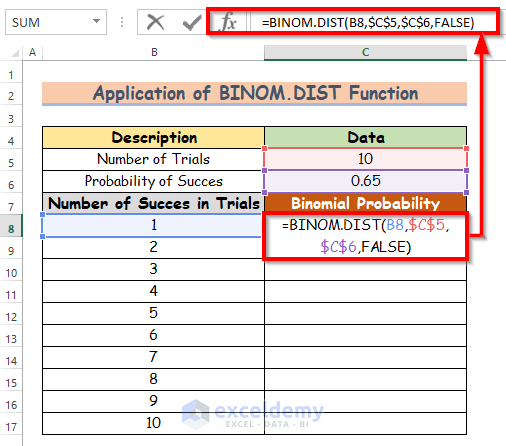
- First of all, select cell C8.
- Hence, write down the BINOM.DIST function in that cell.
=BINOM.DIST(B8,$C$5,$C$6,FALSE)Formula Breakdown:
- B8 is the number_s, $C$5 is the trials, $C$6 is the probability_s, and FALSE is the cumulative of the BINOM.DIST function.
- We use the dollar($) symbol to use the absolute reference of the cell.
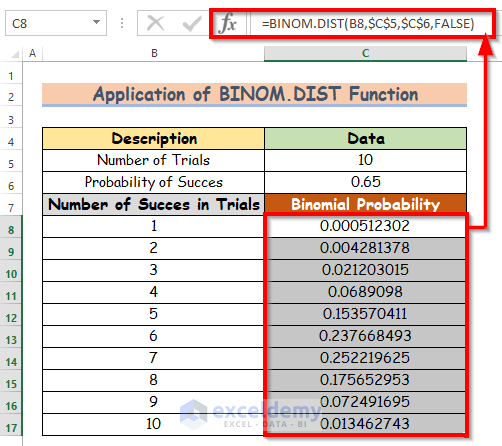
- Hence, simply press Enter on your keyboard. As a result, you will get the binomial probability which is the return of the BINOM.DIST function. The return is 0.000512302.

- After that, AutoFill the BINOM.DIST function to the rest of the cells in column C.
Read More: How to Find Marginal Probability in Excel
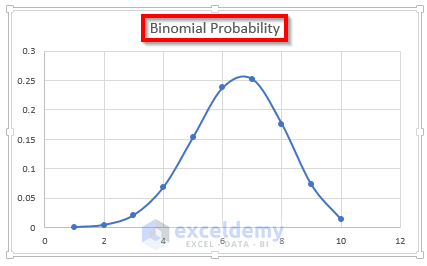
Binomial Distortion Graph in Excel
Now, in this section, we will learn how to create a binomial distortion graph in Excel. The binomial probability distribution graph is a statistical measure to calculate the probability of the number of successes from a specified number of trials. Let’s follow the instructions below to learn!
Steps:
- First of all, select the data series of cells B7:C17. Hence, from your Insert tab, go to,
Insert → Charts → Recommended Charts
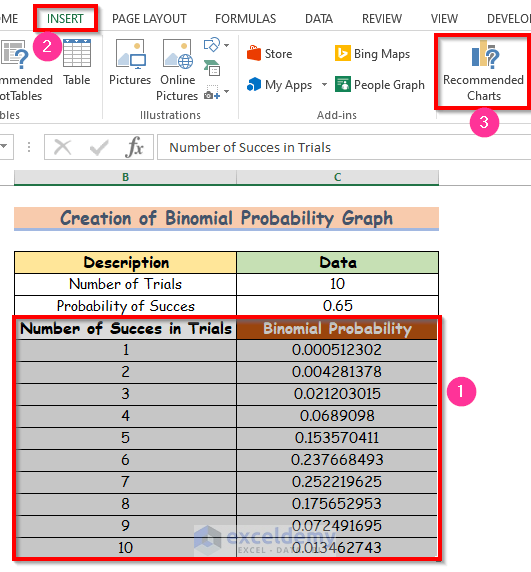
- As a result, an Insert Chart dialog box will appear in front of you. From the Insert Chart dialog box, firstly, select the All Chart Secondly, select the X Y (Scatter). Hence, select any scatter-type chart you want. At last, press the OK option.

- Finally, you will be able to create a binomial distortion graph in Excel which has been given in the below screenshot.
Read More: How to Calculate Probability of Exceedance in Excel
Things to Remember
- When the Standard Deviation ≤ 0, the NORM.DIST function will return #NUM!
- Each trial in a binomial distribution gives only two possible outcomes.
- In binomial distribution, The probability of each outcome remains constant from trial to trial.
- The range of probability is 0 ≤ P(x) ≤ 1.
Download Practice Workbook
Download this practice workbook to exercise while you are reading this article.
Conclusion
I hope all of the suitable methods mentioned above to calculate binomial probability will now provoke you to apply them in your Excel spreadsheets with more productivity. You are most welcome to feel free to comment if you have any questions or queries.
Related Articles
- How to Calculate Joint Probability in Excel
- How to Calculate Conditional Probability in Excel
- How to Calculate Cumulative Probability in Excel
- Calculating Probability in Excel with Mean and Standard Deviation
<< Go Back to Excel Probability | Excel for Statistics | Learn Excel
Get FREE Advanced Excel Exercises with Solutions!
