In this article, we will get familiar with the Excel NORMDIST function. We can use this function in statistics as well as hypothesis testing. We will go over two applications of this function.
Overview of Excel NORMDIST Function
- Description
NORMDIST function returns normal distribution for mean and standard deviation. In statistics, this function can be used for a variety of things, including hypothesis testing.
- Generic Syntax
NORMDIST(x,mean,standard_dev,cumulative)
- Argument Description
| ARGUMENT | REQUIREMENT | EXPLANATION |
|---|---|---|
| x | Required | The supplied value to calculate the distribution |
| mean | Required | It indicates the arithmetic average of the distribution |
| standard_dev | Required | This Argument describes the standard deviation of the distribution |
| cumulative | Required | Basically, it’s a logical value. It decides the form of the function. Gives cumulative distribution function if the value is TRUE. Gives probability mass function if the value is FALSE. |
- Returns
Returns the normal distribution from the specified mean and standard deviation.
- Available in
In Excel 2010, the NORMDIST function was replaced by the NORM.DIST function. The NORM.DIST function is more precise than the NORMDIST function. In Excel 2010, the NORMDIST function is still available. It is saved in the compatibility functions list to allow compatibility with older Excel versions.
NORMDIST Function in Excel: 2 Applications
First and foremost, we will introduce the dataset that we will use for this article. In this case, we have a dataset of share prices and their corresponding Normal Distribution value. Moreover, we have the mean and standard deviation of the share price. The dataset is given in the image below:
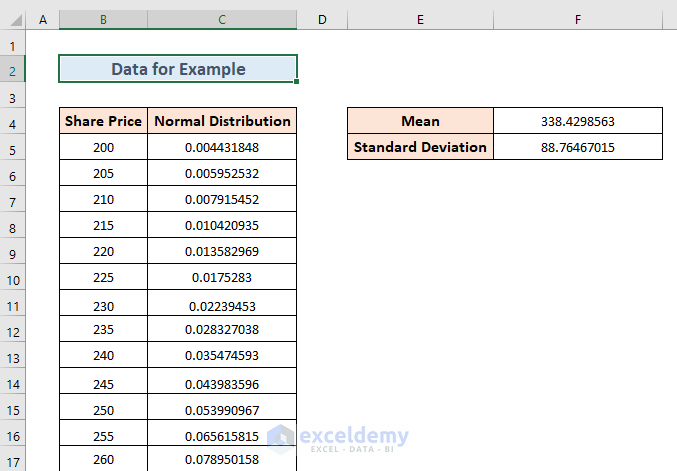
Therefore, if we plot a graph of Share Price against Normal Distribution, the graph will look like the following figure.

1. Use of NORMDIST Function to Calculate the Cumulative Distribution of a Dataset
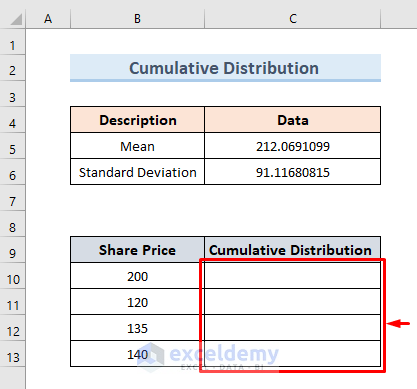
A Cumulative Distribution Function (CDF) describes the probability that a random variable takes on a value less than or equal to some number. For example, we will use our example dataset to calculate the Cumulative Distribution for the first four data of the share price column.
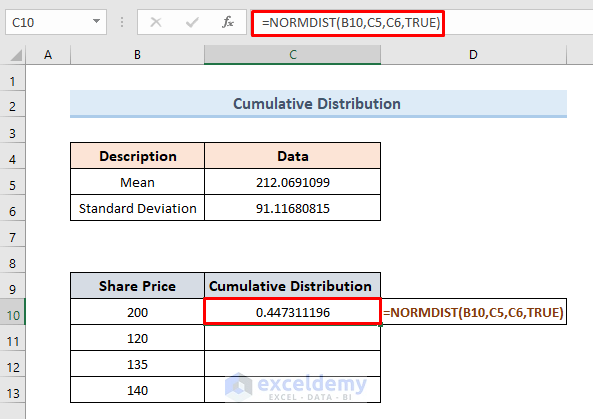
- Firstly, select cell C10 and insert the following formula:
=NORMDIST(B10,C5,C6,TRUE)- Next, press Enter.
- Then, we can see the value of Cumulative Distribution for share price 200 in cell C10.
- Finally, by inserting the following formulas for all the other values of share prices, we will get the corresponding cumulative distributions.

1.1 Smaller Than a Particular Value
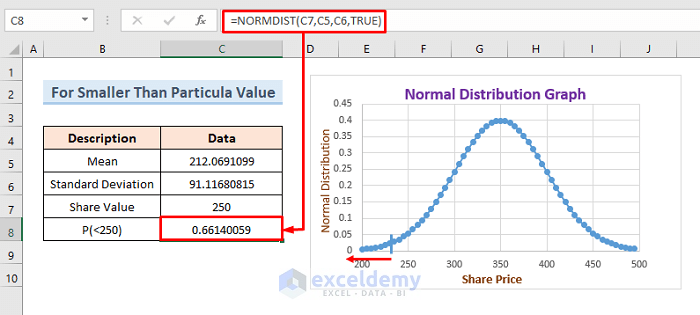
Now, let us just think we want to calculate a cumulative distribution for the values less than 250. Let’s see how we can do this:
- Firstly, select cell C8 and insert the following formula:
=NORMDIST(C7,C5,C6,TRUE)- Then press Enter. We will get the cumulative distribution for values smaller than 250.
The following graph is an illustration of the region of cumulative distribution for the share prices less than 250.
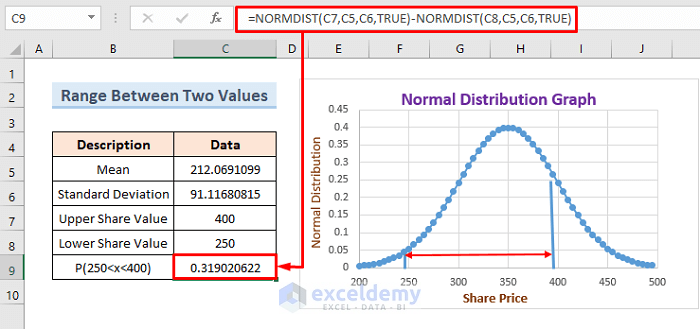
1.2 Between the Range of Two Values
In this example, we will calculate cumulative distribution between the range 250 to 400. Just do the following steps:
- Firstly, select cell C9 and insert the following formula:
=NORMDIST(C7,C5,C6,TRUE)-NORMDIST(C8,C5,C6,TRUE)Here, this formula subtracts the value of the cumulative distribution of cell C7 from the value of cell C8.
- Next, press Enter, and we will get the value of cumulative distribution from the range 250 to 400. Besides the data table, we can see the graph showing the region for cumulative distribution.
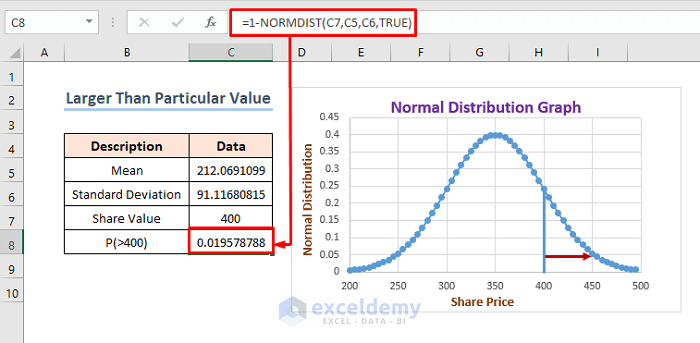
1.3 Greater Than a Particular Value
In this case, we will calculate the cumulative distribution for the values greater than 400. Let’s see how we can do this:
- Firstly, select cell C8 and insert the following formula:
=1-NORMDIST(C7,C5,C6,TRUE)Here, this formula subtracts the value of the cumulative distribution of cell C7 from 1.
- Next, press Enter, and we can see the cumulative distribution for the values greater than 400. Here, the graph shows the region of cumulative distribution for values greater than 400.
2. NORMDIST Function in Excel to Calculate Probability Mass Function
For this example, we will consider the syntax of the NORMDIST function for Cumulative Distribution. Then, put the cumulative argument value FALSE in place of TRUE. As a result, we will get the probability mass function for the data.
In this example, we will calculate the probability mass function for the first four values of the share price of our example data. Just follow the simple steps to do this.
- Firstly, select cell C10 and insert the following formula:
=NORMDIST(B10,C5,C6,FALSE)- Next, press Enter, and you will get the value Probability Mass Function for share price 250 in cell C10.
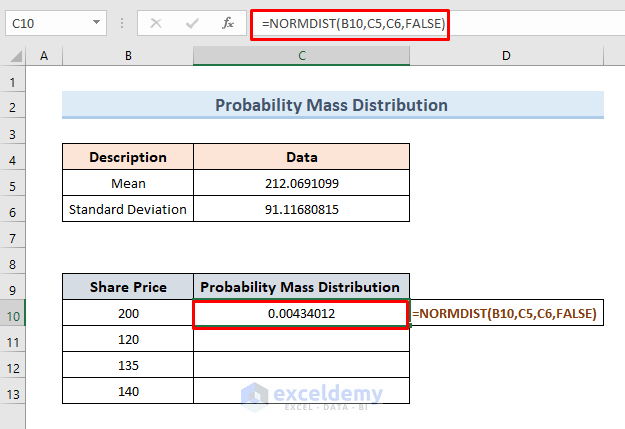
- Finally, insert the following formulas of the below image for the corresponding values of share prices. As a result, we will get the probability mass distribution for the other values of share prices.

Errors While Using Excel NORMDIST Function
While using the NORMDIST function, we can experience the following two kinds of errors.
1. #NUM! Error
If the Standard Deviation is blank, less than or equal to zero, the NORMDIST function returns ‘#NUM! Error’. Let’s see with examples:
- Firstly, select cell C12 and insert the following formula.
=NORMDIST(B13,C5, ,FALSE)In the formula, we will keep the Standard Deviation argument Blank.
- Next, press Enter, and we will get the #NUM! Error in cell C12.

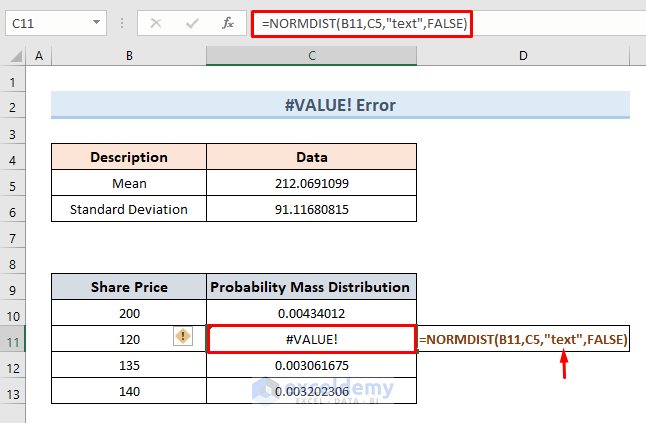
2. #VALUE! Error
If any of the supplied inputs is a non-numeric value, the NORMDIST function produces a #VALUE! error. Let’s see an example with the following dataset we used previously for calculating Probability Mass Distribution.
- Firstly, select cell C11 and insert the following code:
=NORMDIST(B11,C5,"text",FALSE)We will use a Text Character in place of the Standard Deviation argument.
- Then, press Enter, and we will get the #VALUE! Error in cell C11.
Download Practice Workbook
You can download the practice workbook from here.
Conclusion
In the end, in this article, we have tried to make clear the concept of NORMDIST function to you. For a better experience download our practice workbook added to this article and practice yourself. If you feel any confusion, just leave a comment in the box below.
<< Go Back to Excel Functions | Learn Excel
Get FREE Advanced Excel Exercises with Solutions!

You are confusing Probability Mass Function with Probability Density Function.
Probability Mass Function = Discrete Values
Probability Density Function = Continuous Values
Cumulative Distribution Function = Continuous Values
NORM.DIST(..,..,..,FALSE) = Probability Density Function and NOT Probability Mass Function
NORM.DIST(..,..,..,TRUE) = Cumulative Distribution Function
Thank you Brian for your comment.
Actually, we believe you are right. However, in Excel the NORMDIST function shows the probability mass function when it is set to False. We have kept the original naming as it.
Moreover, if you go through the official documentation, you will notice it is written as “density function” in the latter part. So, chances are it may be displayed as ”probability mass function” but actually it is calculating the ”continuous values”.