Method 1 – Using the NORM.DIST Function
Steps:
- Select cell F4 and enter the following formula:
=AVERAGE(C5:C11)- Press Enter.
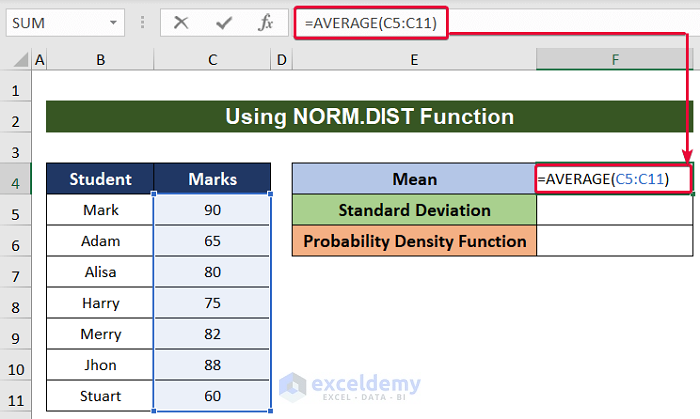
- We will get the mean of the values.
- Choose the F5 cell and enter the following:
=STDEV(C5:C11)- Press Enter.
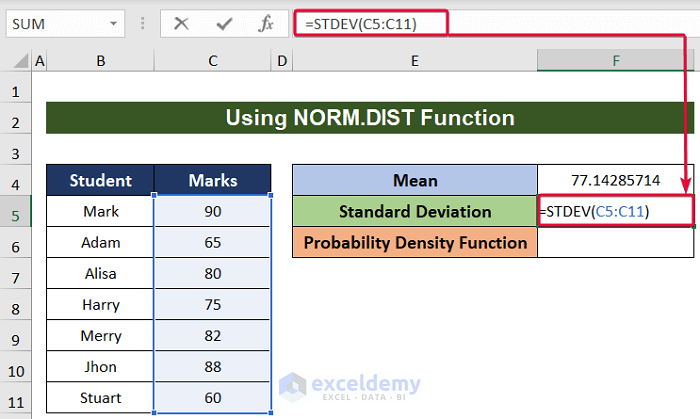
- We will get the standard deviation of the data.
- Click on cell F6 and enter the following formula:
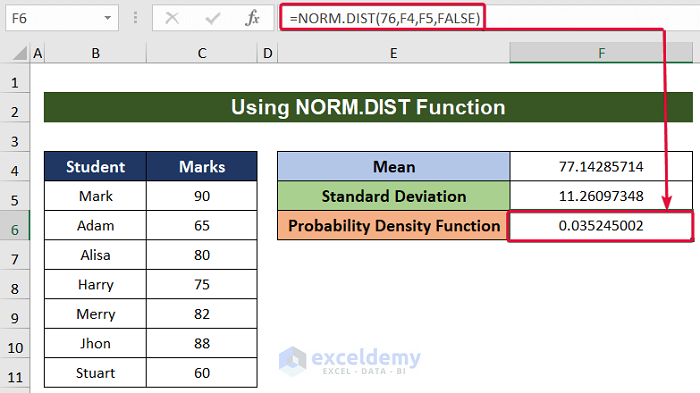
=NORM.DIST(76,F4,F5,FALSE)- Press Enter.
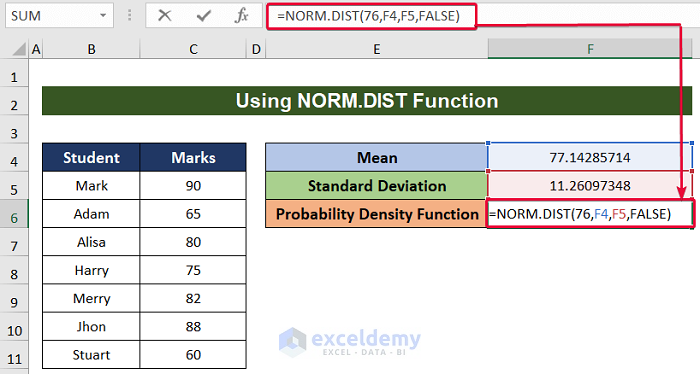
- We will get the Probability Density Function for the value 76 according to the data available.
Read More: How to Calculate Empirical Probability with Excel Formula
Method 2 – Applying the NORM.S.DIST Function
Steps:
- Select cell C6 and enter the following formula:
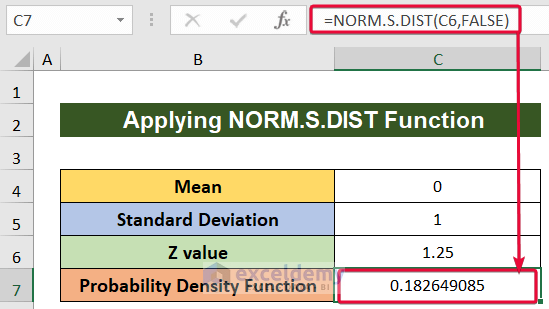
=NORM.S.DIST(C6,FALSE)- Press Enter.
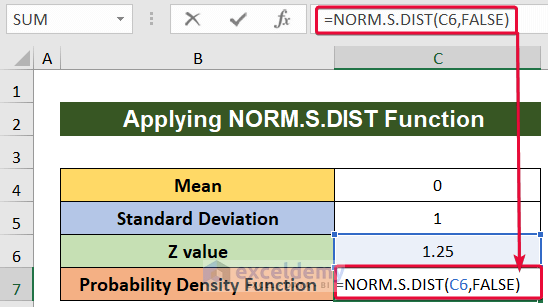
- We will get the probability density function for the Z- value 1.25 from the standard normal distribution.
How to Make Cumulative Distribution Graph in Excel
Steps:
- Select cell D5 and enter the following:
=AVERAGE(C5:C11)- Press Enter.
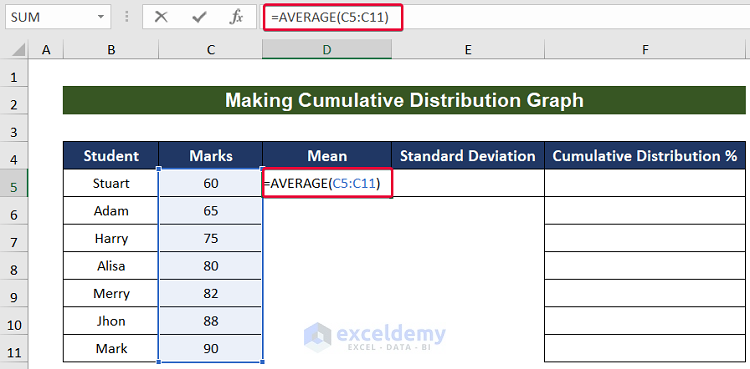
- We will get the mean of the values.
- Select cell E5 and enter the following formula:
=STDEV(C5:C11)- Press Enter.
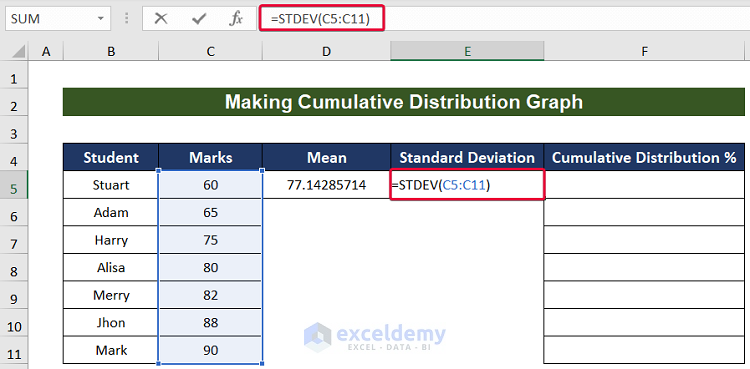
- We will get the standard deviation of the values.
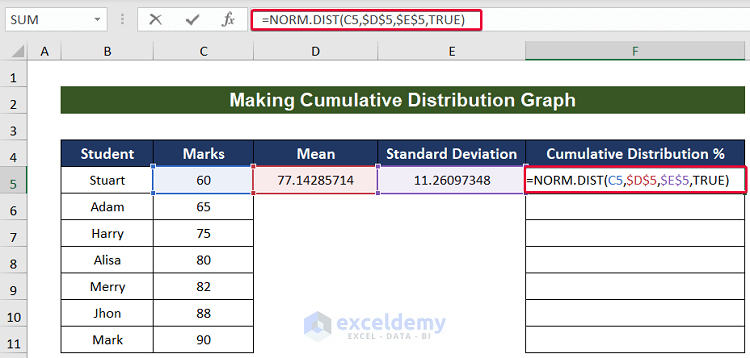
- Choose cell F5 and enter the following formula:
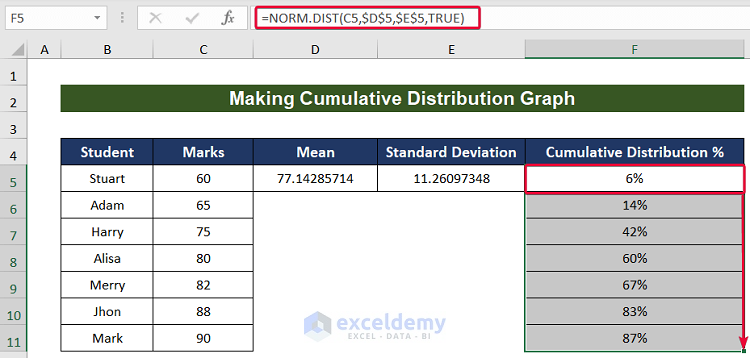
=NORM.DIST(C5,$D$5,$E$5,TRUE)- We will have our cumulative density function value for the value in cell C5.
- Convert it from general to percentage format.
- Lower the cursor to autofill the rest of the cells.
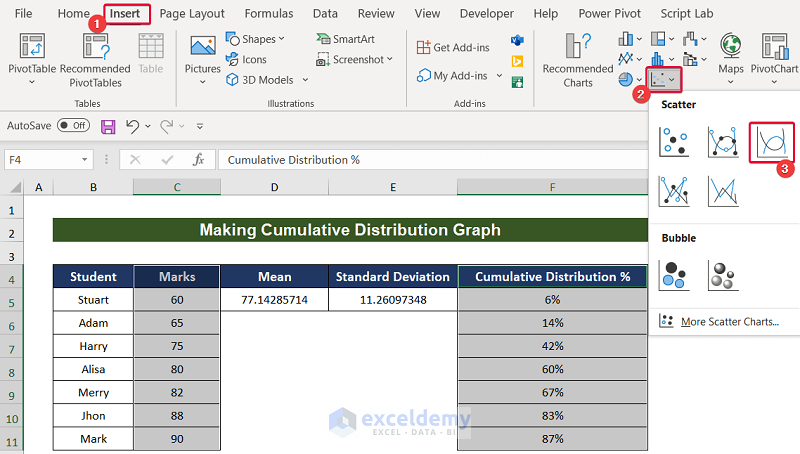
- Select the Marks and Cumulative Distribution columns.
- Go to the Insert tab.
- From the Charts option, select Insert Scatter or Bubble Chart.
- Select any of the scatter charts suitable for you.
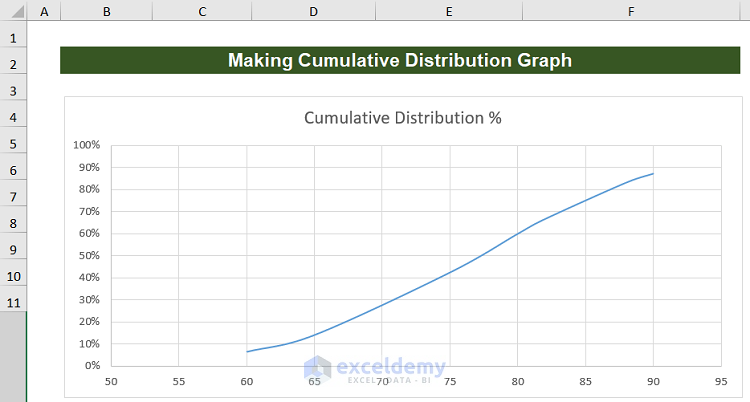
- We will have the Cumulative Distribution graph for the data.
Read More: How to Calculate Cumulative Probability in Excel
Download the Practice Workbook
You can download the practice workbook here.
Related Articles
- Probability Formula for Lottery in Excel
- How to Apply Weighted Probability in Excel
- How to Create Option Probability Calculator in Excel
- How to Get Simulation Probability in Excel
<< Go Back to Excel Probability | Excel for Statistics | Learn Excel
Get FREE Advanced Excel Exercises with Solutions!
