
Microsoft Excel has been the go-to tool for business data analysis for decades. However, as data volumes exploded and analytical needs became more complex, Microsoft developed three game-changing extensions: Power Query, Power Pivot, and Power BI. These Power Tools have revolutionized data management and analysis, turning Excel into a robust analytics and business intelligence platform.
This article dives into understanding what Power Query, Power Pivot, and Power BI are, highlighting their differences, niches, and practical use cases.
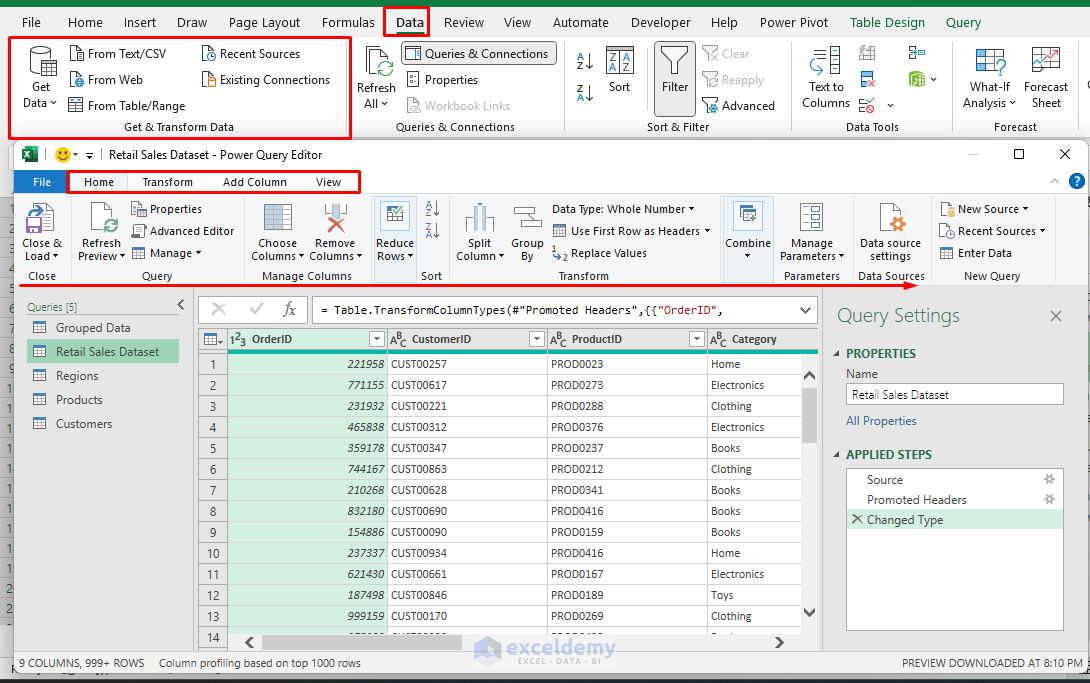
Power Query: Your Data Transformation (Cleaning) Superhero
Power Query is Excel’s powerful ETL (Extract, Transform, Load) tool for data connection, cleaning, and shaping. Power Query is like having a personal data assistant that:
- Connects to diverse data sources (CSV, Excel, databases, web, etc.).
- Cleans and transforms data with a user-friendly GUI.
- Transforms chaotic information into organized datasets.
- Remember your steps and repeat them automatically
- Automates repetitive data preparation tasks.
Niche:
- Best suited for data preparation tasks, particularly when working with large, complex, or messy datasets.
- Sales reports in different formats from each region.
- Customer data is scattered across multiple systems.
- Financial information that arrives as PDFs.
- Inconsistent date formats, missing values, and duplicate entries.
Practical Use Case
Monthly Sales Reporting:
- Challenge: Five regional offices send sales data in different Excel formats.
- Solution: Power Query automatically combines all files, standardizes formats, and creates one clean dataset.
- Result: What took 4 hours of manual work now happens in 5 minutes.
E-commerce Analytics:
- Challenge: Product data from the inventory system, sales from Shopify, and reviews from the website.
- Solution: Power Query pulls data from all three sources and creates unified product performance reports.
- Result: Real-time insights instead of weekly manual updates.
Competitor Price Monitoring:
- Challenge: Tracking competitor prices across 20 websites manually.
- Solution: Power Query scrapes pricing data automatically and formats it for analysis.
- Result: Daily competitive intelligence without manual effort.
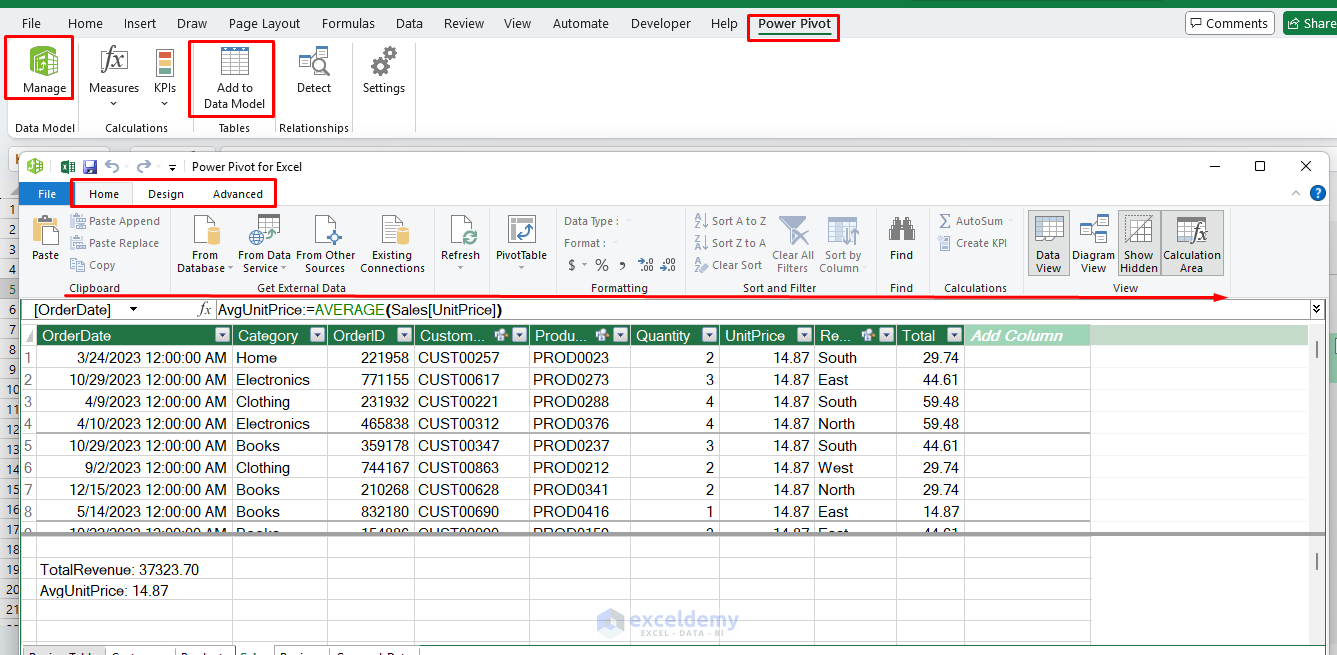
Power Pivot: Advanced Data Modeling
Power Pivot provides powerful data modeling capabilities, allowing advanced analytics within Excel. Power Pivot transforms Excel into a powerful analytical database that can:
- Manage large datasets efficiently within Excel.
- Handle millions of rows without slowing down.
- Creates relationships among different tables, enabling complex data models.
- Facilitates sophisticated calculations and analysis with DAX (Data Analysis Expressions).
- Build sophisticated data models like enterprise systems.
Niche:
- Ideal for handling large, complex datasets (more than 100,000 rows).
- Data is spread across multiple tables.
- Complex calculations involving multiple data sources.
- Analyzing data across multiple dimensions simultaneously.
Practical Use Case
Financial Performance Analysis:
- Challenge: Budget vs. actual analysis across 50 cost centers and 12 months.
- Data Sources: Budget spreadsheets, accounting system, payroll data.
- Solution: Power Pivot creates relationships between all data sources. Quickly generate advanced financial reports and performance dashboards.
- Result: Interactive variance analysis with drill-down capabilities.
Retail Chain Analytics:
- Challenge: Analyze sales performance across 200 stores, 10,000 products, and 2 years of data.
- Data Sources: POS systems, inventory management, and customer loyalty program.
- Solution: Power Pivot model with store, product, customer, and time dimensions.
- Result: Comprehensive retail analytics dashboard.
Supply Chain Optimization:
- Challenge: Optimize inventory across multiple suppliers and seasonal demand patterns.
- Data Sources: Inventory systems, supplier performance, sales forecasts, and weather data.
- Solution: The Power Pivot model calculates optimal stock levels and reorder points.
- Result: It will show reductions in carrying costs while improving service levels.
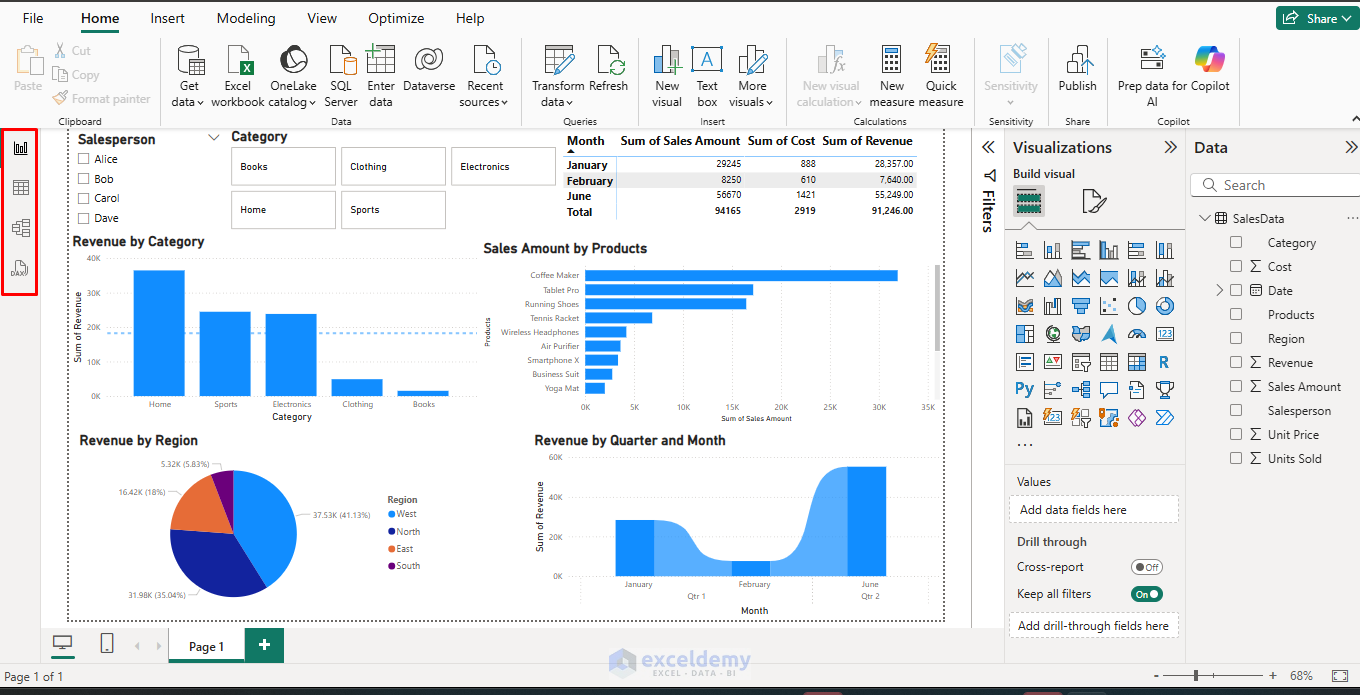
Power BI: Comprehensive Business Intelligence
Power BI extends Excel’s capabilities to deliver interactive visualizations and comprehensive business intelligence dashboards. Power BI is your visual storytelling platform that:
- Connects, transforms, and models data from a wide range of sources.
- Provides powerful and interactive data visualization and reporting.
- Creates stunning, interactive dashboards.
- Share insights across your organization.
- Updates automatically with live data.
- Makes complex data accessible to non-technical users.
Niche:
- Suited for advanced data visualization.
- Interactive reporting and enterprise-level business intelligence.
- Executive dashboards and KPI scorecards.
- Sharing insights with non-technical stakeholders.
- Mobile-friendly business intelligence.
- Real-time monitoring and alerts.
Practical Use Case
Sales Performance Dashboard:
- Users: Sales managers, regional directors, VP of Sales.
- Content: Pipeline health, quota attainment, territory performance.
- Features: Drill-down from company to individual rep level. Gaining immediate insights and making informed decisions swiftly.
- Result: Improvement in sales forecast accuracy.
Manufacturing Operations Monitor:
- Users: Plant managers, quality control, maintenance teams.
- Content: Equipment efficiency, quality metrics, maintenance schedules.
- Features: Real-time alerts for equipment issues.
- Result: Reduction in unplanned downtime.
Customer Service Analytics:
- Users: Service managers, agents, executives.
- Content: Response times, satisfaction scores, and case volumes.
- Features: Real-time monitoring with mobile alerts.
- Result: Improvement in first-call resolution rates.
How These Tools Work Together
The Power Tools Workflow:
The magic happens when you use these tools as an integrated system:
- Power Query → Prepares your data.
- Power Pivot → Models and analyzes the data.
- Power BI → Visualizes and shares the insights.
A supply chain manager can use all three tools together seamlessly.
- Power Query extracts and cleans shipment data.
- Power Pivot models relationships between suppliers, products, and deliveries.
- Power BI visualizes the data, allowing stakeholders to monitor real-time inventory, identify delays, and manage logistics efficiently.
Key Differences Among Power Query, Power Pivot, and Power BI:
- Power Query is primarily for data ingestion and preparation.
- Power Pivot focuses on data modeling, handling extensive relationships, and performing advanced calculations.
- Power BI combines these functions but excels in visualization, interactivity, collaboration, and web-based publishing.
Conclusion
Understanding these Excel Power Tools and their distinct capabilities enables you to effectively utilize them to streamline data processes, enhance analysis, and deliver impactful insights. Whether your goal is data preparation, sophisticated modeling, or interactive visualization, selecting the right tool or combining them strategically is key to achieving powerful analytics outcomes. Start with your biggest data pain point, choose the right tool, and build from there. Your future self will thank you. Success comes from understanding which tool solves which problem, not from mastering every feature.
Get FREE Advanced Excel Exercises with Solutions!

There is lot of learning from this knowledgeable article.
Hello Mohammad Afzal,
Thank you for your feedback and appreciation. Glad you found the article helpful. If you have any questions about Power Query, Power Pivot, or Power BI, feel free to ask. Happy learning!
Regards
ExcelDemy