In mathematics, we are very familiar with the term empirical probability. We use it to count the occurrence of certain events with a simple formula. The empirical probability formula is widely used in business forecasting. In Excel, we can easily calculate empirical probability with a formula. Therefore, in this article, we will guide you on how to calculate empirical probability with the formula in Excel discussing 4 examples.
What Is Empirical Probability Formula?
Empirical Probability Formula refers to the ratio of the number of outcomes to the total experiments performed. It shows the result of a particular event happening based on a certain number of trials, not on pre-conceived ideas.
It is mostly conceived in the business sector to determine profit and loss for a newly introduced product. Even in the government sector, we use the empirical probability formula to predict public acceptance of new policies.
The formula for empirical probability is given below:
Theoretical vs. Empirical Probability
As we know the empirical probability now, let us dive into the difference between theoretical and empirical probability. Before that, we need to know the theoretical probability. It is defined as the ratio of the number of outcomes to the total number of possible outcomes. The formula is stated as follows:
Now we can certainly identify the difference between the two of them. If you want output based on specific conditions then you will need to apply the theoretical probability formula. On the other hand, if you need to get all the outcomes, you should go with the empirical probability formula. Empirical probability arrives at results through solid test-based evidence, while theoretical probability is based on established mathematical ideas.
How to Calculate Empirical Probability with Formula in Excel: 4 Examples
Now let us see some examples to calculate empirical probability with a formula. Each of them will consider different scenarios for calculation.
1. Apply Empirical Probability Formula in Excel While Tossing 1 Coin
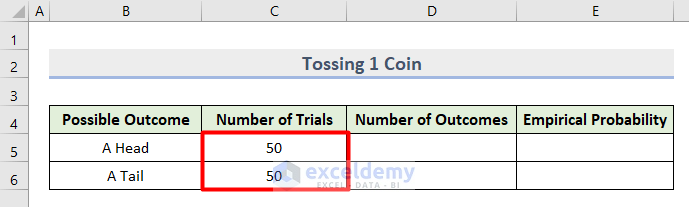
Let us assume, we will toss a coin 50 times. There will be 2 possible outcomes- Head or Tail. Now let’s calculate each of its occurrences with the empirical probability formula.
- First, insert the number 50 in the cell range C5:C6 as the Number of Trials.
- Then, type 35 in cell D5 assuming the Head will occur 35 times during those 50 tosses.
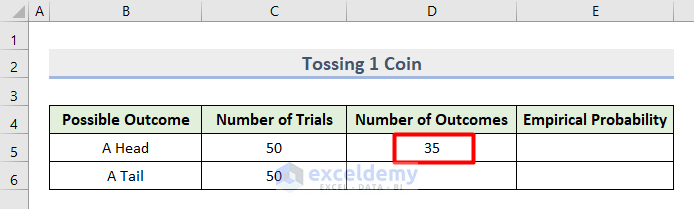
- Therefore, type this formula in cell D6 to get the Number of Outcomes of the Tail.
=C6-D5
- Followingly, hit Enter to see the output.

- Now, insert this formula in cell E5 to get the empirical probability of the occurrence of a head.
=D5/C5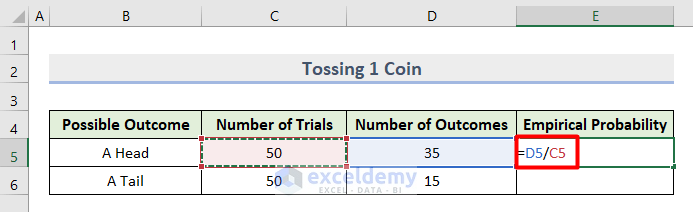
- Afterward, type this formula in cell E6 to get the empirical probability of the tail.
=D6/C6
- Finally, we got the empirical probability of Head and Tail when we toss a coin.

Read More: How to Get Simulation Probability in Excel
2. Toss 2 Coins Simultaneously to Get Empirical Probability
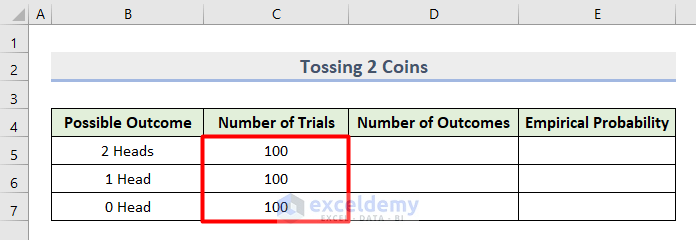
In this example, we will consider tossing 2 coins simultaneously 100 times. During this trial, we will find the empirical probability of getting 2 Heads, 1 Head, and No Head. Let’s see the process below.
- First, insert 100 as the Number of Trials in the cell range C5:C7.
- Then, type 35 and 30 as the number of outcomes for 2 heads and 1 head respectively in the cell range D5:D6.
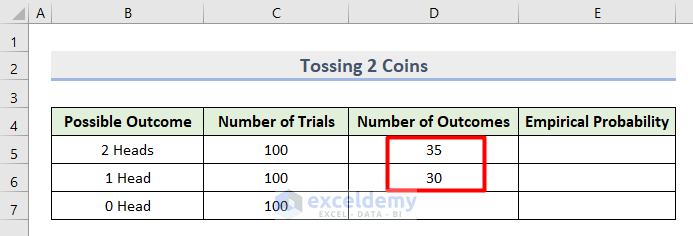
- Following, type this formula in cell D7.
=C7-(D5+D6)
- After this, hit Enter to get the number of outcome of no head.

- Next, insert the empirical probability formula in cell E5.
=D5/C5
- Lastly, apply the Autofill command to get the final outcome.

Read More: How to Apply Weighted Probability in Excel
3. Calculate Frequency of Empirical Probability Tossing 3 Coins
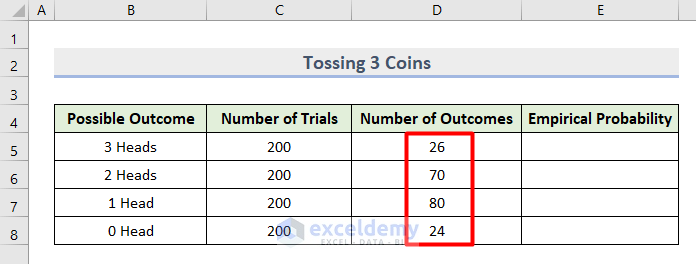
In this example, we will toss 3 coins 200 times simultaneously. Then, we will try to calculate the frequency of occurrence of 3 heads, 2 heads, 1 head, and 0 head with the empirical probability formula. Let’s see how it works.
- In the beginning, type 200 in the cell range C5:C8 as the Number of Trials.

- Following, insert the Number of Outcomes in the cell range D5:D8 as shown in the image.
- Now, type this formula in cell E5.
=D5/C5
- Then, hit Enter.
- Lastly, apply this formula in the cell range E6:E8 to get the empirical probability of all the possible outcomes.

4. Experiment of Rolling Dice with Empirical Probability Formula in Excel
In this last example, let us assume a scenario where we will roll a dice 180 times. During these trials, there will be possible outcomes of 6 dots, 5 dots, 4 dots, 3 dots, 2 dots and 1 dot for a total 6 dot dice. Now we will apply the empirical probability formula to each of them. Let’s go through the process below.
- First, type 180 in the cell range C5:C10 as the Number of Trials.
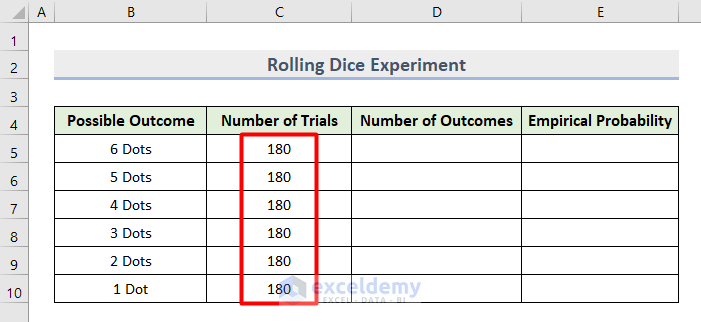
- Then, type the expected Number of Outcomes in the cell range D5:D10 like this.

- Now, insert this formula in cell E5 to get the empirical probability of occurring 6 dots.

- Lastly, press Enter and then apply the AutoFill command to get this final output.

Read More: How to Calculate Probability Density Function in Excel
Things to Remember
- The value of the empirical probability will always lie between 0 and 1. If the result is 0, then it determines that the event is an impossible one. Otherwise, it will be a certain event when the output is 1.
- The output of empirical probability is always numeric as it shows the ratio between two values.
Download Practice Workbook
Download the sample file and practice by yourself.
Conclusion
Finally, we are at the end of our article on how to calculate empirical probability with the formula in Excel with 4 examples. Let us know your insightful suggestion on this tutorial in the comment box.
Related Articles
- Probability Formula for Lottery in Excel
- How to Create Option Probability Calculator in Excel
- How to Make a Probability Tree Diagram in Excel
<< Go Back to Excel Probability | Excel for Statistics | Learn Excel
Get FREE Advanced Excel Exercises with Solutions!
