In this Excel tutorial, we provide a comprehensive look at ANOVA in Excel. We will demonstrate how to enable the Data Analysis feature and use it to perform One-way as well as Two-way ANOVA. We will also discuss how to interpret ANOVA results.
Note: We used Microsoft 365 to prepare this article, but the operations apply to all versions.

Download Practice Workbook
What Is ANOVA?
ANOVA is the acronym for Analysis of Variance. It is a statistical test that separates variance into different components so that they can be used in further tests. It helps to assess whether the means of different groups are significantly different or if the observed differences are due to random chance. There are several types of ANOVA. In this article, we will discuss 2 types:
- One-Way ANOVA
- Two-Way ANOVA
What Are One-Way and Two-Way ANOVA in Excel?
- One-Way ANOVA: The one-way ANOVA determines whether there is a significant difference between the mean of three or more groups. It is called one-way because it involves only one factor. A one-way ANOVA cannot tell you which specific groups are statistically different from each other, but it can tell you which two groups are.
- Two-Way ANOVA: Two-way ANOVA is a statistical technique used to analyze the effects of two categorically independent variables on a continuous dependent variable. The basic difference between one-way ANOVA and two-way ANOVA is the number of independent variables.
How to Enable Data Analysis ToolPak in Excel?
To perform ANOVA, we need the Data Analysis tool pack, which is not enabled by default in Excel.
To add the Data Analysis ToolPak manually:
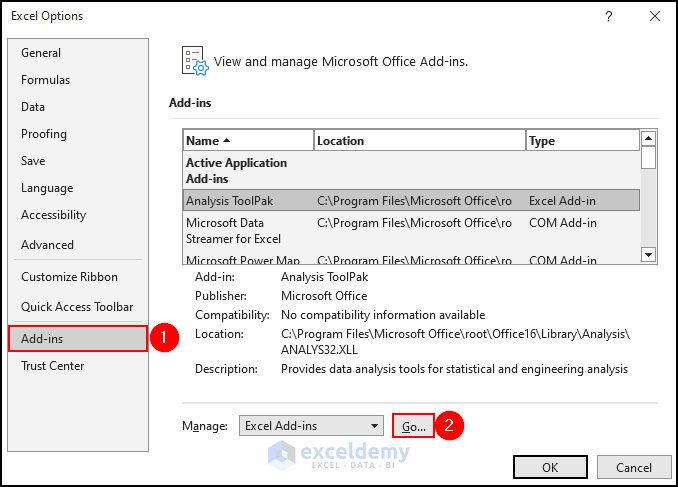
- Press the keyboard shortcut ALT + F + T to open the Excel Options dialog box.
- Go to Add-ins >> click on Go.
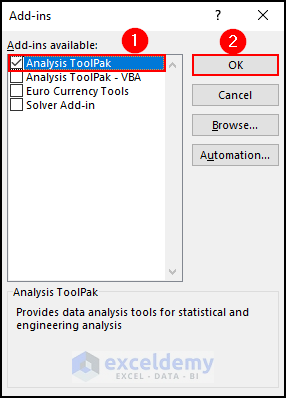
- Check the Analysis ToolPak checkbox and click OK.
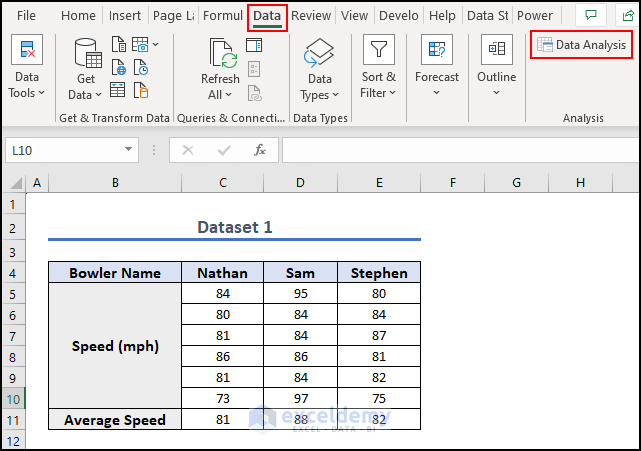
- To check, go to the Data tab.
The Data Analysis option should appear at the top right side of the Ribbon.
How to Perform One-Way ANOVA Test in Excel?
In the following dataset, we have the bowling Speed of 3 Bowlers and their Average Speed. There is only one variable that influences bowling speed, namely the bowler.
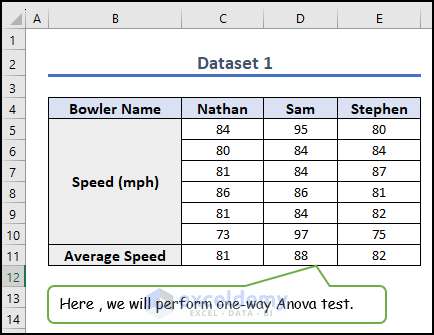
Let’s perform a One-Way ANOVA test in Excel on this dataset.
Steps:
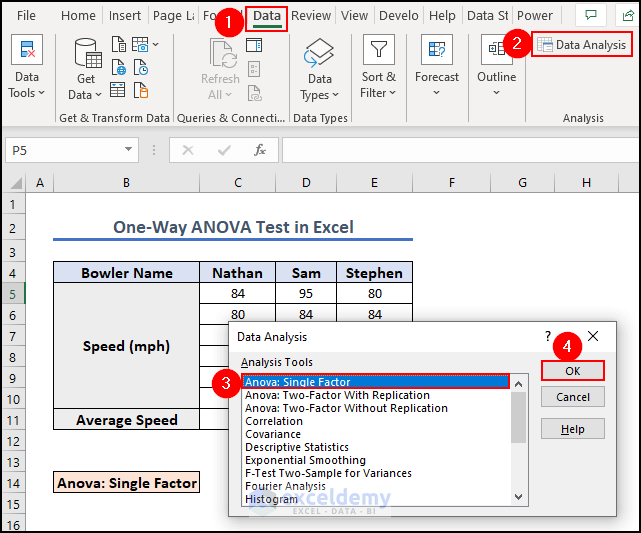
- Go to the Data tab >> click on Data Analysis.
- Choose Anova: Single Factor from the Data Analysis dialog box that opens.
- Click OK.
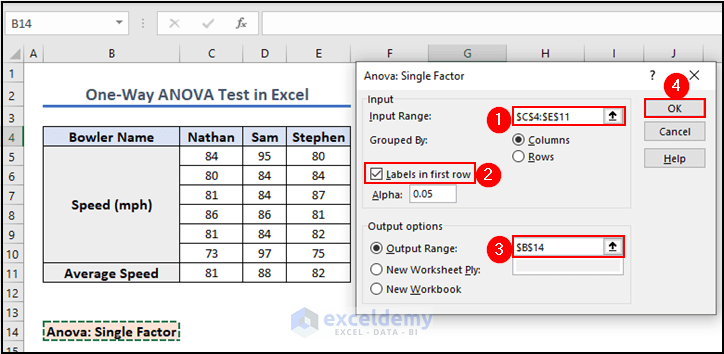
- Click on the Input Range box to input cells C4:E11.
- Check the Labels in first row box.
- Click on the Output Range box and select cell B14 to display the output.
- Click OK.
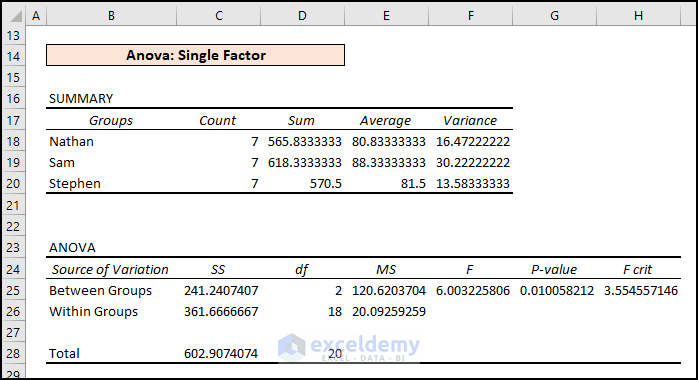
The outputs of the ANOVA test are generated, like in the following picture.
How to Do a Two-Way ANOVA Test in Excel?
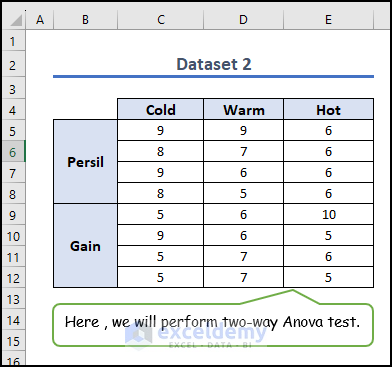
Now let’s perform a two-way ANOVA test. In the following dataset, we compare the amount of dirt removed by two different brands of detergent at three different temperatures. Dirt removal is dependent on two factors: the detergent brand and the water temperature.
Steps:
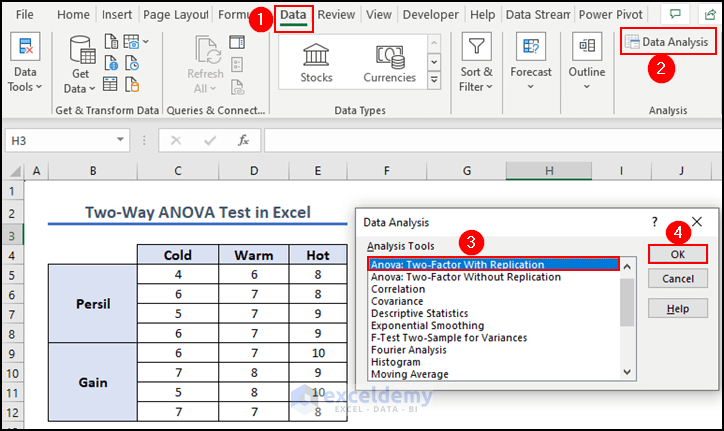
- Go to the Data tab >> click on Data Analysis.
- Choose Anova: Two-Factor With Replication from the Data Analysis dialog box that opens.
- Click OK.
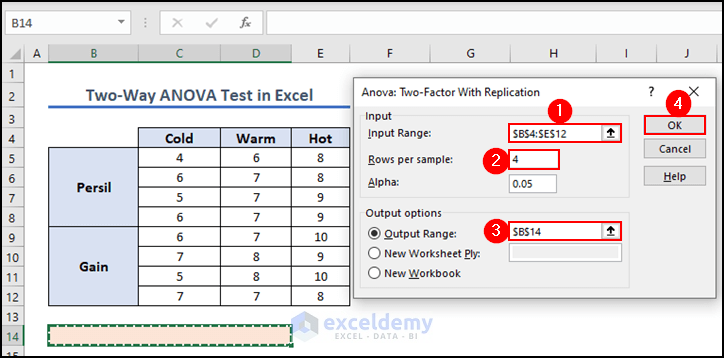
- Click on the Input Range box to input cells B4:E12.
- Input 4 in the Rows per sample text box.
- Click on the Output Range box and select cell B14 to display the output.
- Click OK.
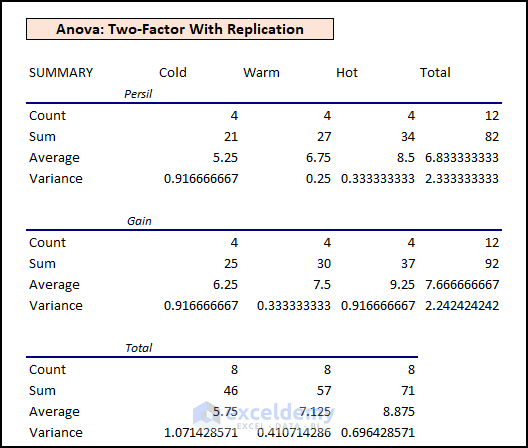
The outputs of the ANOVA test are generated like in the following picture.
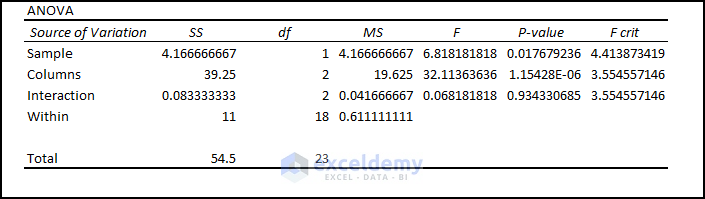
And here is the ANOVA part after performing a two-way ANOVA test:
How to Interpret ANOVA Results in Excel?
We can use multiple components of an ANOVA Analysis to interpret the results.
Example 1 – Interpreting One-Way ANOVA Test Result
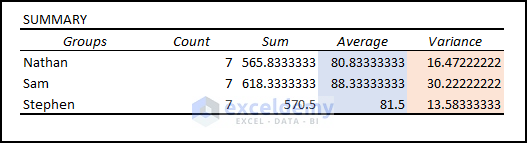
Executing ANOVA: Single Factor Analysis helps determine if there is a statistically significant difference between the means of 3 or more independent samples (or groups). We received results like the picture below after performing a one-way ANOVA test.

- Parameters: Anova Analysis determines the Null Hypothesis’s applicability in the data. Different result values from the Anova Analysis outcome can pinpoint the Null Analysis status.
- Average and Variance: From the Summary, we can see both the highest average (i.e., 88.333) and highest variance (30.222) are for Sam.
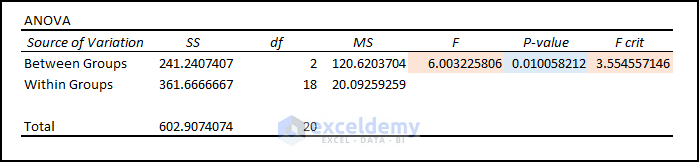
- Test Statistic (F) vs. Critical Value (FCrit): Anova results showcase Statistic (F= 6.00) > Critical Statistic (FCrit=3.55). Therefore, the data model rejects the Null Hypothesis.
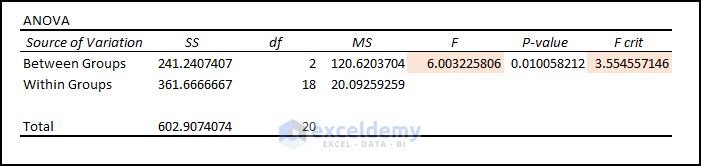
- P-Value vs. Significance Level (a): Again, from the ANOVA outcomes, P-Value (0.010058) < Significance Level (a = 0.05). So, we can say that the means are different and reject the Null Hypothesis.
Example 2 – Interpreting Two-Way ANOVA Test Result
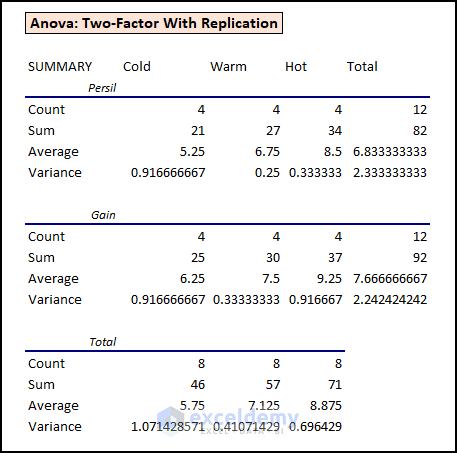
As we know, ANOVA: Two-Factor with Replication evaluates the difference between the means of more than two groups. We got results like the screenshot below after performing a two-way ANOVA test. This is the summary part of the two-way ANOVA test result:
And here is the ANOVA part of the two-way ANOVA test result:
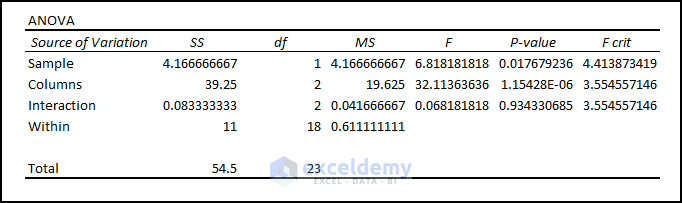
- Parameters: P Value only acts as the parameter for the rejection or acceptance of the Null Hypothesis.
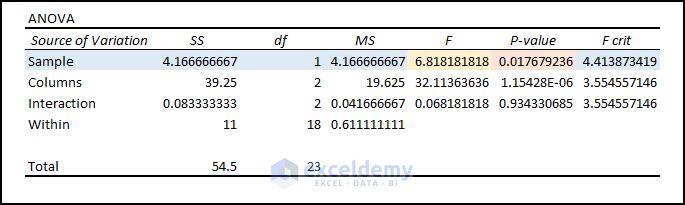
- Variable 1 Significant Status: Variable 1 (i.e., Sample) has a P-Value (i.e., 0.017679) which is not greater than the Significance Level (i.e., 0.05). Thus, Variable 1 rejects the Null Hypothesis.
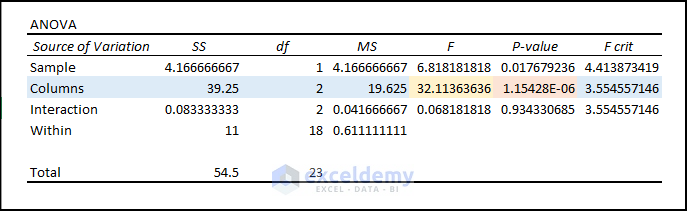
- Variable 2 Significant Status: Variable 2 (i.e., Columns) has a P-Value (i.e.1.1542) which is greater than 0.05. In this case, Variable 2 falls under the Null Hypothesis.
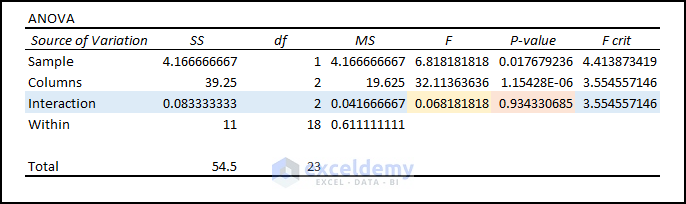
- Interaction Status: Variables 1 and 2 don’t have any interaction as P Value (i.e., 0.934) is more than the Significance Level (i.e., 0.05).
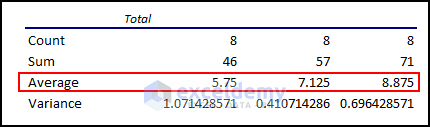
- Mean Interaction: Among the means for Persil and Gain, Gain has the highest mean. But these mean values don’t tell whether this comparison is significant or not. In this case, we can look at the mean values for Cold, Warm, and Hot waters.
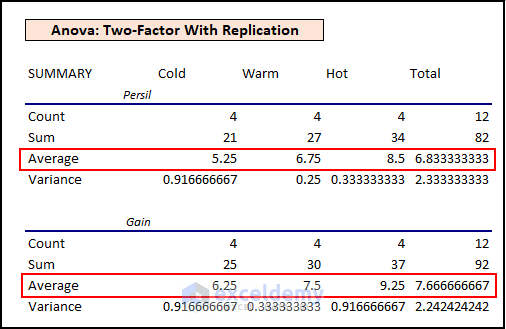
The mean values of Cold, Warm, and Hot waters have greater values for Hot.
Also, there are no significant interaction effects as the entries seem to be random and repetitive within a range.
Things You Need to Remember
- ANOVA is suitable when you have three or more groups or levels to compare.
- ANOVA can be used with both balanced (equal sample sizes between groups) and unbalanced (unequal sample sizes) designs. Unbalanced designs may reduce test power. Interpret results carefully.
- To get the exact F Value, make sure that the first variance value is less than the second variance value.
Frequently Asked Questions
1. What is the difference between ANOVA and t-test?
ANOVA is used when there are more than two groups or levels to compare whereas the t-test is used when there are only two groups to compare.
2. What is a P-value in ANOVA?
In ANOVA, the p-value indicates the probability that the observed differences across groups or levels are due to random chance. It enables researchers to determine whether the differences are statistically significant enough to reject the null hypothesis.
3. What is an F-value in ANOVA?
The F-value in ANOVA reflects the ratio of between-group variability to within-group variability. It is used to assess the overall significance of variations between the means of different groups or levels that are being compared.
ANOVA in Excel: Knowledge Hub
- Perform ANOVA in Excel
- Make an ANOVA Table
- One Way ANOVA
- Repeated Measures ANOVA
- Nested ANOVA
- Calculate p Value ANOVA
- Randomized Block Design ANOVA in Excel
- Two Factor ANOVA with Replication
- Two Factor ANOVA Without Replication
- Two Way ANOVA with Unequal Sample Size
- Interpret ANOVA Results in Excel
- Interpret Two Way ANOVA Results
<< Go Back to Excel for Statistics | Learn Excel
Get FREE Advanced Excel Exercises with Solutions!
