In this article, we will learn to use ANOVA two factor without replication in Excel. Microsoft Excel is a powerful tool and makes complicated calculations easy. We can perform different types of data analysis with the help of this application. ANOVA stands for Analysis of Variance. It helps us to find out whether the difference between two or more groups of data is significant or not. The two-factor ANOVA is a test where an outcome is determined depending on two predictor variables. Today, we will demonstrate step-by-step procedures to use ANOVA two-factor without replication. So, without further delay, let’s start.
What Is ANOVA Analysis?
ANOVA is a statistical method used to analyze variance observed within a dataset. To perform it, we need to divide the dataset into two sections- systematic and random factors.
ANOVA lets us determine which factors significantly impact a given set of data. After completing the analysis, an analyst usually performs extra analysis on the methodological factors that significantly impact the inconsistent nature of data sets. In that case, he needs to use the ANOVA findings to create extra data relevant to the estimated regression analysis. The ANOVA compares many data sets to see whether there is a link between them.
There are two types of ANOVA, one is a single factor and another is two factors. In a single factor, ANOVA finds the effect of one factor on a single variable. On the other hand, there are multiple dependent variables in two factors ANOVA.
How to Use ANOVA Two Factor Without Replication in Excel: Easy Steps
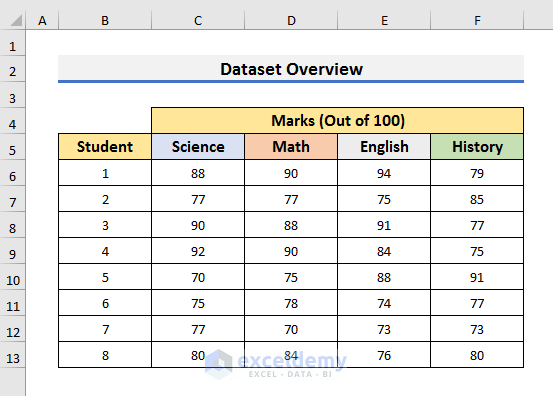
To explain the steps, we will use a dataset that contains information about the marks of 8 students in four different subjects. We will use this dataset to find if the four subjects have significant differences in means using two-factor ANOVA without replication.
STEP 1: Load Data Analysis ToolPak
- First of all, we need to load the Data Analysis ToolPak.
- To do so, click on the File tab.
- After that, select Options from the bottom left corner of the screen. It will open the Excel Options box.

- In the Excel Options window, go to the Add-ins section first.
- Then, select Analysis ToolPak.
- After that, select Excel Add-ins in the Manage box and click on the Go option. It will open the Add-ins box.

- In the Add-ins box, check Analysis ToolPak.
- Click OK to proceed.

STEP 2: Use Data Analysis Tool
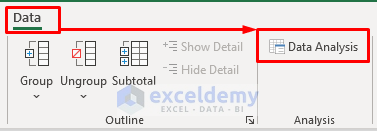
- Secondly, go to the Data tab and select the Data Analysis option.
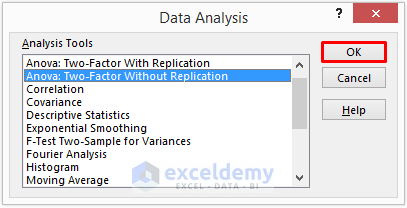
- In the Data Analysis box, select Anova: Two-Factor Without Replication and click OK to proceed.
STEP 3: Select Input Range
- Thirdly, you need to select the Input Range.
- For that purpose, enable editing in the Input Range box.
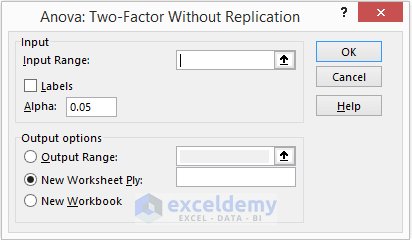
- Then, select the range that contains the dataset.
- Here, we have selected the range B5:F13.

- After that, check Labels and keep the Alpha value at 05.
- Click OK to move forward.

STEP 4: Review Summary Table
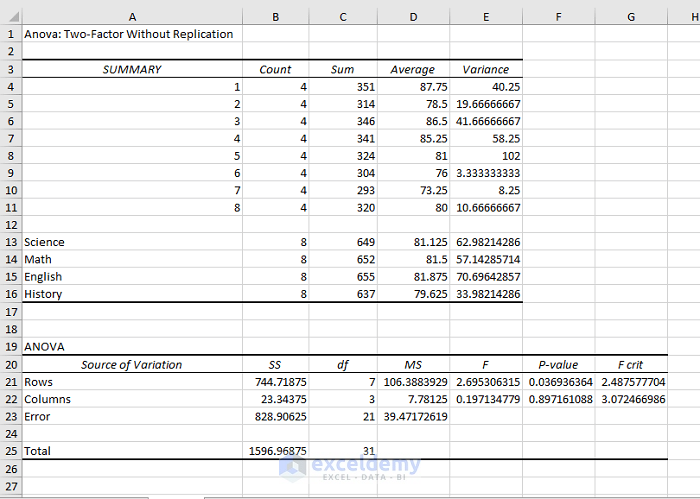
- After clicking OK, you will see a summary table in a new sheet like the picture below.
- It contains variances of the students and subjects.
- Also, you will get the ANOVA table.
- In the ANOVA table, you will get the P-value of the dataset.
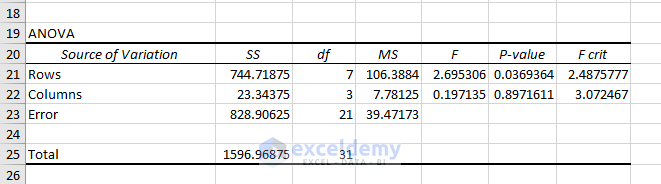
STEP 5: Evaluate Two Factor ANOVA Without Replication
- To evaluate two-factor ANOVA without replication, we need to take a closer look at the ANOVA table.
- Here, Rows refer to the marks of the students.
- In that case, P-value is 0.0369 which is less than the specified Alpha of 0.05. So, the null hypothesis is rejected.
- That is why there is a significant difference between the means of each student’s marks.
- Again, Columns refer to the four subjects of the marks.
- As P-value is greater than the Alpha of 05, so the null hypothesis is true.
- As a result, there is no significant difference between the means of the subjects.
Read More: How to Interpret Two-Way ANOVA Results in Excel
Download Practice Workbook
You can download the practice workbook from here.
Conclusion
In this article, we have demonstrated step-by-step procedures to Use ANOVA two factor without replication in Excel. I hope this article will help you to perform your tasks efficiently. Furthermore, we have also added the practice book at the beginning of the article. To test your skills, you can download it to exercise. Lastly, if you have any suggestions or queries, feel free to ask in the comment section below.
Related Articles
- How to Do Repeated Measures ANOVA in Excel
- How to Apply Rows Per Sample ANOVA in Excel
- Randomized Block Design ANOVA in Excel
- How to Do One Way ANOVA in Excel
- Two Way ANOVA in Excel with Unequal Sample Size
- How to Use Two Factor ANOVA with Replication in Excel
- How to Do Two Way ANOVA in Excel
<< Go Back to Anova in Excel | Excel for Statistics | Learn Excel
Get FREE Advanced Excel Exercises with Solutions!
