ANOVA or Analysis of Variance, is an amalgamation of multiple statistical models to find the differences in means within or between groups. Users can use multiple components of an ANOVA Analysis to interpret the results in Microsoft Excel. In this article, I will try to explain 2 easy methods on how to apply rows per sample ANOVA in Excel. If you are looking for simple and efficient ways to apply rows per sample ANOVA, I hope this article will be helpful for you.
How to Apply Rows Per Sample ANOVA in Excel: 2 Easy Methods
In order to perform analysis with two independent variables, we can apply Two-Way ANOVA feature. There are also two kinds of it. They are,
- Two-Way ANOVA With Replication
- Two-Way ANOVA Without Replication
ANOVA With Replication is more powerful than ANOVA Without Replication, meaning that it is more likely to detect a difference between the means of two groups, even if that difference is small. This is because replication provides more information about the variability of the data, which allows for more precise estimation of the population parameters.
Enable Data Analysis ToolPak
In order to apply Two-Way ANOVA, we need to able the Data Analysis feature first. If you don’t find the Data Analysis feature under the Data tab, you just need to follow the following steps to have it.
Steps:
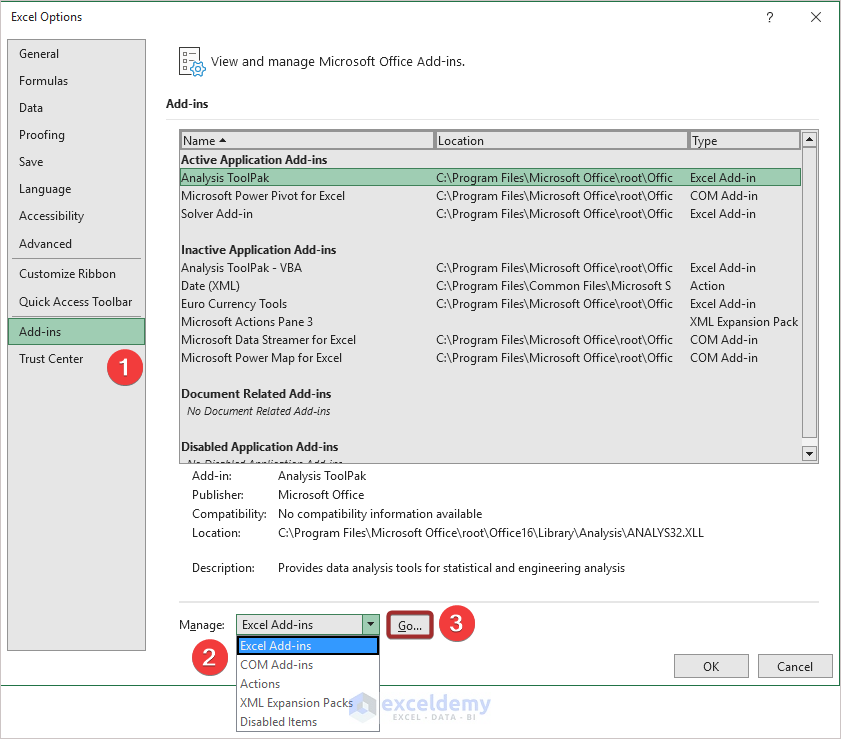
- Go to the File tab.
- From there, choose Options.

As a result, the Excel Options dialog will emerge.
- Then, go to the Add-ins option.
- After that, click Excel Add-ins from the Manage drop-down.
- Subsequently, press Go.
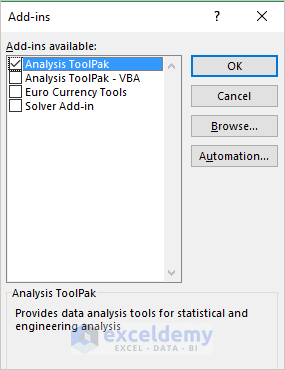
Consequently, the Add-ins dialog box will pop out.
- From there, check the box for Analysis ToolPak.
- Afterward, press OK.
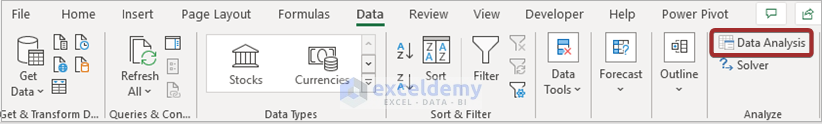
Thus, we can have the Data Analysis feature under the Data tab.
1. Use Rows Per Sample in Two-Way ANOVA With Replication
ANOVA: Two-Factor With Replication evaluates the difference between the means of more than two groups. Let’s follow the steps mentioned below to execute it..
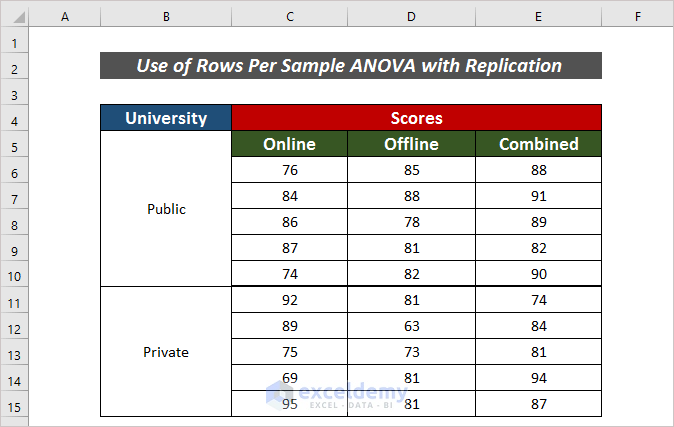
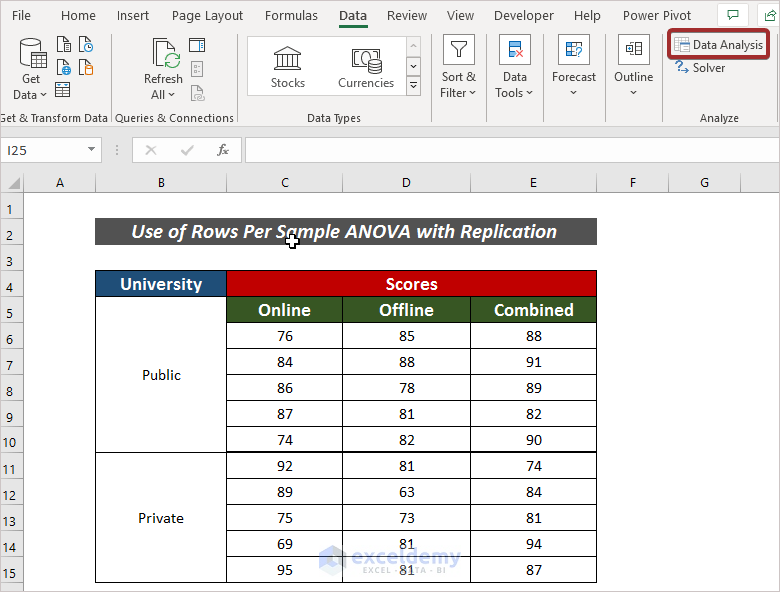
Step 1: Organise a Dataset to Interpret Two-Way ANOVA with Replication
It is a first and foremost task to have an organised dataset in order to interpret Two-Way ANOVA with Replication. Here, I have taken a purpose to analyze data between Public and Private universities’ results in online, offline, and combined ways. For this reason, I have organized their results in University, Online, Offline, and Combined columns.
Step 2: Apply Two-Way ANOVA with Replication
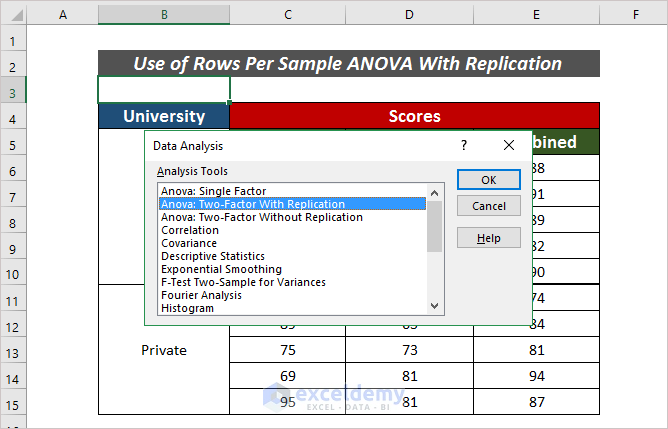
- Go to the Data tab first.
- Then, click on the Data Analysis feature from the ribbon.
A Data Analysis wizard will appear.
- Pick Anova: Two-Factor With Replication from the available options under Analysis Tools.
- After that, click on OK.
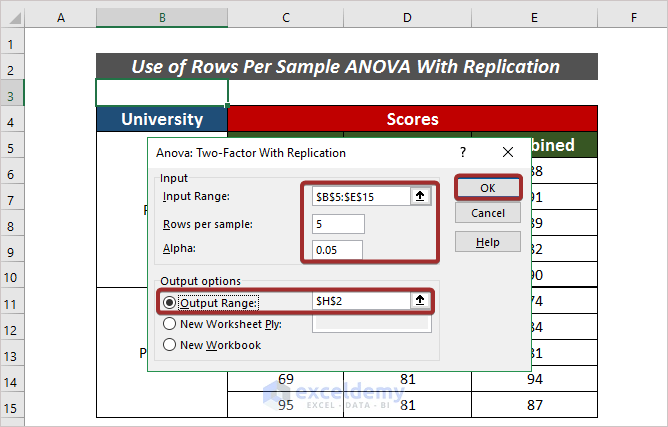
- Afterward, I defined the range in the Input Range section and the number of rows in Rows per sample.
- I also added the output location from Output options.
- Finally, press OK to finish the process.
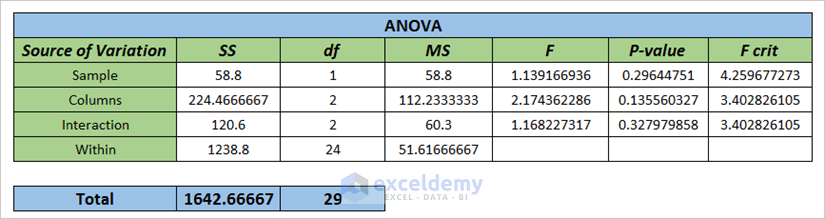
Now, we can see the output on the defined location.
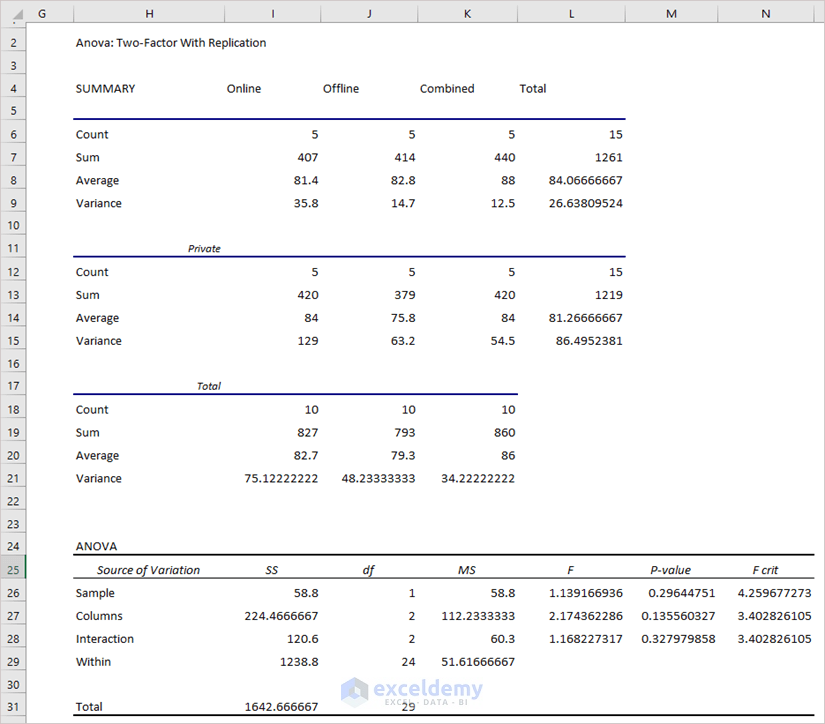
Step 3: Summary Statistics
From the modified output, we can see the results of Count, Sum, Average, and Variance for overall, private and public universities.
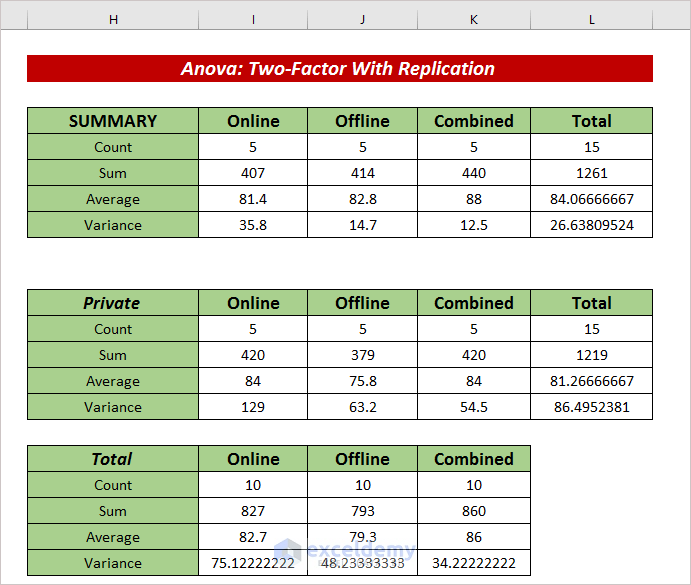
Here, the most important parameter is the P-value. As the P-value is greater than 0.05, we can say that These variables can not reject Null Hypothesis.
2. Apply Rows Per Sample in Two-Way ANOVA Without Replication
The ANOVA: Two-Way Without Replication is used to test for the existence of a significant difference in means between two groups when there are only two groups and when there is only one observation per group. The whole process is described in the following section.
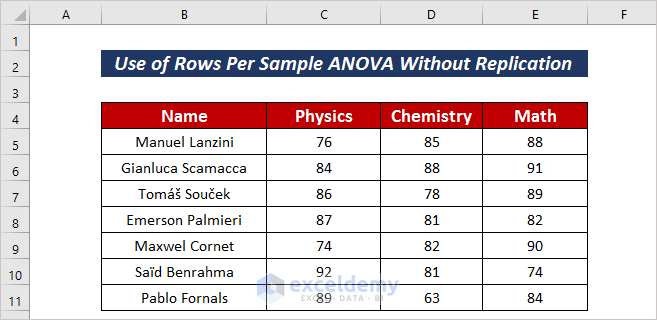
Step 1: Organise a Dataset to Interpret Two-Way ANOVA Without Replication
Having an organized dataset is the first criterion here. I have organized the data of a term result in Name, Physics, Chemistry, and Math sections.
Step 2: Apply Two-Way ANOVA Without Replication
- To apply Two-Way ANOVA Without Replication, go to the Data tab first.
- Then, click on the Data Analysis feature from the ribbon.
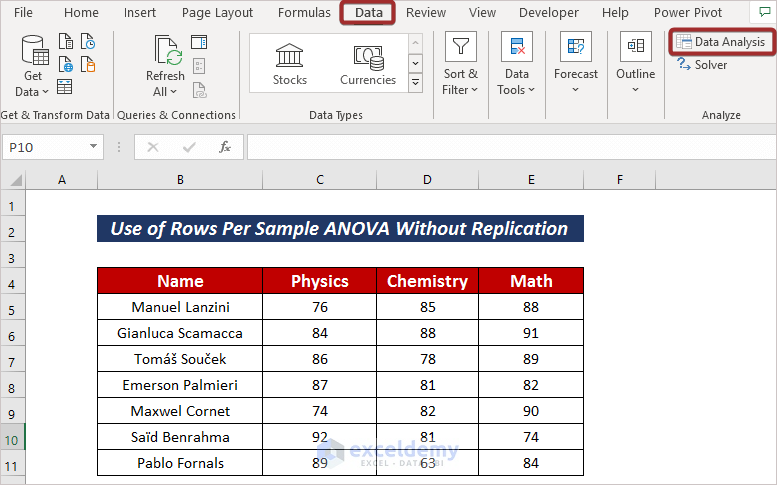
A Data Analysis wizard will appear.
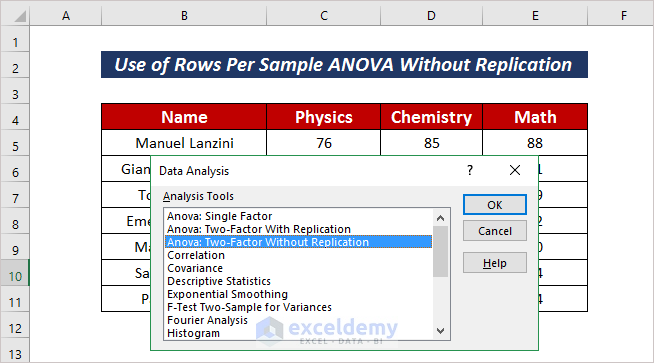
- from the available options under Analysis Tools, pick Anova: Two-Factor Without Replication.
- After that, click on OK.
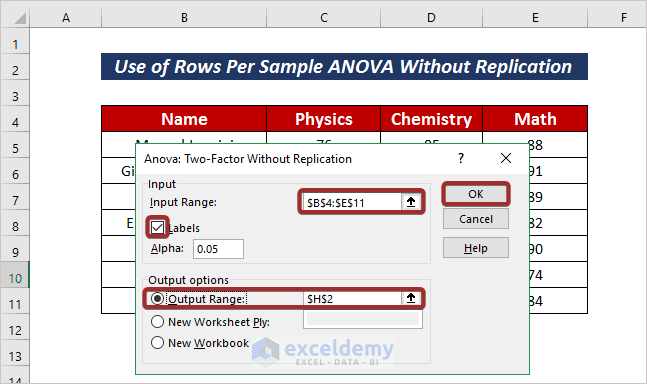
- Followingly, define the range in the Input Range section.
- Check the Labels box.
- Choose an output location from Output options.
- Finally, press OK to finish the process
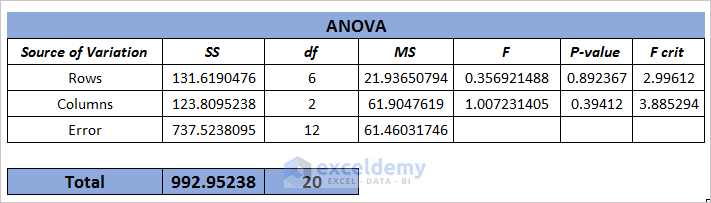
Now, we can see the output on the defined location.
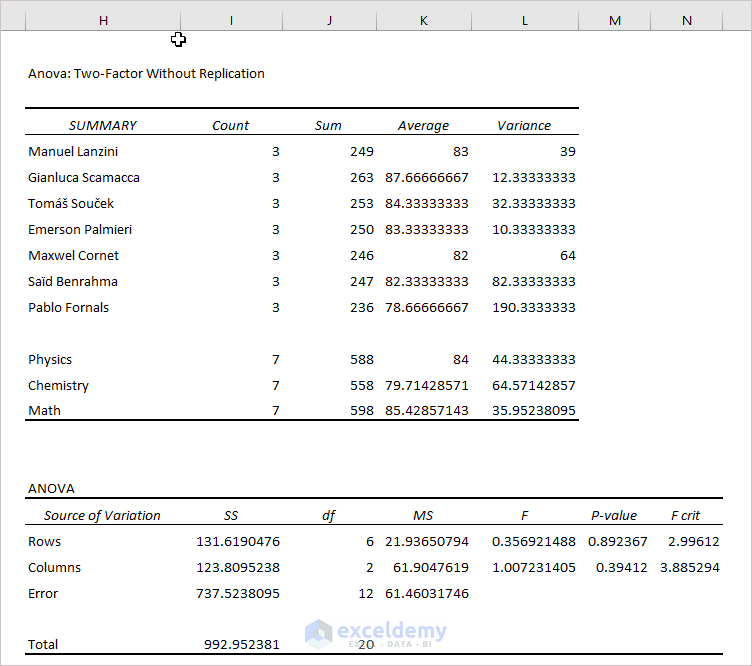
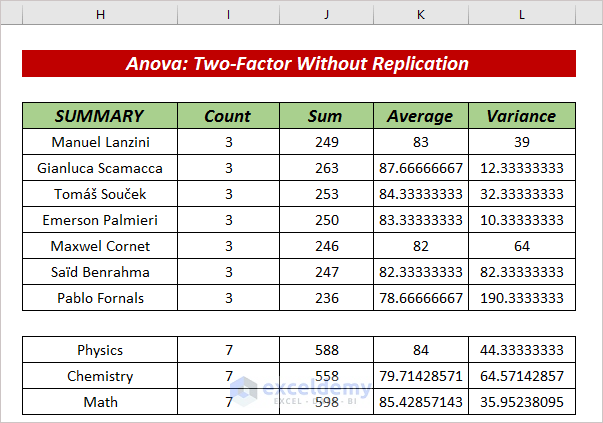
Step 3: Summary Statistics
we can see the Count, Sum, Average, Variance results in the output section for every student as well as on subjects.
Here, the P-value is greater than 0.05. So, we can say that these variables can not reject Null Hypothesis.
Read More: Two Way ANOVA in Excel with Unequal Sample Size
Download Practice Workbook
Conclusion
At the end of this article, I like to add that I have tried to explain 2 easy methods on how to apply rows per sample ANOVA in Excel. It will be a matter of great pleasure for me if this article could help any Excel user even a little. For any further queries, comment below. You can visit our site for more articles about using Excel.
Related Articles
- How to Do Two Way ANOVA in Excel
- How to Do Repeated Measures ANOVA in Excel
- Randomized Block Design ANOVA in Excel
- How to Do One Way ANOVA in Excel
<< Go Back to Anova in Excel | Excel for Statistics | Learn Excel
Get FREE Advanced Excel Exercises with Solutions!
