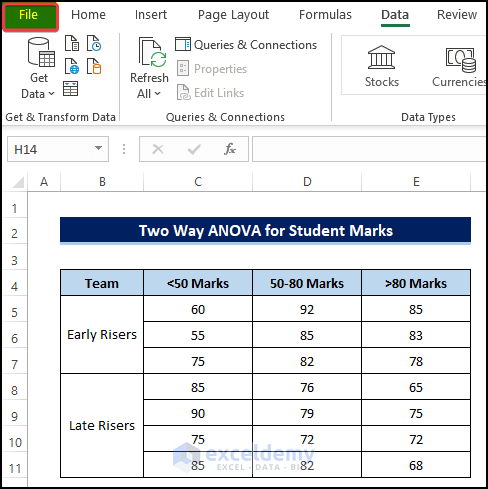
Method 1 – Two Way ANOVA for Student Marks
Steps
- In the beginning, we need to first add Data Analysis ToolPak. Adding this toolpak will allow us to ANOVA analysis in two ways.
- To add the Data Analysis Toolpak, click on the File in the corner of the worksheet.
- From the Excel Options dialog box, click on the Add-ins.
- From the Manage option, choose Excel Add-ins.
- Click Go.

- Add-ins dialog box, tick the Analysis ToolPak checkbox.

- See that the Data Analysis command is now present in the Data tab.
- Click the Data Analysis command.

- In the Data Analysis dialog box, select ANOVA: Two-Factor With Replication and then click on OK.

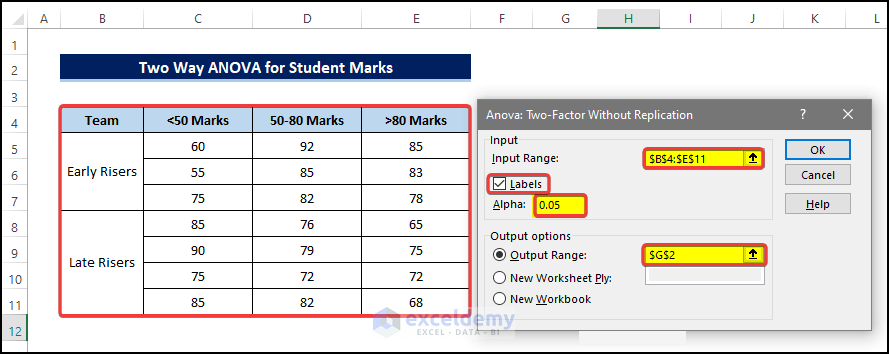
- After clicking OK, you can see that there is a new dialog box, named ANOVA: Two-Factor Without Replication. In that dialog box, you must select the input data for ANOVA calculations.
- Select the range of cell B4:E12 in the Input Range.
- Tick the Labels check mark.
- Now select the proper alpha value for the analysis. We are going for the usual 0.05 here.
- And select cell $G$2, for the selection for the Output Range.
- Click OK after this.
- After clicking OK, the ANOVA two factor with replication result will appear on a new or already existing Excel spreadsheet on the option you have selected.

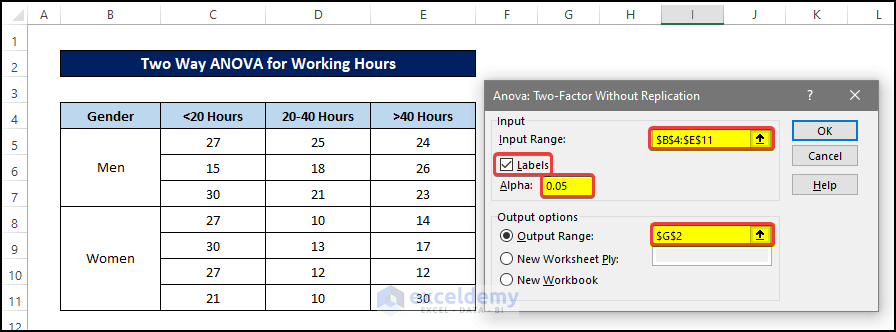
Method 2 – Two Way ANOVA for Working Hours
Steps
- See that the Data Analysis command is present in the Data tab.
- Click on the Data Analysis command.

- In the Data Analysis dialog box, select ANOVA: Two-Factor Without Replication and then click on OK.

- After clicking OK, you can see that there is a new dialog box, named ANOVA: Two-Factor Without Replication. In that dialog box, you need to select the input data for ANOVA calculations.
- Select the range of cells B4:E12 in the Input Range.
- Tick the Labels check mark.
- Select the proper alpha value for the analysis. We are going for the usual 0.05 here.
- Select cell $G$2, for the selection for the Output Range.
- Click OK after this.
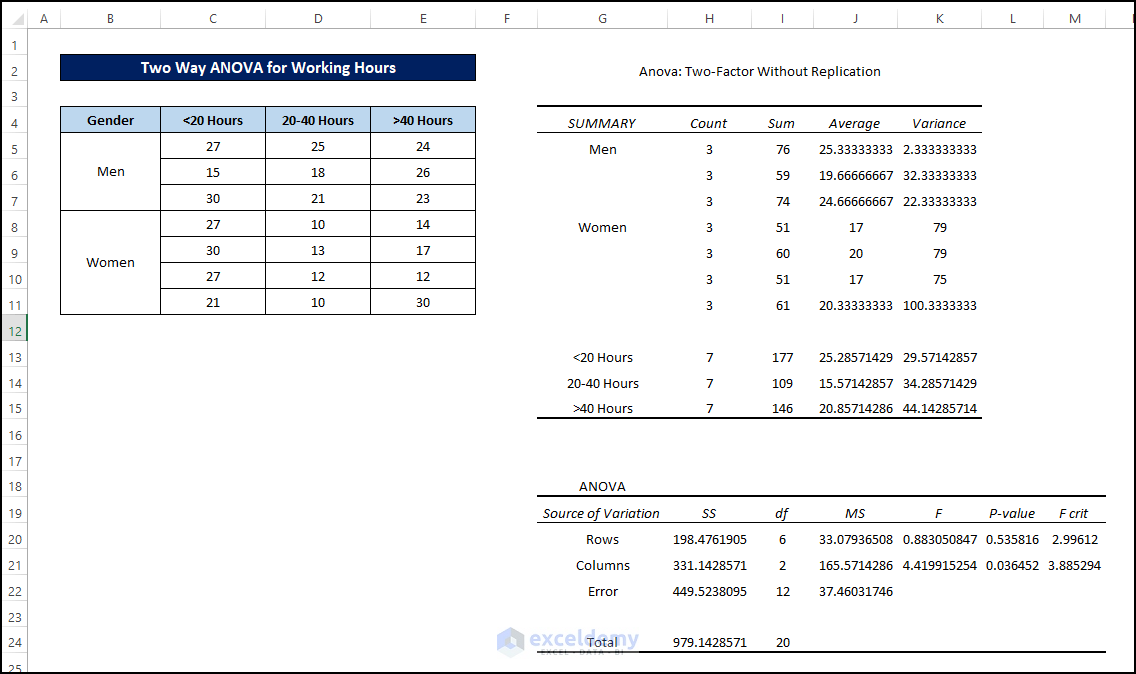
- After clicking on OK, the ANOVA two-factor without replication result will appear on a new or already existing Excel spreadsheet on the option you have selected.
Interpretation of the Result
The interpretation of any ANOVA analysis involves the Null hypothesis test. The Null hypothesis is that no comparing group is significantly different from the other group. If F > Fcritical we can reject the Null hypothesis. If F < Fcritical , we can’t reject the Null Hypothesis, meaning that no comparing group is significantly different from any other group.
- In the first example, we can see that in both cases, F < Fcritical. This means we can’t reject the null hypothesis in those cases. Subsequently, this also means that there are strong similarities between the datasets.
- In the second example, we see that in row cases, F < Fcritical. This means we can’t reject the null hypothesis in those cases. Subsequently, this also means that there are strong similarities between the rows of the datasets. But in column cases F > Fcritical, we can reject the Null hypothesis there. Subsequently, this also means there aren’t any strong similarities between the datasets in column sections.
- We can also see that the P-value in the first example is 0.037, which is statistically significant, so you can say that there is an effect of shifts on the performance of the students in the exam. But the value is close to the alpha value of 0.05 so the effect is less significant.
- The P value in the first example is 0.510. So you can say that the students’ working hours significantly impact their marks. But as this value is not very close to the value of alpha, the effect is substantial, meaning this has a heavy impact on the performances.
- The P value in the first example is 0.0346. So you can say that there is an impact of gender in the distribution of workhour. But as this value is very close to alpha, the effect is non-substantial. This means this gender impact is not very effective.
Limitations of Two Way ANOVA Analysis with Unequal Sample Size in Excel
In this example, we showed how to execute the ANOVA analysis with an unequal sample size. There are a couple of restrictions on calculating the ANOVA analysis with these specific criteria.
- There are no criteria for having equal sample sizes for ANOVA calculation. This ANOVA analysis with unequal sample sizes can be done for both one-way and two-way analyses.
- The variance difference between the sample datasets must be close. If the unevenness of sample sizes between the datasets is too big, then ANOVA analysis can create a problem. For small variance differences, ANOVA can be very robust.
- For the factorial ANOVA, use can face heavy issues.
- Now for the Excel. Things are a lot more complicated than it seems.
- Excel can execute the ANOVA analysis quite easily for data with homogeneous types and equal cell sizes. If the data samples lack homogeneity and have different cell sizes, Excel refuses to execute the ANOVA analysis.
- It can only execute the ANOVA analysis in two ways without replication, provided the rows are only different numbers.
- In two ways with replication, both the row and the column need to be the same in the dataset.
- This is because Excel is inefficient software for carrying out calculations with varied datasets. Variations of datasets make Excel throttle. Other software like the SPSS/R could easily deal with this type of situation.
Things You Should Keep in Mind
- Excel’s ANOVA tool works perfectly whether we input the correct data or risk incorrect data.
- To acquire an exact F Value, ensure the initial variance is less than the second variance.
Download Practice Workbook
Download this practice workbook below.
Related Articles
- How to Interpret Two-Way ANOVA Results in Excel
- How to Do Repeated Measures ANOVA in Excel
- Randomized Block Design ANOVA in Excel
- How to Do One Way ANOVA in Excel
<< Go Back to Anova in Excel | Excel for Statistics | Learn Excel
Get FREE Advanced Excel Exercises with Solutions!
