ANOVA, or Analysis of Variance, is an amalgamation of multiple statistical models to find the differences in means within or between groups. Multiple components of an ANOVA analysis can be used to interpret the results in Excel.
The following dataset showcases ANOVA analysis results.

In Excel, there are 3 types of ANOVA analysis available:
(i) ANOVA: Single Factor: Single factor ANOVA is performed when a single variable is in play. The result of the analysis is to find whether the data model has any significant differences in its means. It has two prominent hypotheses to solve.
(a) Null Hypothesis (H0): The factor causes no difference in means within or between groups. If means are symbolized with µ, the Null Hypothesis concludes: µ1 = µ2 = µ3…. = µN.
(b) Alternative Hypothesis (H1): the factor causes significant differences in the means. The Alternative Hypothesis results in µ1 ≠ µ2 .
(ii) ANOVA Two-Factor with Replication: When data contains more than one iteration for each set of factors or independent variables, two factors with replication ANOVA Analysis are applied. Like the single factor ANOVA analysis, the two factors with replication analysis tests for two variants of Null Hypothesis (H0).
(a) The groups have no difference in their means for the first independent variable.
(b) The groups have no difference in their means for the second independent variable.
For Interaction, another Null Hypothesis can be added, stating:
(c) One independent variable does not affect the impact of the other independent variable or vice versa.
(iii) ANOVA Two-Factor without Replication: When more than one task is conducted by different groups, the two factors without replication in ANOVA Analysis can be used. As a result, there are two Null Hypotheses.
For Rows:
Null Hypothesis (H0): No significant difference between the means of the different job types.
For Columns:
Null Hypothesis (H0): No significant difference between the means of the different group types.
Method 1- Interpreting ANOVA Results for a Single Factor Analysis in Excel
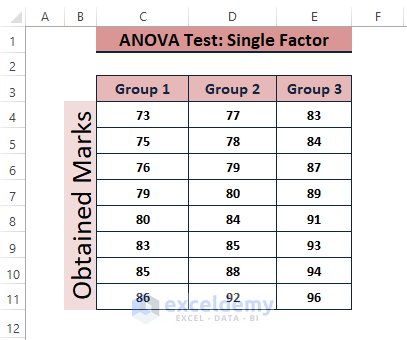
Executing the ANOVA: Single Factor Analysis in the Data Analysis Toolpak, reveals if there is a statistically significant difference between the means of 3 or more independent samples (or groups). The following image showcases the data to perform the test.
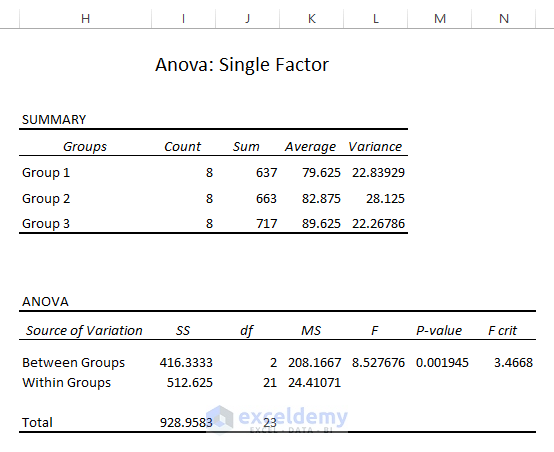
If you execute the ANOVA: Single Factor Data Analysis in Excel by going through Data > Data Analysis (in the Analysis section) > Anova: Single Factor (in Analysis Tools), the results of the test will be the following:
Result Interpretation
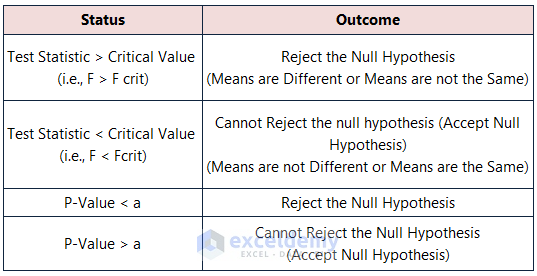
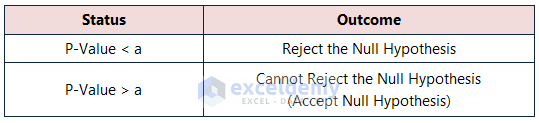
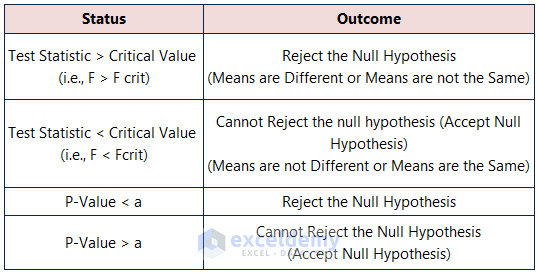
Parameters: Anova Analysis determines the Null Hypothesis’s applicability in the data. Different result values from the Anova Analysis outcome can pinpoint the Null Analysis status.
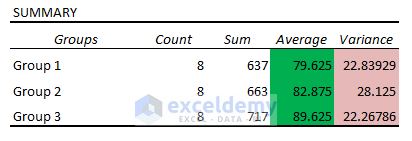
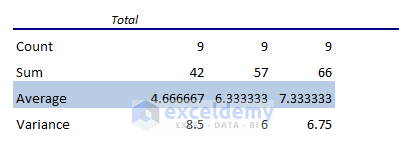
Average and Variance: From the Summary, you can see the groups with the highest average (i.e., 89.625) in Group 3, and the highest variance 28.125 in Group 2.
Test Statistic (F) vs. Critical Value (FCrit): Anova results showcase Statistic (F= 8.53) > Critical Statistic (FCrit=3.47). The data model rejects the Null Hypothesis.
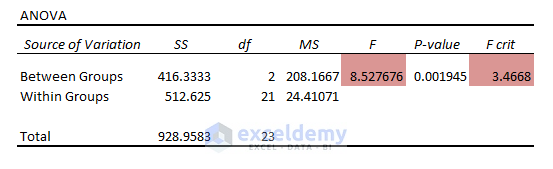
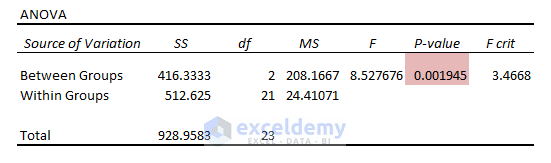
P-Value vs. Significance Level (a): In the ANOVA outcomes, the P Value (0.0019) < the Significance Level (a = 0.05). The means are different and reject the Null Hypothesis.
Method 2 – Decoding ANOVA Results for the Two-factor with Replication Analysis in Excel
ANOVA: Two-Factor with Replication evaluates the difference between the means of more than two groups. Data below was used to perform this analysis.
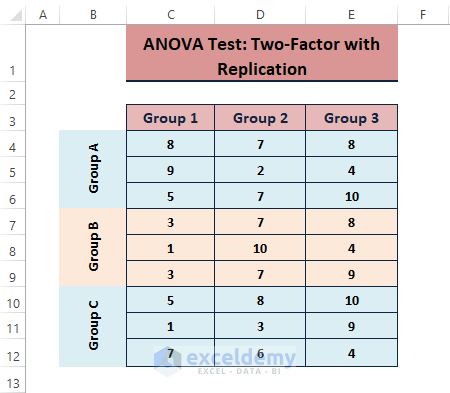
After performing the Anova: Two-factor With Replication Analysis, the outcome is:
Result Interpretation
Parameters: P Value only acts as the parameter for the rejection or acceptance of Null Hypothesis.
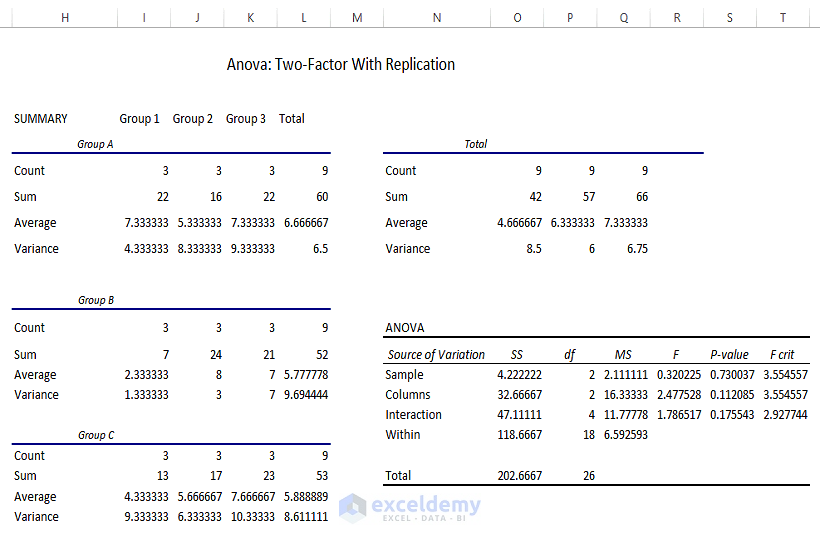
Variable 1 Significant Status: Variable 1 (i.e., Sample) has P Value (i.e., 0.730) greater than the Significance Level (i.e., 0.05). Variable 1 can’t reject the Null Hypothesis.
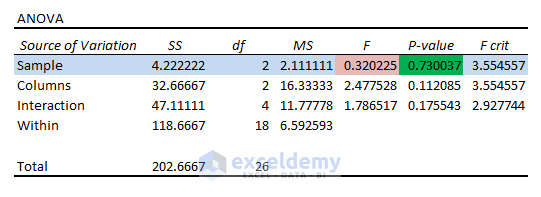 Variable 2 Significant Status: Like Variable 1, Variable 2 (Columns) has a P Value (0.112) which is greater than 0.05. Variable 2 also falls under the Null Hypothesis. Therefore, the means are the same.

Interaction Status: Variables 1 and 2 don’t have any interaction as they have a P Value (0.175) more than the Significance Level ( 0.05).
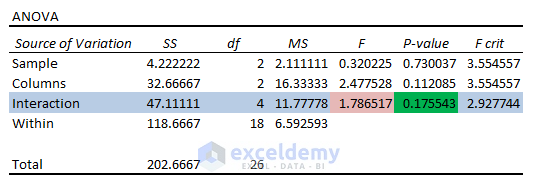
No variable exerts any significant effect on one another.
Mean Interaction: Among the means for Groups A, B, and C, Group A has the highest mean. But these mean values don’t tell whether this comparison is significant or not. In this case, you can look at the mean values for Groups 1, 2, and 3.
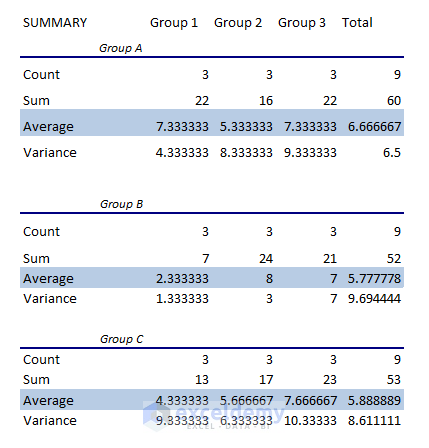
The mean values of Groups 1, 2, and 3 have greater values for Group 3. However, no variables have significant impact on each other.
Also, there are no significant interaction effects as the entries seem to be random and repetitive within the range.
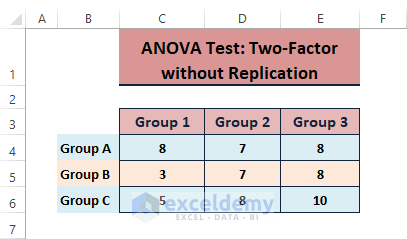
Method 3 – Translating ANOVA Results for the Two-factor Without Replication Analysis in Excel
When both factors or variables influence dependent variables, ANOVA: Two-factor Without Replication Analysis is executed. The latter data was used to perform the analysis.
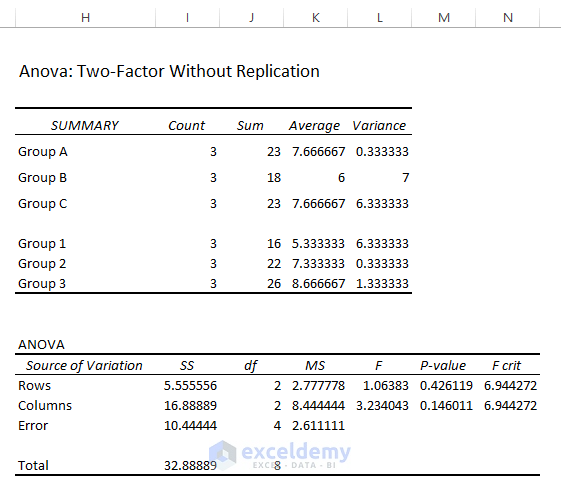
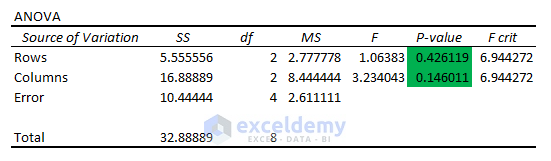
The results of a two factor without replication analysis are the following.
Result Interpretation
Parameters: Two-factor ANOVA Analysis Without Replication has similar parameters to the single factor ANOVA.
Test Statistic (F) vs Critical Value (FCrit): For both variables, the Statistic values (F= 1.064, 3.234) < Critical Statistic (FCrit=6.944, 6.944). The data model can’t reject the Null Hypothesis. The means are equivalent.

P-Value vs Significance Level (a): In the ANOVA outcomes, the P values (0.426, 0.146) > the Significance Level (a = 0.05). The means are the same and the Null Hypothesis should be accepted.
Download Excel Workbook
Related Articles
- How to Do ANOVA in Excel
- Nested ANOVA in Excel
- How to Make an ANOVA Table in Excel
- How to Perform Regression in Excel and Interpretation of ANOVA
- How to Graph ANOVA Results in Excel
- How to Interpret Two-Way ANOVA Results in Excel
<< Go Back to Anova in Excel | Excel for Statistics | Learn Excel
Get FREE Advanced Excel Exercises with Solutions!
