This article illustrates how to perform Regression Analysis in Excel using the Data Analysis tool and interpret the Anova Table obtained from the analysis. This technique is widely used in statistical modeling to estimate the impact of variables on a particular topic of interest.
What Is Regression Analysis?
Regression Analysis is a set of methods used to create a relationship between a dependent variable and a single or multiple independent variables. The two most common forms of regression are:
Simple Linear Regression: You can perform this analysis when there is only one independent variable affecting the outcome of the dependent variable. The equation for simple linear regression can be represented as follows.
Y = α0 + α1X1 + ϵ
Multiple Linear Regression: You can do this analysis when there are multiple independent variables affecting the outcome of the dependent variable. The equation for multiple linear regression can be represented as follows.
Y = α0 + α1X1 + α2X2 +….+ αnXn + ϵ
How to Perform Regression Analysis in Excel and Interpretation of ANOVA
Part 1 – How to Perform Regression Analysis in Excel
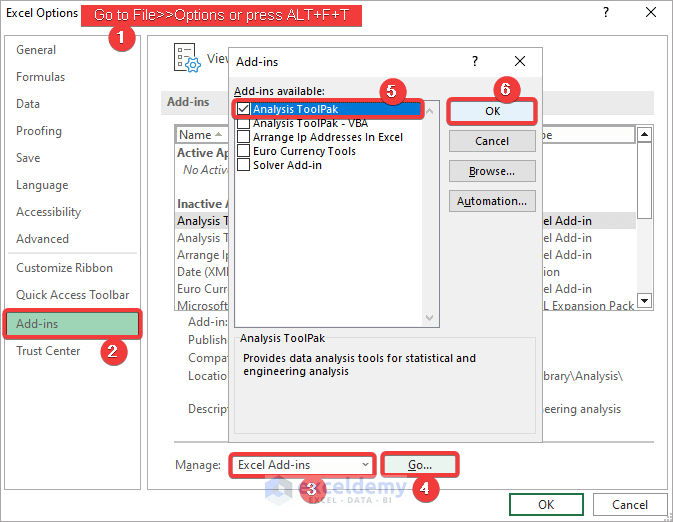
We can perform Regression Analysis using the Data Analysis tool in Excel. If you need to activate the tool to be able to access it:
- Go to File >> Options or press ALT+F+T.
- Select the Add-ins tab >> Manage Excel Add-ins >> Go.
- Check the Analysis ToolPak checkbox.
- Click OK.
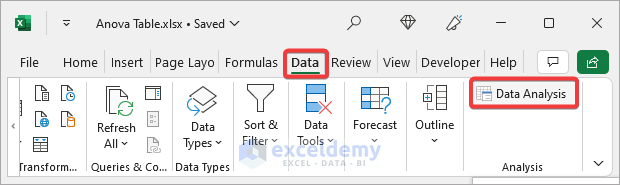
The Data Analysis tool will be available in the Data tab.
i – Simple Linear Regression
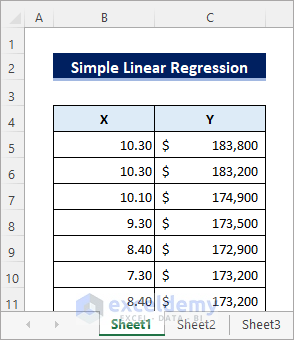
Suppose we have the dataset below. X is the independent variable that indicates the rates of interest, and Y is the dependent variable that indicates the price of homes. Let’s perform a regression analysis to see how these variables are related to each other.
Steps:
- Select Data >> Data Analysis.
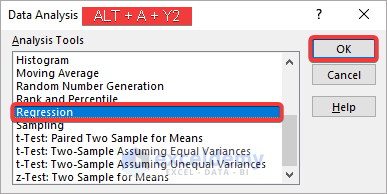
- Choose Regression from the analysis toolbox.
- Click OK.
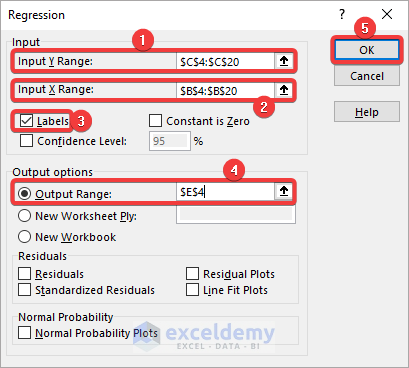
The Regression dialog box opens.
- Select the Y values including labels for Input Y Range and the X values for Input X Range.
- Check the Labels checkbox.
- Mark the radio button for Output Range.
- Enter the cell reference where you want to get the analysis results.
- Click OK.
The following results are returned in the specified location.
ii – Multiple Linear Regression
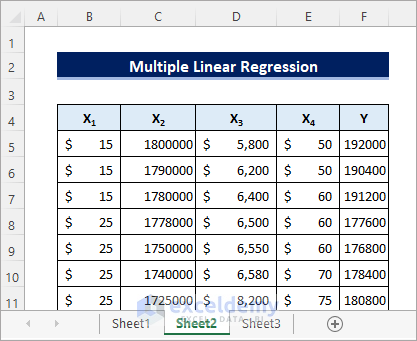
Now suppose we have the dataset below instead. Here the dependent Y variable represents the number of weekly riders in different cities. The independent X variables represent the price per week, the population of cities, monthly income of riders, and average parking rates per month respectively. Let’s verify how the independent variables affect the number of weekly riders by performing a regression analysis on the dataset.
Steps:
- Select Data >> Data Analysis.
- Choose Regression from the analysis toolbox as above.
- Click OK.
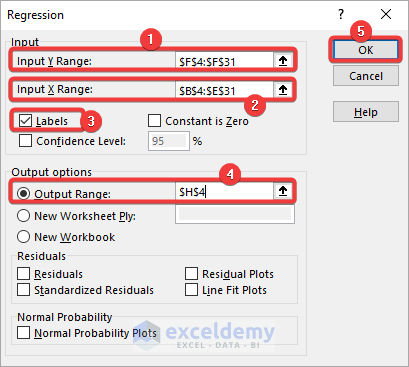
The Regression dialog box opens.
- Select the Y values including labels for Input Y Range and all of the X values for Input X Range.
- Check the Labels checkbox.
- Mark the radio button for Output Range.
- Enter the cell reference where you want to get the analysis results.
- Click OK.
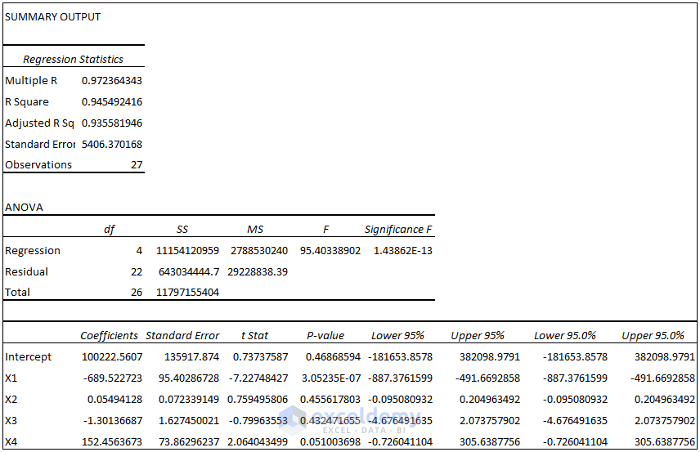
The following result is returned in the specified location.
Part 2 – How to Interpret ANOVA and Other Regression Analysis Results in Excel
The regression analysis output is divided into three different parts:
- Regression Statistics
- ANOVA Table
- Coefficients Table
We will briefly explain a few components from each part, as the rest do not have much importance.
Regression Statistics:
The two important values from this table are:
- Multiple R: This is called the correlation coefficient. It tells you how strong the linear relationship is between the independent and dependent variables. 1, -1, and 0 indicate a strong positive, a strong negative, and no relationship respectively.
- R Square: This is called the coefficient of determination. It tells you the percentages of the dependent variable that can be explained by the independent variable(s). A value closer to 1 indicates that a difference in the dependent variable can be explained by the difference in the independent variable(s) for most of the values.
ANOVA Table: The Significance F is of the most importance here.
- Significance F: A value below 0.05 indicates the linear relationship is statistically significant.
Coefficients Table: The coefficients from this table are used to form the linear equation to represent the relationship between the variables.
i – Simple Linear Regression
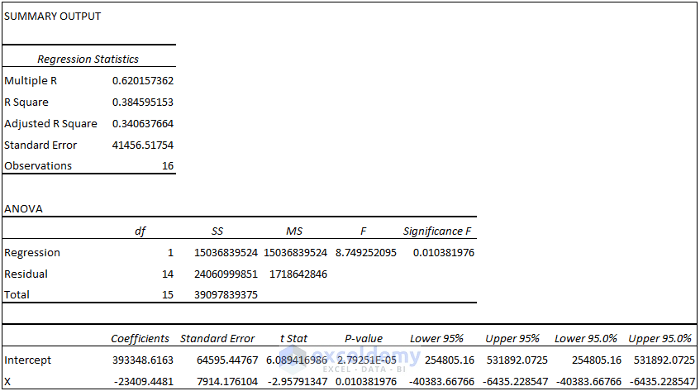
Observe the Regression Statistics table below.
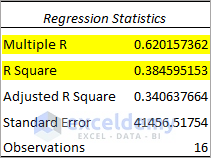
- Multiple R = 0.62 indicates that the relationship between the variables is not that strong but not that weak either.
- R Square = 0.38 indicates that 38% of Y values can be explained by X values.
Observe the ANOVA Table below.
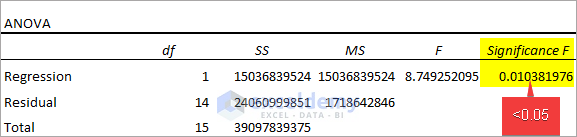
- Significance F = 0.01 < 0.05 indicates that the linear relationship between the variables is statistically significant.
Observe the Coefficient table below.
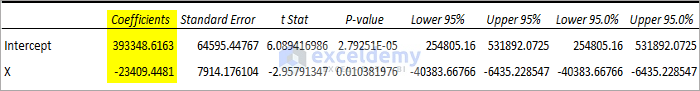
The regression equation can be Y = 393348.62 – 23409.45X + 41456.52.
ii – Multiple Linear Regression
Observe the Regression Statistics table.
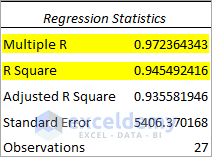
- Multiple R = 0.97 indicates that the relationship is strong.
- R Square = 0.94 indicates that 94% of Y values can be explained by X values.
Observe the ANOVA Table below.
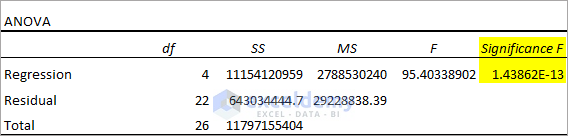
- Significance F < 0.05 indicates that the linear relationship between the variables is highly statistically significant.
Observe the Coefficient table below.
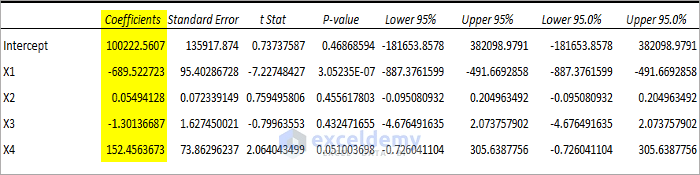
The regression equation can be Y = 100222.56 – 689.52X1 + 0.055X2 – 1.3X3 + 152.45X4 + 5406.37.
Read More: How to Interpret Two-Way ANOVA Results in Excel
Things to Remember
- Enable the Analysis ToolPak add-in to access the Data Analysis tool.
- For the Significance F, a value much smaller than the assumed confidence level means a stronger relationship.
Download Practice Workbook
Related Articles
- How to Do ANOVA in Excel
- How to Interpret ANOVA Results in Excel
- Nested ANOVA in Excel
- How to Make an ANOVA Table in Excel
- How to Calculate P Value in Excel ANOVA
- How to Graph ANOVA Results in Excel
<< Go Back to Anova in Excel | Excel for Statistics | Learn Excel
Get FREE Advanced Excel Exercises with Solutions!
