Microsoft Excel is a powerful software. We can perform numerous operations on our datasets using Excel tools and features. There are many default Excel Functions that we can use to create formulas. Many institutions use Excel files to store important data. Sometimes, they need to perform statistical analysis and it’s easier to do that in Excel. This article will show you the step-by-step procedures to interpret two-way ANOVA results in Excel.
How to Interpret Two-Way ANOVA Results in Excel: Easy Steps
Often, we experiment or study certain aspects by splitting them into multiple groups. Those groups are independent and based on various factors. In Two-Way ANOVA, the groups are divided into two factors. ANOVA means Analysis of Variance. Two-Way ANOVA is a statistical analysis by which we can check the significant difference in the means of those independent groups. This article will demonstrate how to perform the two-way ANOVA in Excel and interpret the results. Therefore, go through the steps below carefully.
STEP 1: Input Data in Excel
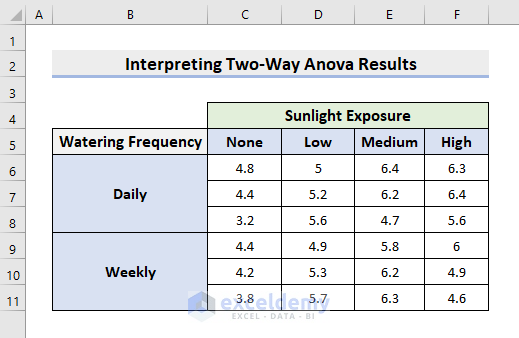
- First, we’ll input accurate data to perform the two-way ANOVA.
- In this example, we’ll consider the Height growth in inches for a sample of 3 plants over some time.
- The plants are divided into two groups based on the Watering Frequency.
- Here, we’ll also observe different Sunlight Exposure rates.
- See the following dataset to understand clearly.
STEP 2: Select Data Analysis
- In this step, we’ll carry out the Data Analysis.
- However, if you don’t find the Data Analysis option in the Data tab, follow the process below to add it.
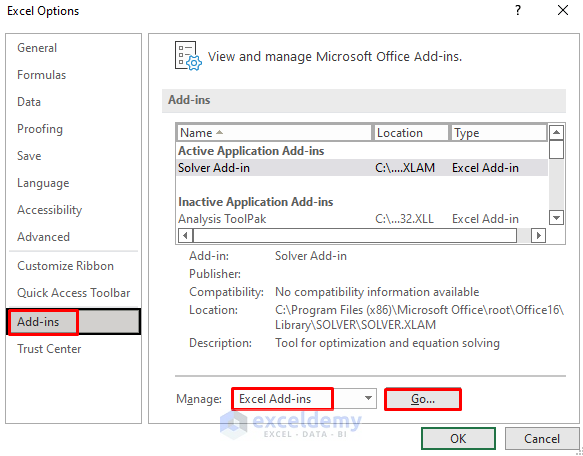
- Firstly, go to File ➤ Options.
- As a result, the Excel Options dialog will emerge.
- Then, go to the Add-ins tab.
- After that, click Excel Add-ins from the Manage drop-down.
- Subsequently, press Go.
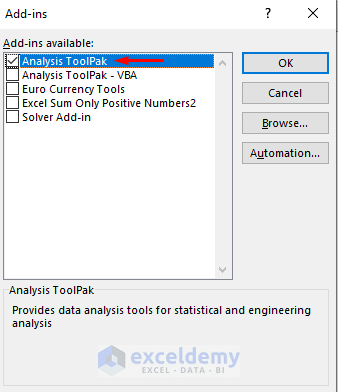
- Consequently, the Add-ins dialog box will pop out.
- There, check the box for Analysis ToolPak.
- Afterward, press OK.
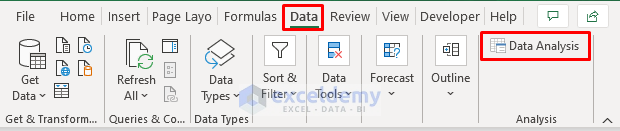
- Thus, you’ll get the Data Analysis option in the Data tab.
- Now, click it.
STEP 3: Choose Two-Way Anova
- Accordingly, the Data Analysis dialog box will appear.
- Choose Anova: Two-Factor With Replication.
- Next, press OK.

STEP 4: Fill in Necessary Values
- Now, in the pop-out dialog box, we have to input the necessary values for the analysis.
- Firstly, select the Input Range B5:F11.
- As we’re working with 3 plants, insert 3 in Rows per sample.
- Next, type 0.05 in the Alpha box as a significance level.
- After that, we’ll spill the results in the range starting from the H2 cell.
- So, select the H2 cell as the Output Range.
- Lastly, press OK.

STEP 5: Interpret Result
- Hence, it’ll return the Two-Way ANOVA Results in the specified range.
- Look at the below picture.
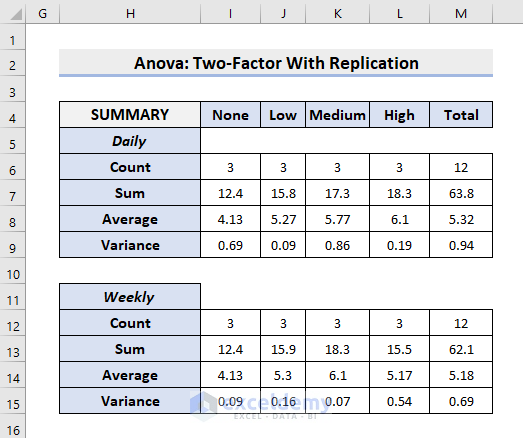
- For convenience, we’ll show the results in 2 figures.
- The first table shows the results for the first group where the Watering Frequency is Daily.
- For instance, the Average Height of the 3 plants was 5.27 inches for the Daily Watering Frequency and Low sunlight exposure.
- Similarly, the second table is for the Weekly watering frequency.
- There, you will notice the Average Height of the plants was 6.1 inches for the Weekly Watering Frequency and Medium sunlight exposure.
- In this way, you can interpret all other outputs.
- Moreover, the third table calculates the Total.
- You’ll find that the Average height is greater (5.93) for the plants that received Medium sunlight exposure.
- Finally, the last table shows the two-way ANOVA.
- We can interpret the results as:
- 0.29815 is the obtained Interaction P-value between Sunlight Exposure and Watering Frequency. We have set the Alpha level as 0.05. So, this is not statistically significant.
- 0.55913 is the watering frequency P-value. This is also statistically insignificant.
- But, the sunlight exposure P-value (0.00036) is significant in the statistical analysis according to the 0.05 Alpha level.

- These outputs clarify that only Sunlight Exposure has a significant effect on plant growth.
- As the interaction between Watering Frequency and Sunlight Exposure is insignificant, the sunlight exposure effect remains consistent across different watering frequencies.
Read More: How to Interpret ANOVA Results in Excel
Download Practice Workbook
Download the following workbook to practice by yourself.
Conclusion
Henceforth, you will be able to interpret two-way ANOVA results in Excel following the above-described procedures. Keep using them and let us know if you have more ways to do the task. Don’t forget to drop comments, suggestions, or queries if you have any in the comment section below.
Related Articles
- How to Do Repeated Measures ANOVA in Excel
- How to Apply Rows Per Sample ANOVA in Excel
- Randomized Block Design ANOVA in Excel
- How to Do One Way ANOVA in Excel
- Two Way ANOVA in Excel with Unequal Sample Size
- How to Use ANOVA Two Factor Without Replication in Excel
- How to Use Two Factor ANOVA with Replication in Excel
<< Go Back to Anova in Excel | Excel for Statistics | Learn Excel
Get FREE Advanced Excel Exercises with Solutions!
