


Advanced formulas like IF and VLOOKUP can be cumbersome in Excel when working with large datasets. On the other hand, Power BI offers Data Analysis Expressions (DAX), which can streamline and simplify these complex calculations. DAX formulas allow you to create calculated columns, measures, and tables that are more efficient and easier to maintain than traditional Excel formulas.
In this tutorial, we will explore 5 Power BI DAX formulas that simplify complex Excel calculations. If you are an Excel power user, learning DAX formulas will enhance your Power BI skills and make your data analysis more robust and efficient.
1. CALCULATE: Modifying Filter Context
In Excel, calculating values based on specific conditions often requires nested IF statements. DAX’s CALCULATE function allows you to modify the filter context in a more efficient and readable way. It is one of the most powerful DAX functions, enabling complex aggregations and dynamic filtering.
Excel Equivalent: Nested IF Statements
In Excel, you might have something like this:
=IF(A2 > 100, "High", IF(A2 > 50, "Medium", "Low"))
Power BI DAX:
Filter Sales Category =
CALCULATE (
IF (SUM(Sales[SalesAmount]) > 50000, "High", "Low"),
Products[Category] = "Book"
)
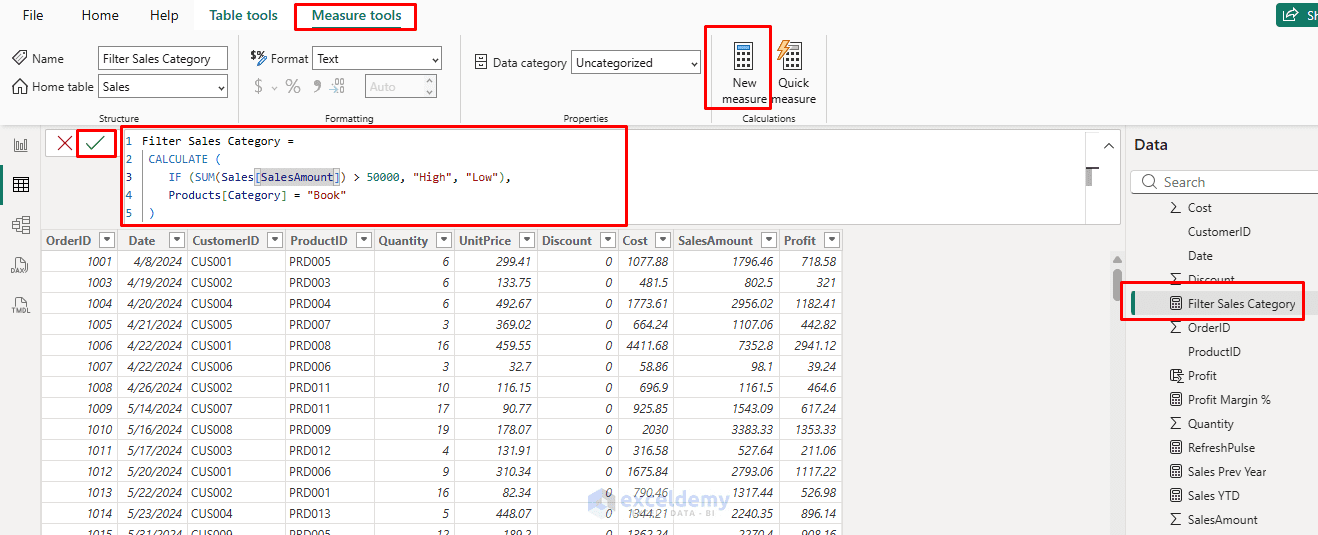
In this case, CALCULATE changes the filter context to include only data for “Book” before evaluating whether the total sales amount exceeds 50,000.
CALCULATE modifies the current filter context. It tells Power BI to ignore existing filters and apply the specified condition instead. You can also stack multiple conditions as needed.
2. RELATED: Accessing Related Tables
Excel uses lookup functions to retrieve related values from another table. In Power BI, the RELATED function makes this process more straightforward and efficient.
Excel Equivalent: VLOOKUP
In Excel, a formula like this:
=VLOOKUP(A2, SalesData, 2, FALSE)
retrieves a value from the second column of the SalesData table where the first column matches the value in A2.
Power BI DAX: RELATED
The RELATED function in DAX retrieves a value from a related table. To use RELATED, there must be a relationship between the two tables in the Power BI data model.
- Calculated column in the Sales table
Product Category = RELATED(Products[Category])
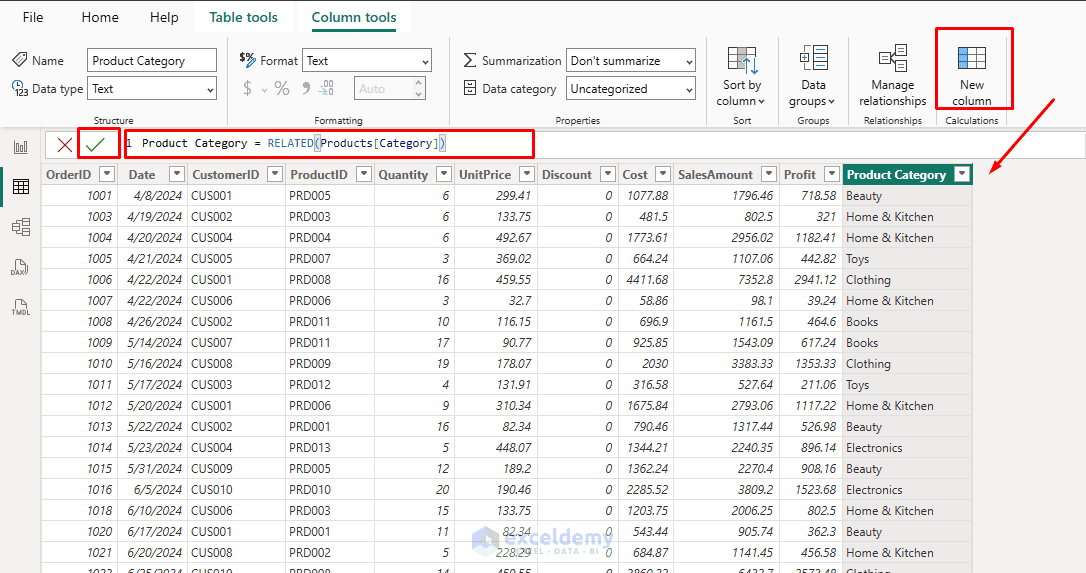
Here, the RELATED function fetches the Product Category from the Products table based on the existing relationship. This eliminates the need for complex lookup formulas and reduces errors by leveraging the data model.
3. SWITCH(TRUE(), …): Cleaner Replacement For Nested IF Statements
Excel’s IF function becomes difficult to manage with multiple conditions, but DAX’s SWITCH function streamlines conditional logic. It is especially useful when handling multiple conditions without deeply nested IF statements.
Excel Equivalent: Nested IF Statements
In Excel, you might use something like:
=IF(A2>100000,"High",IF(A2>50000,"Medium",IF(A2>10000,"Low","Tiny")))
Power BI DAX:
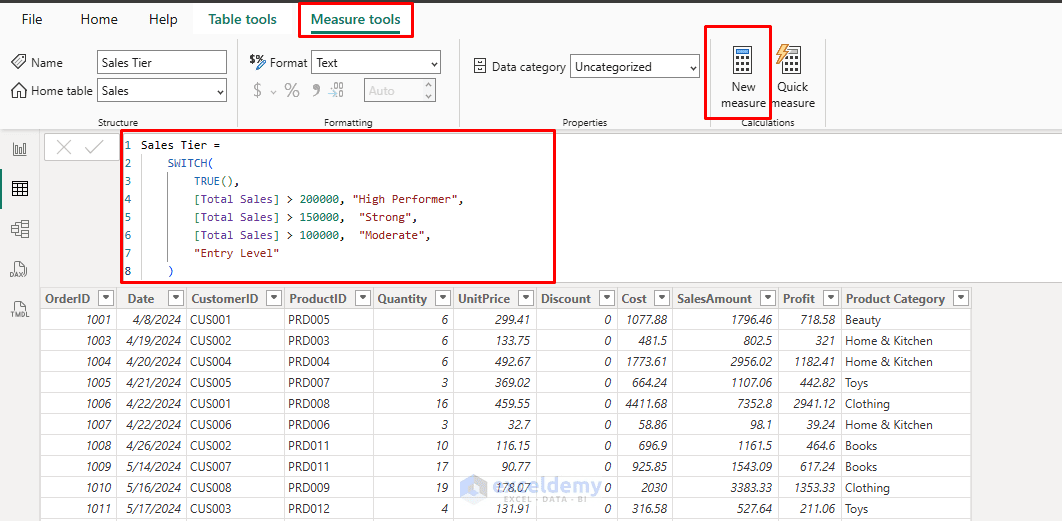
Sales Tier =
SWITCH(
TRUE(),
[Total Sales] > 200000, "High Performer",
[Total Sales] > 150000, "Strong",
[Total Sales] > 100000, "Moderate",
"Entry Level"
)
Total Sales = SUM(Sales[Amount])
Customer Segment: Calculated column
Customer Segment Logic =
SWITCH(
TRUE(),
CALCULATE([Total Sales]) > 75000 && RELATED(Regions[Country]) = "United States", "US VIP",
CALCULATE([Total Sales]) > 50000 && RELATED(Regions[Country]) = "United Kingdom", "UK Premium",
CALCULATE([Total Sales]) > 30000 && RELATED(Regions[Country]) = "Canada", "Canada Premium",
Customers[CustomerType] = "Premium", "Premium Customer",
"Standard"
)
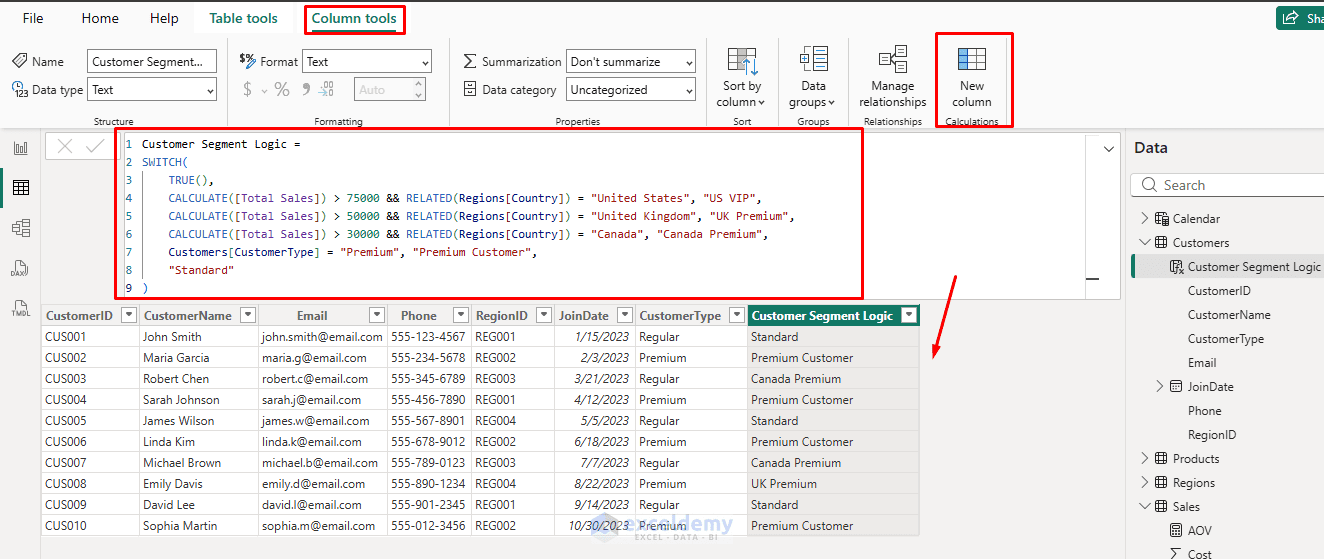
This approach is significantly more readable than deeply nested IF statements. It is ideal for classification logic such as segmentation, banding, or KPI categorization.
4. SUMX: Iterating Over A Table To Calculate A Sum
When you need to perform calculations row by row and then aggregate the results, SUMX is the appropriate function. It iterates over a table, evaluates an expression for each row, and then sums the results.
Excel Equivalent: SUMPRODUCT
In Excel, you might use:
=SUMPRODUCT(A2:A10, B2:B10)
Power BI DAX:
Total Revenue =
SUMX(
Sales,
Sales[Quantity] * Sales[UnitPrice]
)
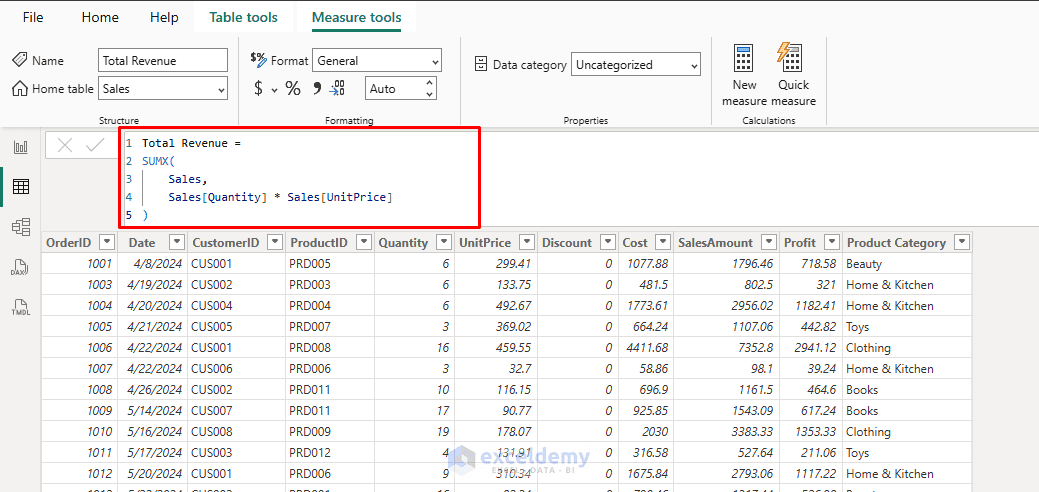
The SUMX function iterates over each row of the Sales table, multiplies Quantity by UnitPrice, and then sums the results.
5. CALCULATE + Time Intelligence: Eliminating Manual Date Logic
In Excel, time-based calculations often rely on complex SUMIFS, OFFSET, or INDEX/MATCH patterns. DAX provides built-in time-intelligence functions that simplify these tasks.
Power BI DAX:
Sales YoY % Growth =
VAR CurrentSales = SUM(Sales[SalesAmount])
VAR PreviousSales =
CALCULATE(
SUM(Sales[SalesAmount]),
SAMEPERIODLASTYEAR('Calendar'[Date])
)
RETURN
DIVIDE(CurrentSales - PreviousSales, PreviousSales, 0)
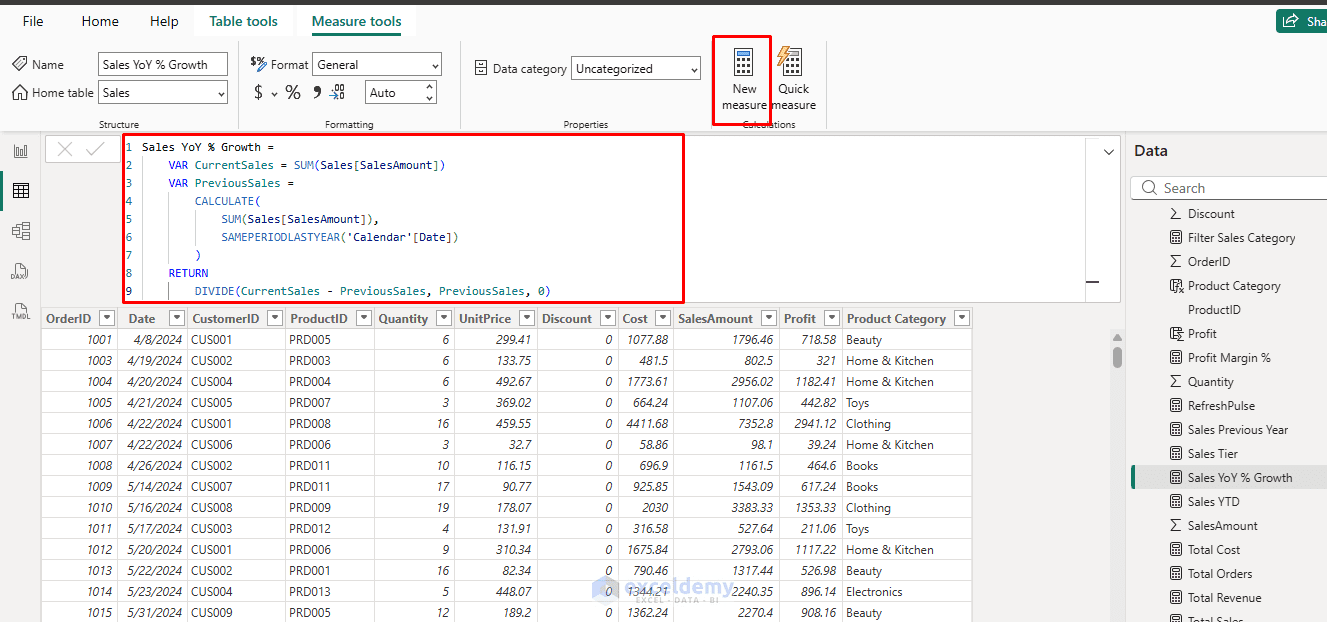
Simple Built-in Time-Intelligence Measures:
YTD Sales =
TOTALYTD(
SUM(Sales[SalesAmount]),
'Calendar'[Date]
)
Sales vs Last Year =
CALCULATE(
SUM(Sales[SalesAmount]),
PARALLELPERIOD('Calendar'[Date], -1, YEAR)
)
These functions work seamlessly with any date filter in your report, including slicers for months, quarters, or fiscal years. No helper columns or manual adjustments are required.
DAX Formulas in Report:
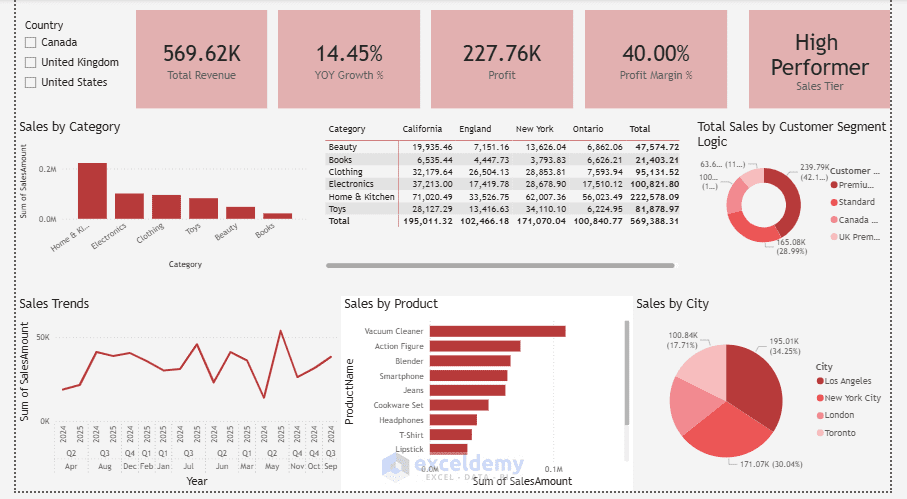
Tip: Using DIVIDE To Handle Errors
In Excel, dividing by zero often results in an error. DAX provides a more robust solution through the DIVIDE function, which handles division by zero gracefully.
The DIVIDE function allows you to specify an alternate result when a division by zero occurs:
Profit Margin = DIVIDE(Sales[Profit], Sales[Total Revenue], 0)
This function returns 0 when the denominator is zero, avoiding errors without requiring additional logic.
Quick Start Tips For Excel Users
- Always build relationships first: This is where RELATED and CALCULATE derive their power
- Create measures, not columns: Measures are generally faster and more flexible
- Use variables (VAR): They improve readability and maintainability
- Test in a blank visual: Validate measures using cards or tables with slicers
- Performance tip: Keep filters as narrow as possible; direct column filters are usually faster than full table scans
Conclusion
These five Power BI DAX formulas—CALCULATE, RELATED, SWITCH, SUMX, and time-intelligence functions—provide a cleaner and more efficient way to handle calculations that would otherwise require complex Excel formulas like nested IF statements or VLOOKUP. By incorporating these techniques into your workflow, you can simplify your data models, improve performance, and build more scalable reports.
Get FREE Advanced Excel Exercises with Solutions!

