


If you regularly import the same Excel files into multiple Power BI reports, you’ve probably repeated the same cleanup steps over and over. You rename columns, remove blanks, change data types, split text, merge tables, and then repeat those exact steps in every new report. Power BI Dataflows solve this problem by moving the data preparation work to the Power BI service, where the cleaned tables can be reused by multiple Excel files, Power BI semantic models, and reports.
In this tutorial, we will show how to use Power BI Dataflows to create reusable ETL (Extract, Transform, Load) for your Excel and Power BI reports. Instead of rebuilding your ETL process every time, you build it once and refresh it whenever the source data changes.
What Are Power BI Dataflows?
Dataflows are cloud-based ETL tools built on Power Query. They let you connect to data sources, clean and transform data using a low-code visual interface, and store the results in a reusable format.
Unlike Power Query transformations embedded in individual Power BI Desktop files or Excel workbooks, dataflows live in the Power BI service (or Microsoft Fabric). Multiple reports, dashboards, and even Excel files can connect to the same dataflow tables. Think of it as a shared ETL layer:
- Extract: Connect to Excel files, SharePoint folders, databases, web data, or other sources.
- Transform: Clean, filter, rename, merge, append, and reshape data using Power Query.
- Load: Store the cleaned result in the Power BI service so other reports can use it.
The main benefit is that the transformation logic exists once. Instead of copying the same Power Query steps into five different reports, you create one dataflow and let multiple reports connect to it.
Gen1 vs. Gen2:
- Gen1 (legacy): Original Power BI dataflows. Still usable with Pro/PPU licenses in many cases, but no longer receiving major investments.
- Gen2 (recommended): More powerful, with better performance, multiple destinations (Lakehouse, Warehouse, Azure SQL, etc.), AutoSave, pipelines integration, Copilot support, and enhanced monitoring. Requires Fabric capacity.
For new projects, start with Dataflow Gen2.
Prerequisites:
- Power BI Pro, Premium Per User (PPU), or Fabric capacity (for Gen2 and advanced features)
- A workspace (not “My Workspace”), preferably a Premium/Fabric workspace
- Permissions to create dataflows in the workspace
- Data source credentials (handled securely in the service)
Licensing Notes: Power BI Pro users can create analytical dataflows, but some advanced features require Premium capacity. Microsoft states that linked tables, computed tables, AI capabilities, DirectQuery to dataflows, enhanced compute engine, and dataflow incremental refresh are Premium-only features in Power BI.
Step 1: Create a Dataflow in the Power BI Service
Open the Power BI service in your browser and go to the workspace where you want to store the dataflow. You cannot create Power BI dataflows in My Workspace, so use a regular workspace instead. If you don’t have one, click Workspaces in the left nav, then + New workspace.
Steps:
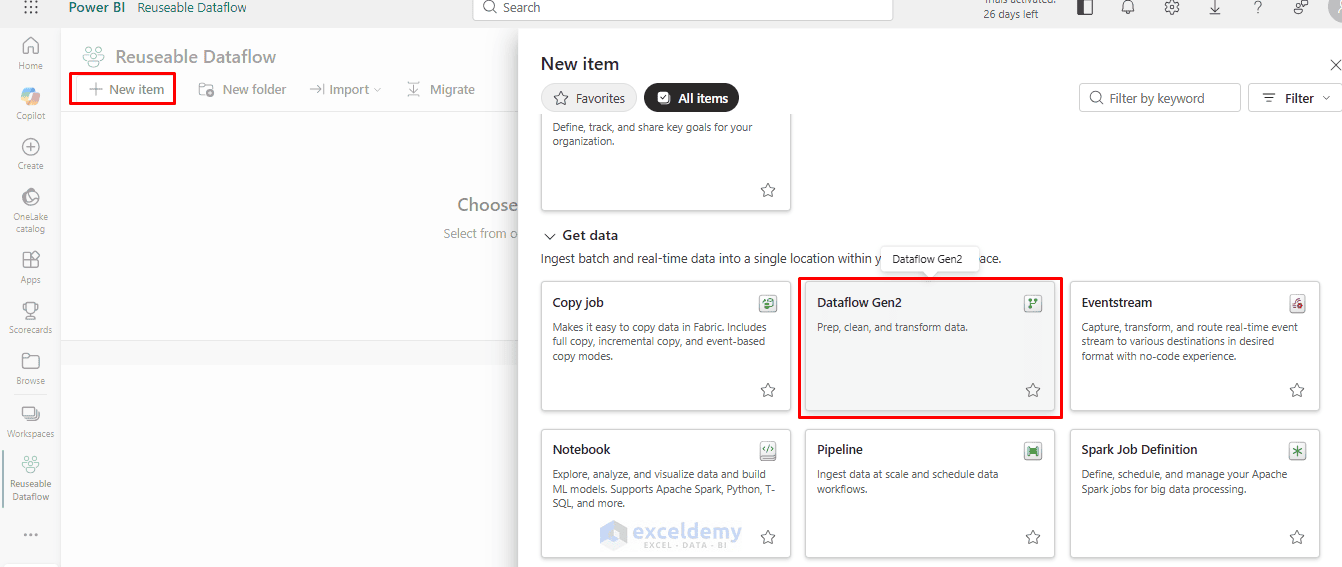
- Open the Power BI Service >> navigate to your workspace
- Select New item >> choose Dataflow Gen2
- Name it something like Dataflow 1
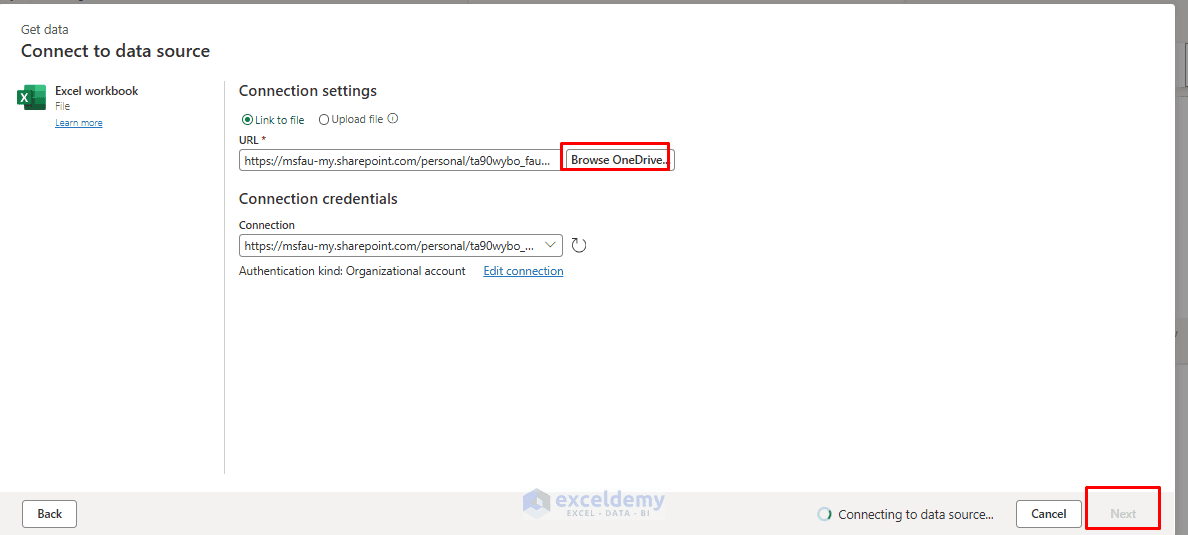
- Browse and choose your source (Excel, SQL, SharePoint, Web, Azure services, etc.)
- Click Next
- Authenticate and select tables or queries, such as SalesData
- Click Create to open the data in Power Query Online
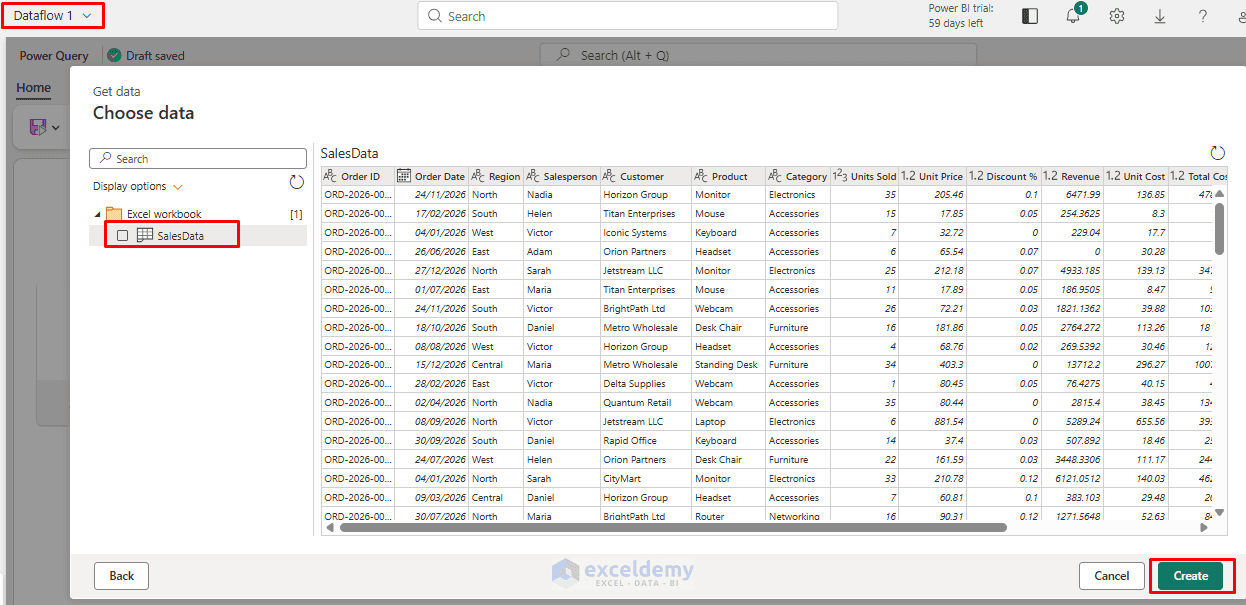
Microsoft’s dataflow creation flow allows you to connect to a new source, select data, and then shape or transform that data in the dataflow editor.
Step 2: Transform the Data in Power Query Online
After the data opens in Power Query Online, clean it the same way you would in Excel Power Query or Power BI Desktop.
For the sales example, apply these transformations:
- Remove unnecessary columns
- Rename columns clearly
- Set correct data types:
- Order Date as Date
- Region as Text
- Product as Text
- Units Sold as Whole Number
- Unit Price as Decimal Number
- Revenue as Decimal Number
- Filter out cancelled orders if the report should only show completed sales
- Remove blank rows
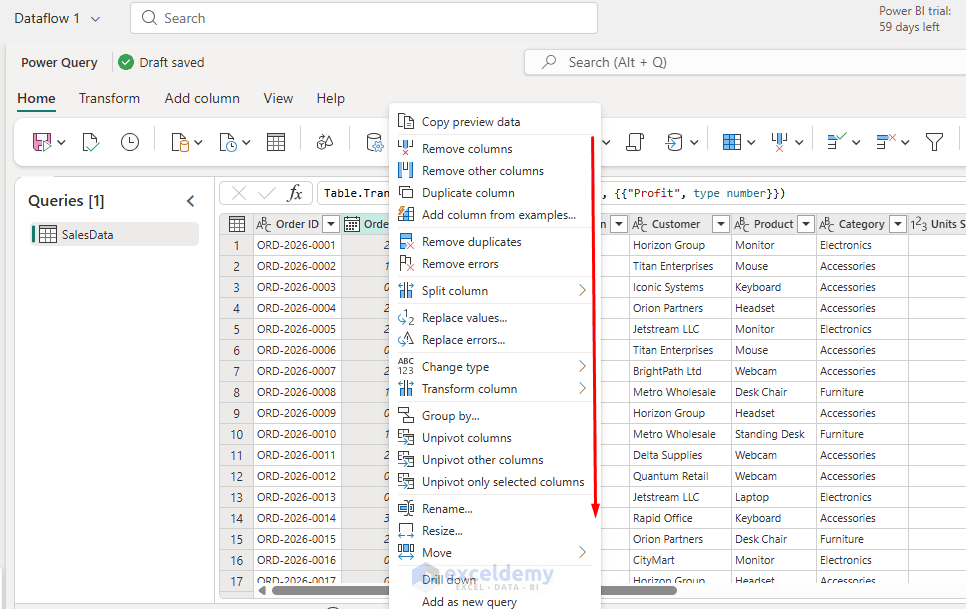
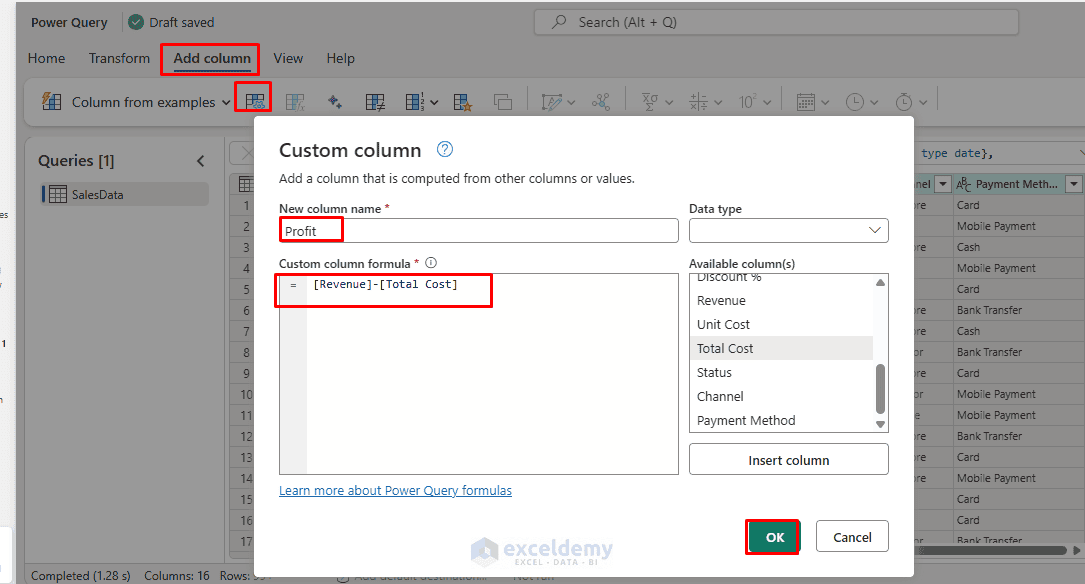
- Add a calculated column if needed, such as Profit
- Name the final query Cleaned Sales Data
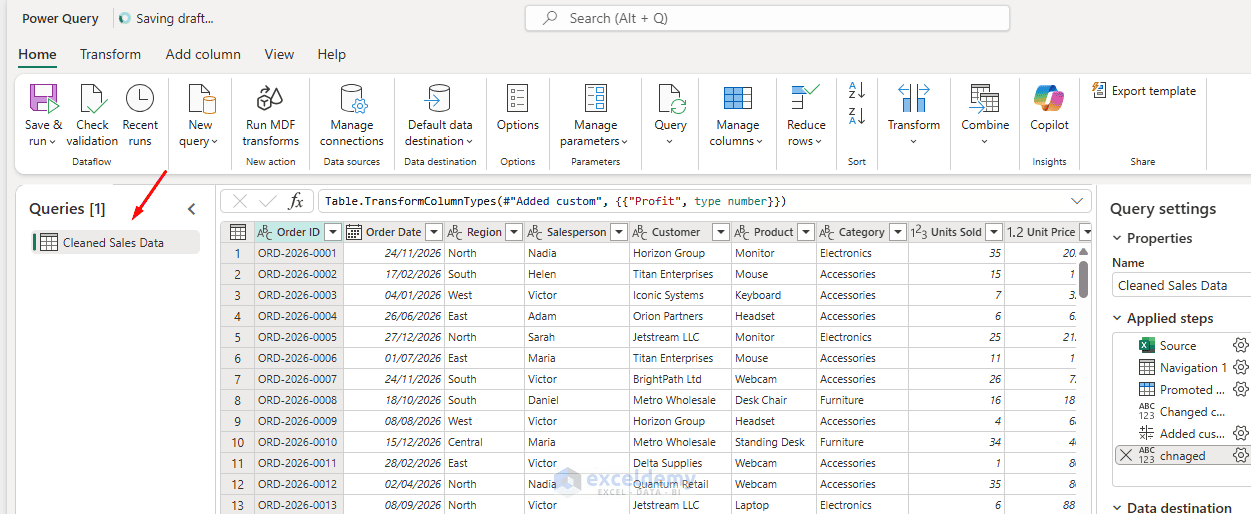
This step is the heart of the dataflow. You are not just importing data; you are building a reusable cleaning process. Dataflows use Power Query as the transformation engine, so users who already know Power Query in Excel or Power BI Desktop can apply similar skills in the Power BI service.
Step 3: Save and Refresh the Dataflow
After finishing the transformations, save the dataflow. Use a clear name.
- Give your table a clear name (e.g. Cleaned Sales Data)
- Click Save
Refresh the Dataflow:
After saving, refresh the dataflow. A dataflow must be refreshed before it can be consumed in Power BI Desktop or used as the source for another dataflow table.
Steps:
- Go to the workspace
- Find the dataflow >> select the three dots beside it
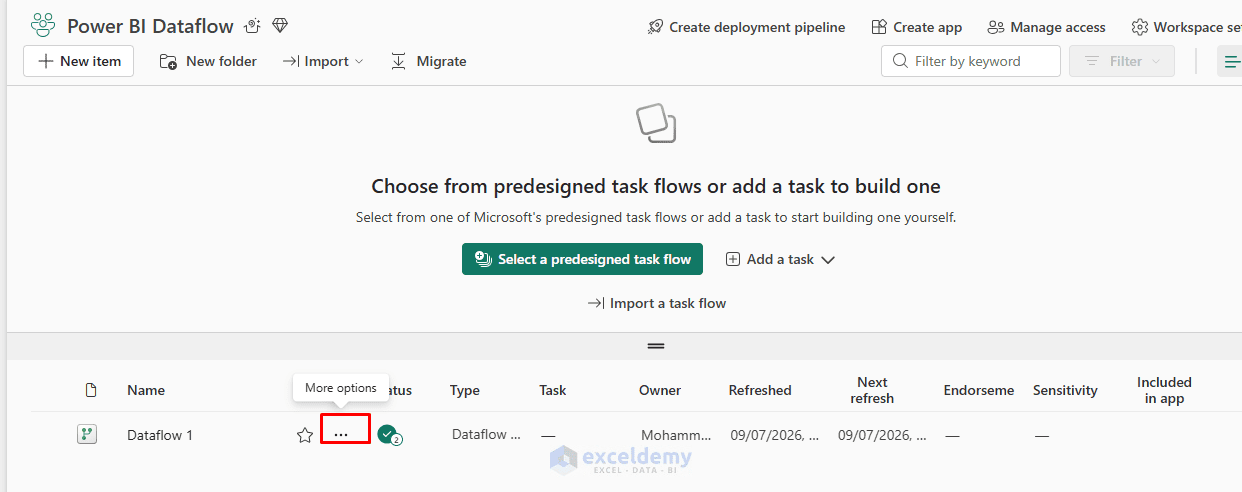
- Choose Settings >> open Scheduled refresh
- Set the refresh frequency and time
- Save the settings
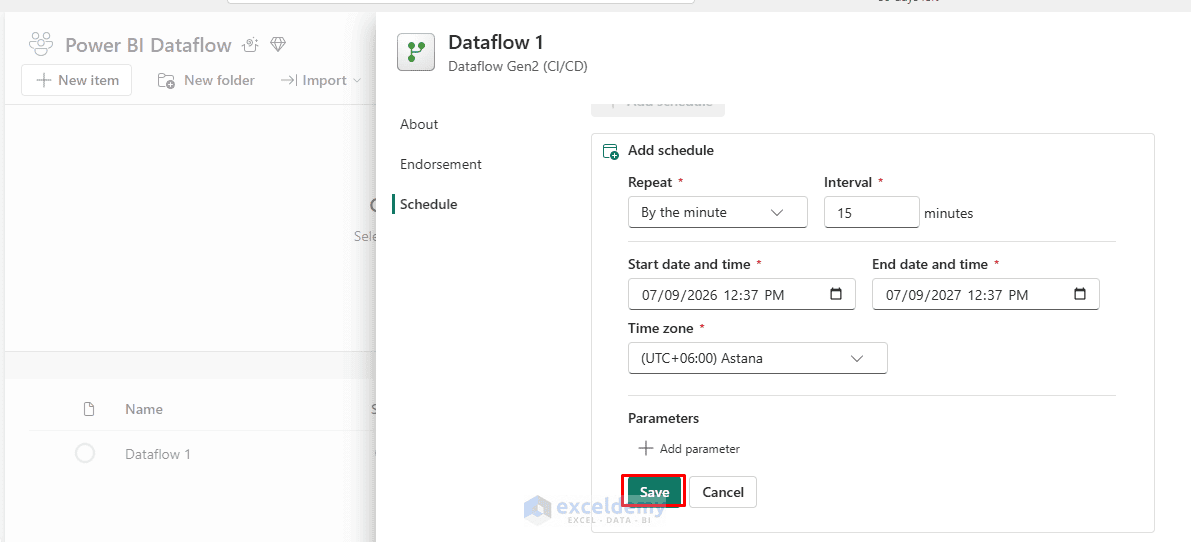
The refresh schedule is managed from the workspace where the dataflow was created.
Use the Dataflow in Power BI Desktop
Now you can build a Power BI report from the prepared dataflow.
- Open Power BI Desktop
- Go to the Home tab >> select Get data >> select Dataflows
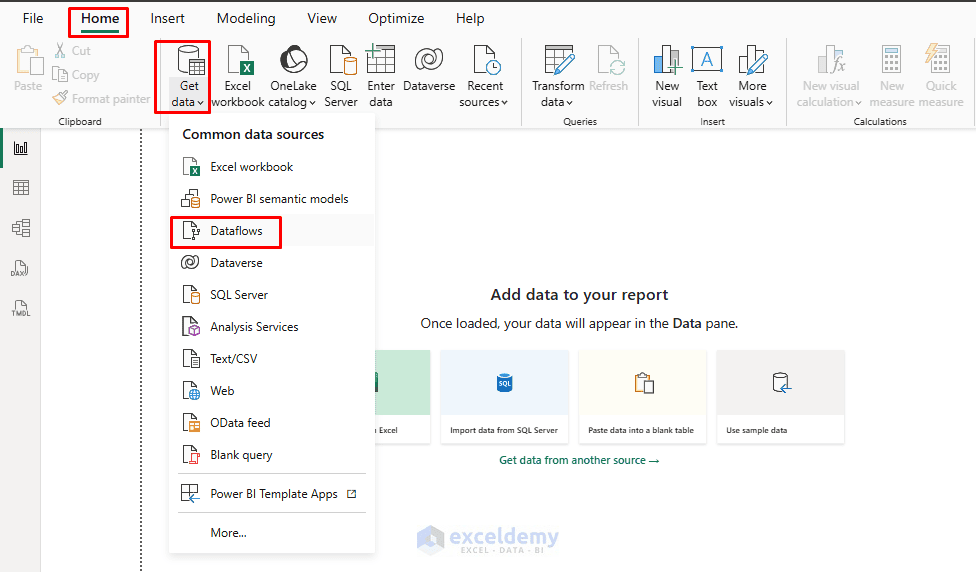
- Sign in with your organizational Power BI account >> click Connect
- Select the workspace >> choose the Dataflow
- Select the table, such as Cleaned Sales Data
- Click Load to bring the table into Power BI Desktop
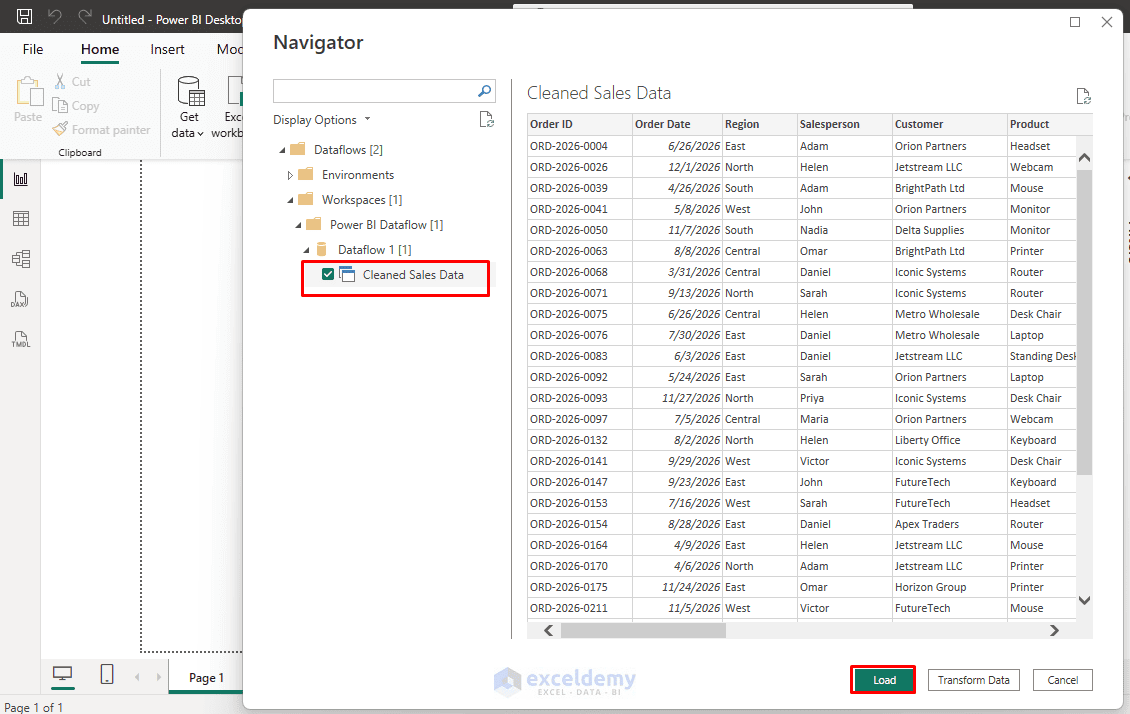
You will get the entire dataflow loaded into Power BI Desktop.
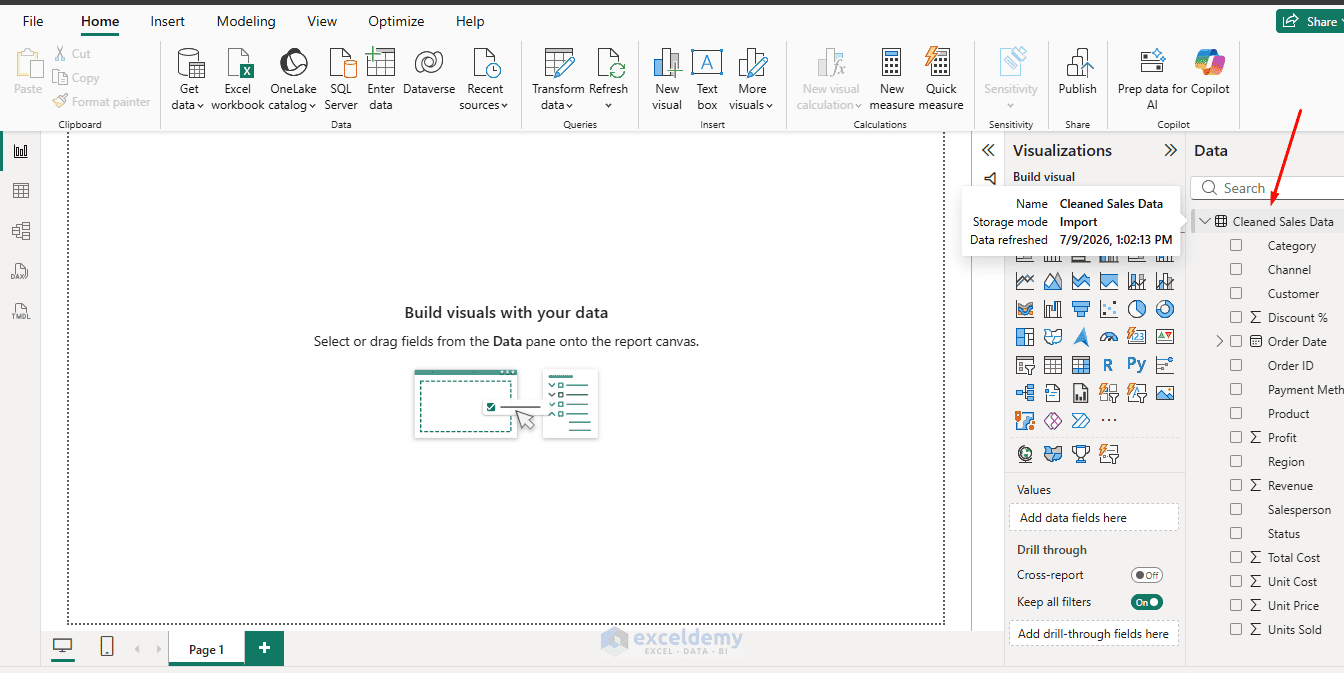
Microsoft states that a dataflow can be consumed by creating a semantic model from the dataflow, by using it as a linked table in another dataflow, or by connecting through tools that read the Common Data Model format.
Create Measures:
After loading the table, you can create DAX measures such as:
Total Revenue = SUM('Cleaned Sales Data'[Revenue])
Total Costs = SUM('Cleaned Sales Data'[Total Cost])
Total Profit = SUM('Cleaned Sales Data'[Profit])
Profit Margin = DIVIDE([Total Profit], [Total Revenue])
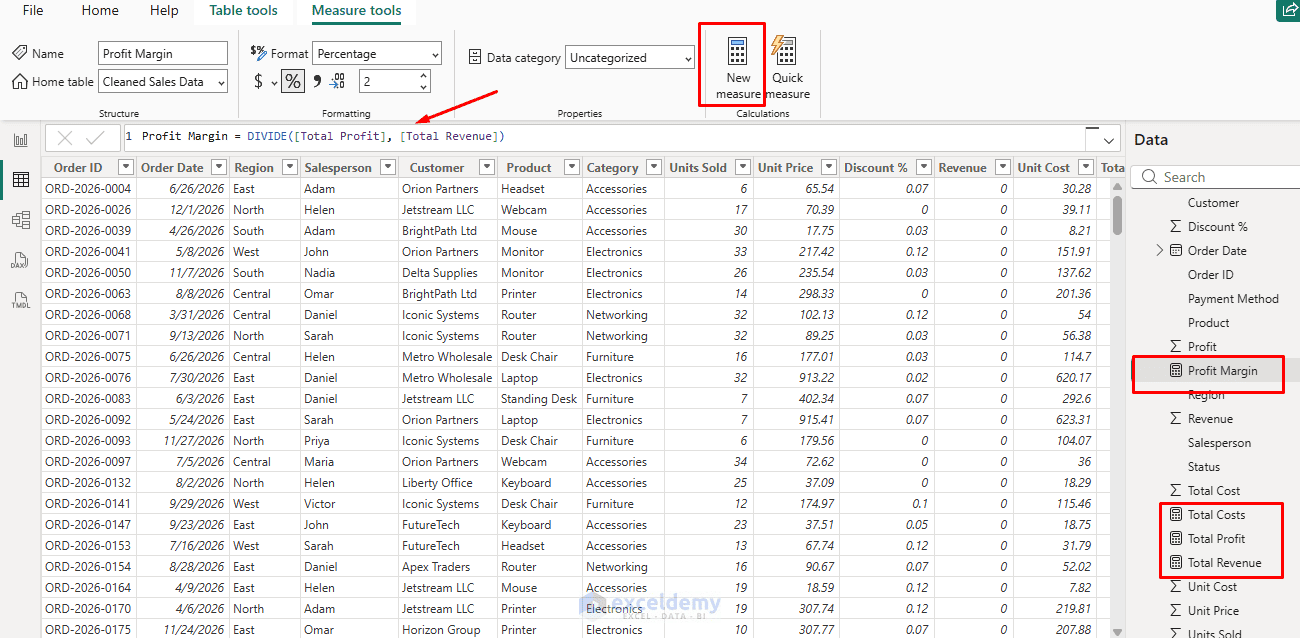
Add Visuals:
- Card: For KPIs — Revenue, Cost, Profit, etc.
- Line chart: Revenue by Month
- Clustered column chart: Revenue by Category
- Pie chart: Revenue by Region, Revenue by Payment Method
- Matrix Table: Revenue and Profit by Salesperson
- Slicer: Region and Status
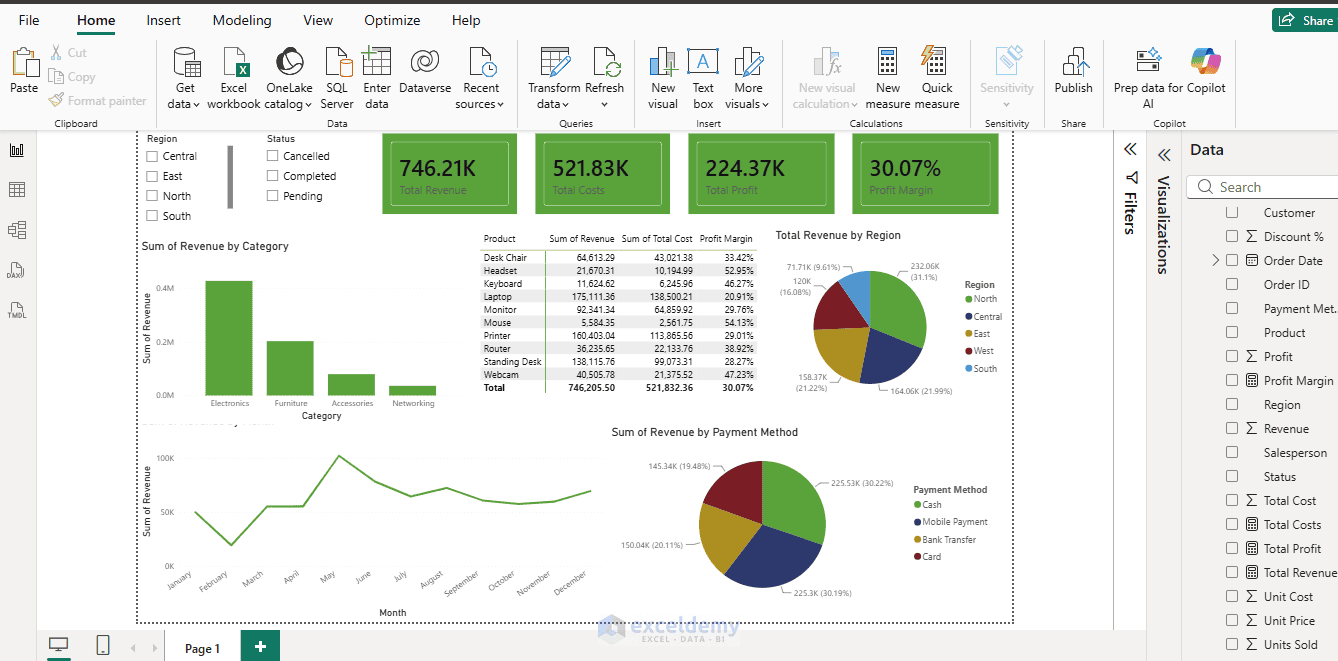
The important point is that Power BI Desktop no longer needs to repeat all the cleaning steps. It connects to the already-prepared dataflow table.
Use the Dataflow in Excel
You can also use dataflow output in Excel through Power Query, depending on your Excel version and connector availability.
- Open Excel
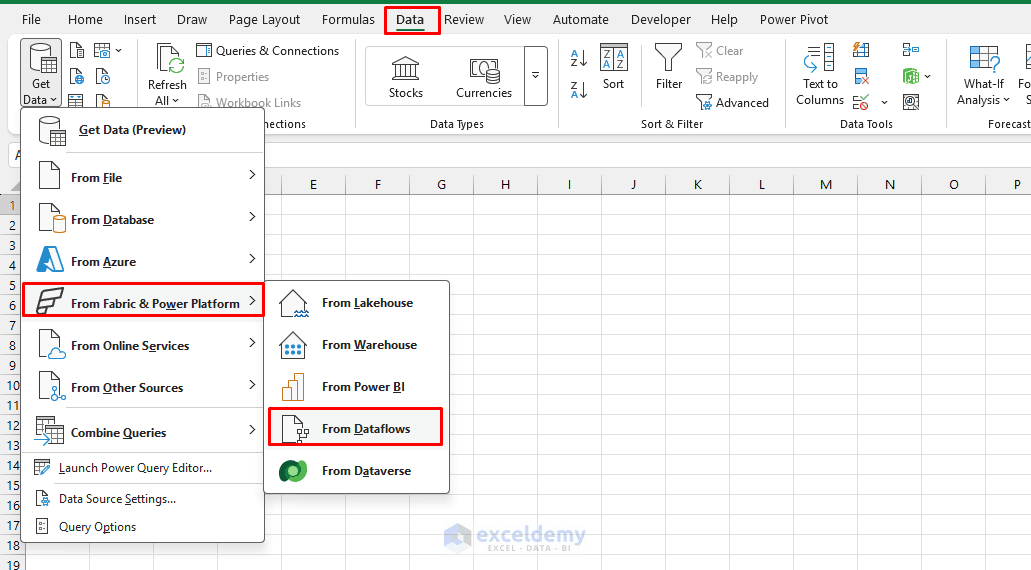
- Go to the Data tab >> select Get Data >> select From Fabric & Power Platform >> select From Dataflows
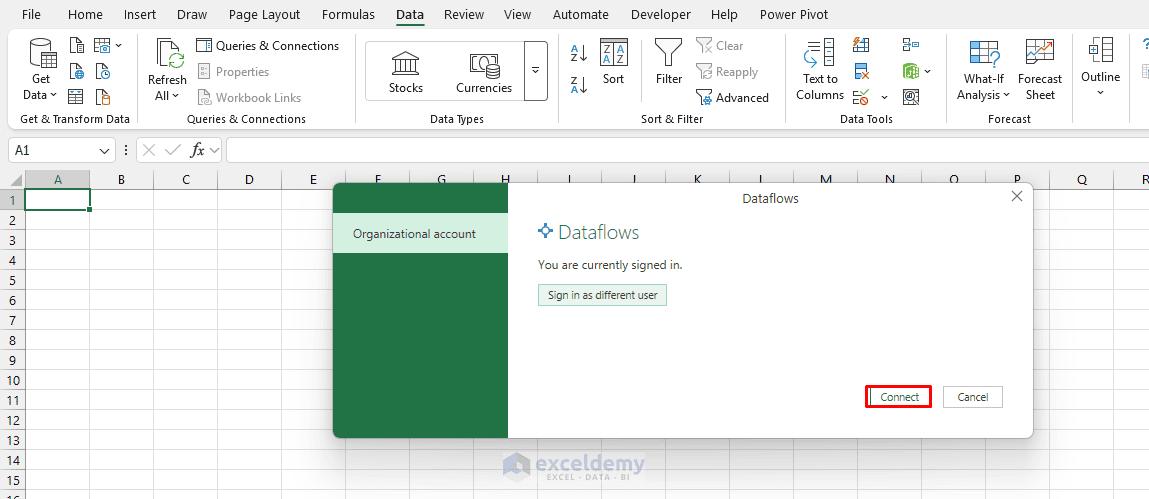
- Sign in with your organizational Power BI account >> click Connect
- Select the workspace >> choose the required table
- Click Load to bring the data into the worksheet, PivotTable, or Data Model
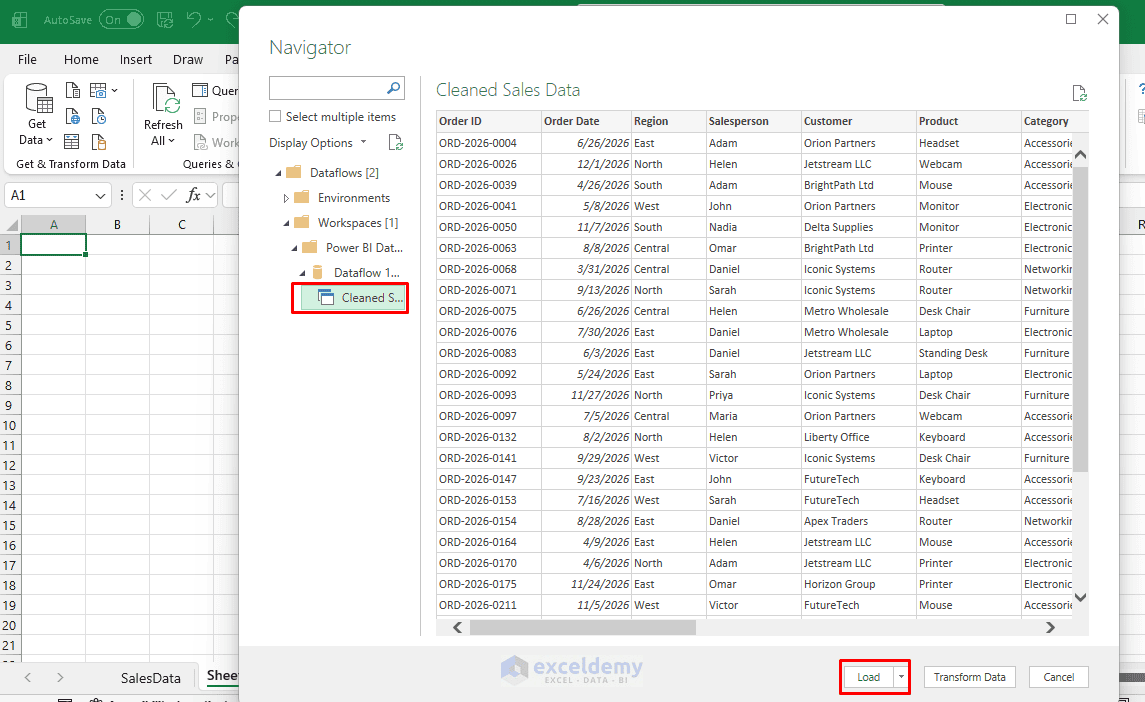
You will get the same data from the Dataflow in Excel.
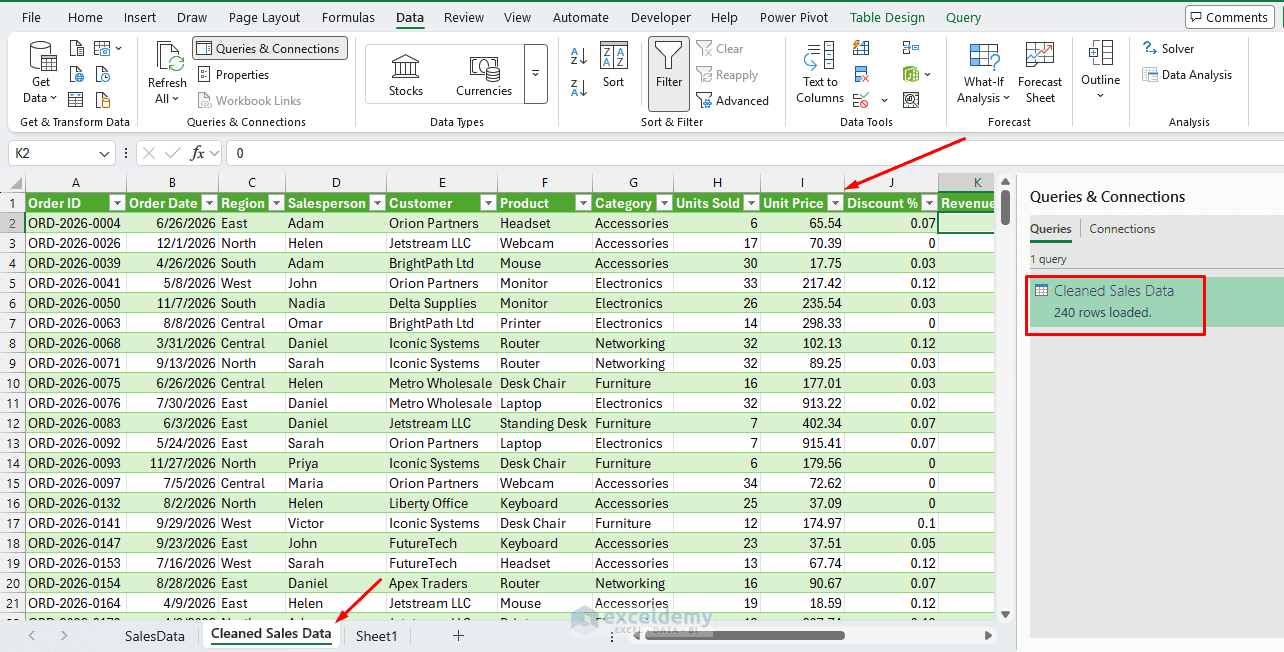
Once loaded into Excel, you can create:
- PivotTables
- PivotCharts
- formulas based on the cleaned table
- monthly summary reports
- region-wise dashboards
This is useful when some users prefer Excel while others use Power BI. Both can rely on the same cleaned source. This report can be refreshed from Excel without rebuilding the cleaning steps.
Note: Microsoft notes that the Power Platform Analytical Dataflows connector is available in Excel Desktop Version 2024 Build 16.0.17932.20732 or newer. Older versions may show the connector but lose connectivity starting June 2026.
Benefits of Using Dataflows
- Reusability and Single Source of Truth: Create transformations once (e.g. a master Date table, customer cleansing logic, or sales metrics) and reuse them across dozens of reports.
- Reduced Load on Source Systems: Data sources are queried once during dataflow refresh; reports consume the prepared data.
- Centralized Maintenance: Update logic in one place and all dependent reports benefit.
- Collaboration: Share with team members; non-developers can build reports on clean data.
- Performance and Scale: Better for large datasets; supports incremental refresh and in-storage computations (Premium).
- Excel Integration: Connect directly from Excel via Power Query to consume dataflow tables.
- Governance: Limit direct access to raw sources and enforce consistent business rules.
Common use cases include shared dimension tables (Date, Product, Customer), standardized ETL pipelines for recurring reports, and preparing data for self-service analytics.
Common Pitfalls and Troubleshooting
- Dataflows are not available in “My Workspace”
- Refresh failures often relate to credentials or gateway issues
- Large datasets may need Premium capacity
- Changes to the dataflow schema can break dependent reports — communicate updates to downstream report owners
- Gen1 to Gen2 migration involves exporting queries or using Save As
Conclusion
Power BI Dataflows help you avoid repeating the same Power Query work in every Excel workbook and Power BI report. They let you create a reusable ETL layer in the Power BI service, refresh it on a schedule, and connect multiple reports to the same cleaned data. For Excel users, this means cleaner PivotTables and reports without manually repeating import steps. For Power BI users, it means more consistent semantic models and dashboards. For teams, it creates a shared version of prepared data that can reduce errors and save time. The core idea is simple: clean the data once, reuse it everywhere.
Get FREE Advanced Excel Exercises with Solutions!

