Anova stands for Analysis of Variance. Similar to the t-test, Anova helps us find out whether the difference between two or more groups of data is significant or not. Meanwhile, the two-way analysis of variance is a test where an outcome is determined depending on two predictor variables. In this tutorial, we are going to see how we can perform Anova two factor with replication in Microsoft Excel.
What Is ANOVA Analysis?
Anova is a statistical method used to analyze variance observed within a dataset. It is generally done by dividing it into two sections- systematic and random factors.
Anova provides the opportunity to determine which factors have a significant effect on a given set of data. After completing the analysis, an analyst usually performs extra analysis on the methodological factors that significantly impact the inconsistent nature of data sets. In that case, he uses the Anova analysis findings to create extra data relevant to the estimated regression analysis. The Anova compares many data sets simultaneously to see whether there is a link between them.
Anova is of two types: single factor and two factors. The methods closely resemble variance analysis. In a single factor, Anova calculates the effect of one single factor on a single variable. Whereas in two factors, there are multiple dependent variables.
How to Use Two Factor ANOVA with Replication in Excel: 2 Suitable Examples
To demonstrate two-factor Anova with replication in Excel, we are bringing up two different examples for a better understanding. We are going to use different datasets for each one and in the end, interpret the result.
Example 1: Two Factor ANOVA with Replication for Student marks
For the first example, we are going to use the following dataset:

The dataset consists of a set of students divided into two parameters- the time when they wake up and the marks they get. The total number of students in each category is enlisted in the cells. For Anova two factor with replication in Excel, you first need to enable the Data Analysis Toolpak in Excel. Then move on to the Anova portion.
Steps to Enable Data Analysis Toolpak:
- First, click on the File tab on your ribbon.
- Then select Options from the left of the backstage view.

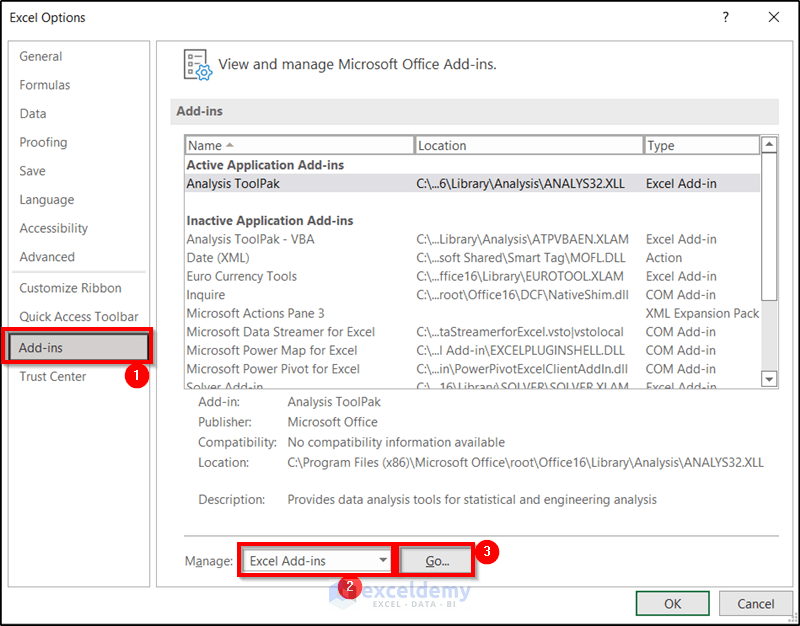
- As a result, the Excel Options box will open up. Now select the Add-ins tab in it first.
- Then select Excel Add-ins in the Manage section.
- After that, click on Go.
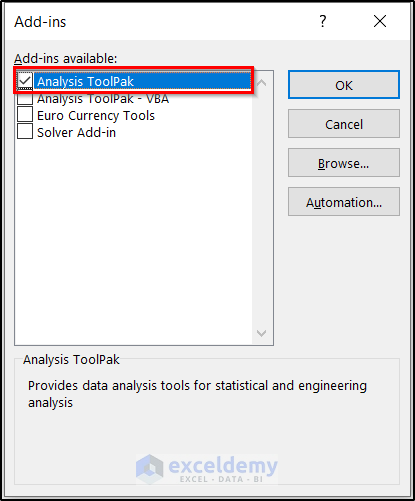
- Next, check Analysis Toolpak under the Add-ins available section of the Add-ins box.
- Finally, click on OK.
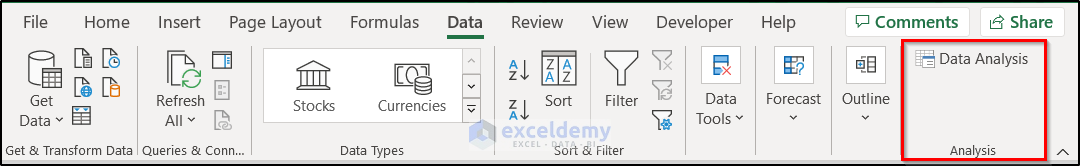
You will now see the Data Analysis tool on your ribbon under the Analysis group of the Data tab.
Steps to Use Two Factor ANOVA with Replication in Excel:
- First of all, go to the Data tab on your ribbon.
- Then select Data Analysis from the Analysis group.

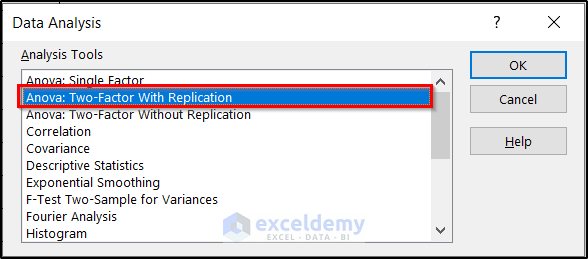
- Now select Anova: Two-Factor With Replication under the Analysis Tools section of the Data Analysis box.
- After that, click on OK.
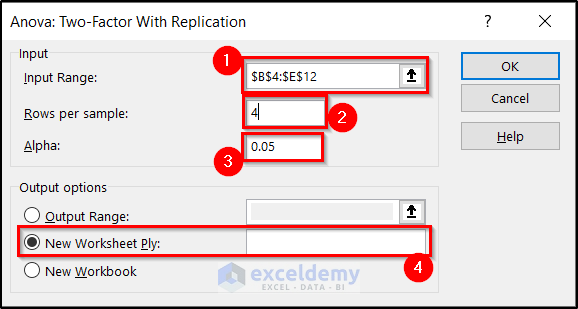
- Consequently, the Anova: Two-Factor With Replication box will open. In the Input Range of the box enter the range B4:E12 for the dataset.
- Then select the Rows per sample. In this case, it is 4.
- Now select the proper alpha value for the analysis. We are going for the usual 0.05 here.
- Also, you can select where you want your analysis result to show under the Output options. For this demonstration, we are choosing a new worksheet.
- After clicking on OK, the Anova two factor with replication result will appear on a new or the already existing Excel spreadsheet depending on the option you have selected.
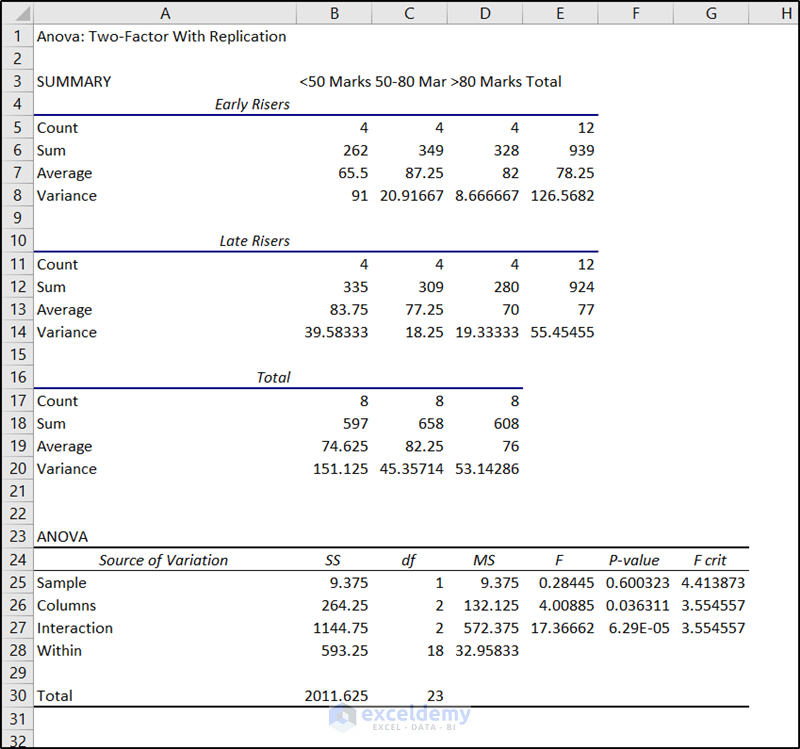
Interpretation of the Result:
Here, Sample is indicating the first variable has a p-value of 0.6 which is greater than the significance or alpha value of 0.05. This accepts the null hypothesis. The Columns or the second variable have a p-value of 0.03. This value is higher than the significance. So, it rejects the null hypothesis.
In terms of Interaction’s p-value, having a lower value than the significance, it indicates the two variables have some significance on each other for this sample data.
Example 2: Two Factor ANOVA with Replication for Working Hours
For the second example, let’s look at a different dataset.
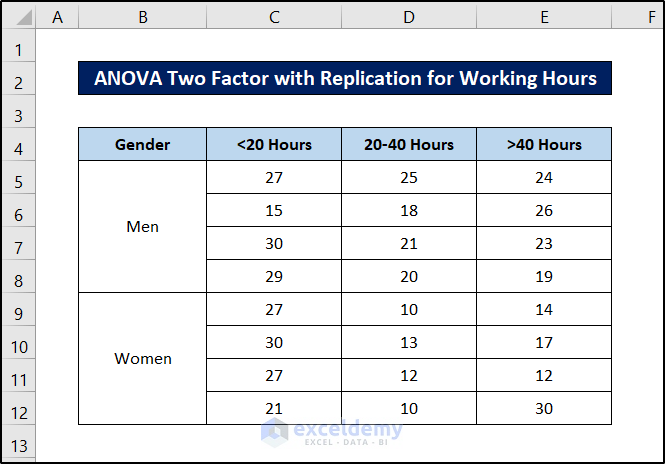
This dataset includes a number of people divided into two genders and their working hours. Similar to the previous example, for Anova two factor with replication in Excel, you first need to enable the Data Analysis Toolpak in Excel. Then move on to the Anova portion.
Steps to Enable Data Analysis Toolpak:
- First of all, click on the File tab on your ribbon.
- After that, select Options from the left of the backstage view.
- As a result, the Excel Options box will open up. Now select the Add-ins tab in it first.
- Now select Excel Add-ins in the Manage section.
- After that, click on Go.
- Next, check Analysis Toolpak under the Add-ins available section of the Add-ins box.
- Finally, click on OK.
From now on, you can see the Data Analysis tool on your ribbon under the Analysis group of the Data tab.
Steps to Use Two Factor ANOVA with Replication in Excel:
- First, go to the Data tab on your ribbon.
- Second, select Data Analysis from the Analysis group.
- Third, select Anova: Two-Factor With Replication under the Analysis Tools section of the Data Analysis box.
- After that, click on OK.
- Consequently, the Anova: Two-Factor With Replication box will open. In the Input Range of the box enter the range B4:E12 for the dataset.
- Now select the Rows per sample. In this case, it is 4.
- Next, select the proper alpha value for the analysis. We are going for the usual 0.05 here.
- Also, you can select where you want your analysis result to show under the Output options. For this demonstration, we are choosing a new worksheet.
- After clicking on OK, the Anova two factor with replication result will appear on a new or the already existing Excel spreadsheet depending on the option you have selected.
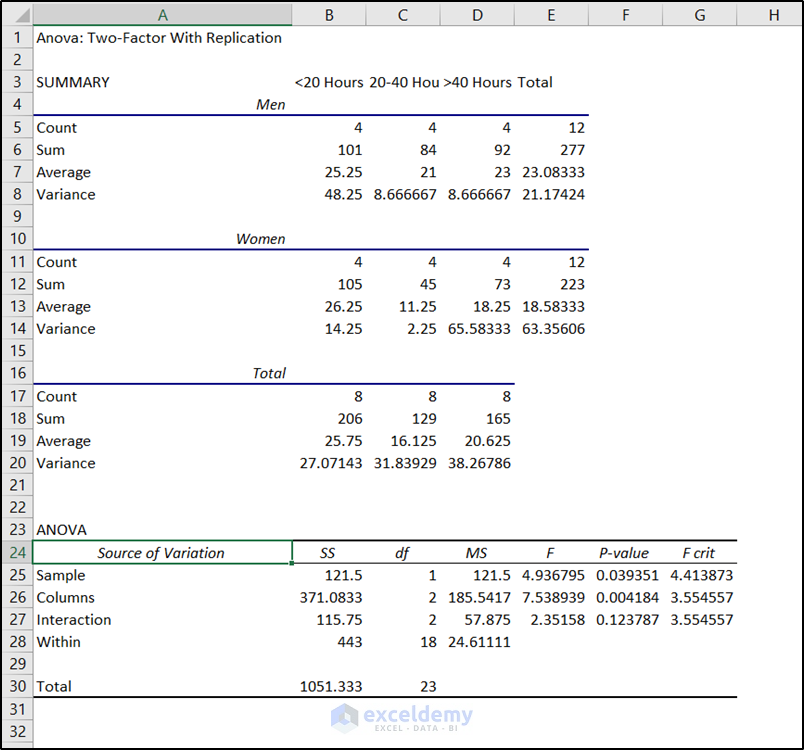
Interpretation of the Result:
In this example, the Sample or the first parameters have a p-value lower than the significance or alpha value (0.05). This indicates it rejects the null hypothesis. The Columns or the second parameters have a p-value of 0.004 which, too, is lower than the significance. So, it rejects the null hypothesis too.
In terms of interactions, the p-value of it is 0.123. This is higher than the significance or the alpha value indicating the variables do not have much significance on each other.
Read More: How to Interpret ANOVA Results in Excel
Download Practice Workbook
You can download the workbook used for the demonstration from the link below.
Conclusion
This concludes two factor Anova with replication and interpretation of their result in Excel. Hopefully, you can perform the analysis of variation for two factors with replication and interpret the variable’s dependency with ease now. I hope you found this guide helpful and informative. If you have any questions or suggestions, let us know in the comments below.
Related Articles
- How to Do Repeated Measures ANOVA in Excel
- How to Apply Rows Per Sample ANOVA in Excel
- Randomized Block Design ANOVA in Excel
- How to Do One Way ANOVA in Excel
- How to Do Two Way ANOVA in Excel
- How to Interpret ANOVA Single Factor Results in Excel
- Two Way ANOVA in Excel with Unequal Sample Size
- How to Use ANOVA Two Factor Without Replication in Excel
<< Go Back to Anova in Excel | Excel for Statistics | Learn Excel
Get FREE Advanced Excel Exercises with Solutions!
