

Power BI reports can track sales, profit, costs, inventory, service performance, and other important business measures. However, repeatedly opening a report just to check whether a value has changed is inefficient. Power BI provides two notification features: Alerts notify you when a data condition is met. Subscriptions email a report or dashboard snapshot according to a schedule. For example, you could create an alert when Total Sales falls below $80,000 and receive the complete sales report every Monday morning.
In this tutorial, we will show how to use Power BI alerts and subscriptions to get notified before you open the report. Use an alert when the notification depends on the data and a subscription to have the latest report delivered regularly.
Why Use Alerts and Subscriptions?
- Data Alerts: Notify you (via Power BI notifications and optionally email) when specific metrics on a dashboard tile exceed, fall below, or meet a threshold. Ideal for monitoring KPIs like sales targets, inventory levels, or performance metrics.
- Subscriptions: Deliver scheduled emails with snapshots of reports or dashboards (or links). Perfect for routine updates like weekly sales summaries.
| Feature | Trigger | Example |
| Report alert | A value changes or reaches a condition | Notify me when sales decrease by 10% |
| Dashboard alert | A dashboard tile goes above or below a threshold | Notify me when profit exceeds $25,000 |
| Subscription | A scheduled time or the first daily refresh | Email the report every Monday at 8:00 AM |
Both require the Power BI service (not Desktop) and appropriate licenses and permissions (Pro or Premium for broader sharing). Admins may need to enable subscriptions in the tenant settings.
Prerequisites:
- Access to Power BI Service (app.powerbi.com)
- A published report and dashboard (for alerts)
- Viewer or higher permissions on the content
- Email configured in your Microsoft account
Note: Alerts work only on specific visuals pinned to dashboards (Cards, KPIs, Gauges). Subscriptions work on reports and dashboards.
Create an Alert Directly from a Power BI Report
The Set alert command in the report toolbar and the Add alert command in a visual’s three-dot menu create Fabric Activator alerts. This is different from the traditional alert created from a pinned dashboard tile. Report alerts are currently identified by Microsoft as a public-preview Power BI feature. They require access to a report in an eligible Fabric or Premium-capacity workspace.
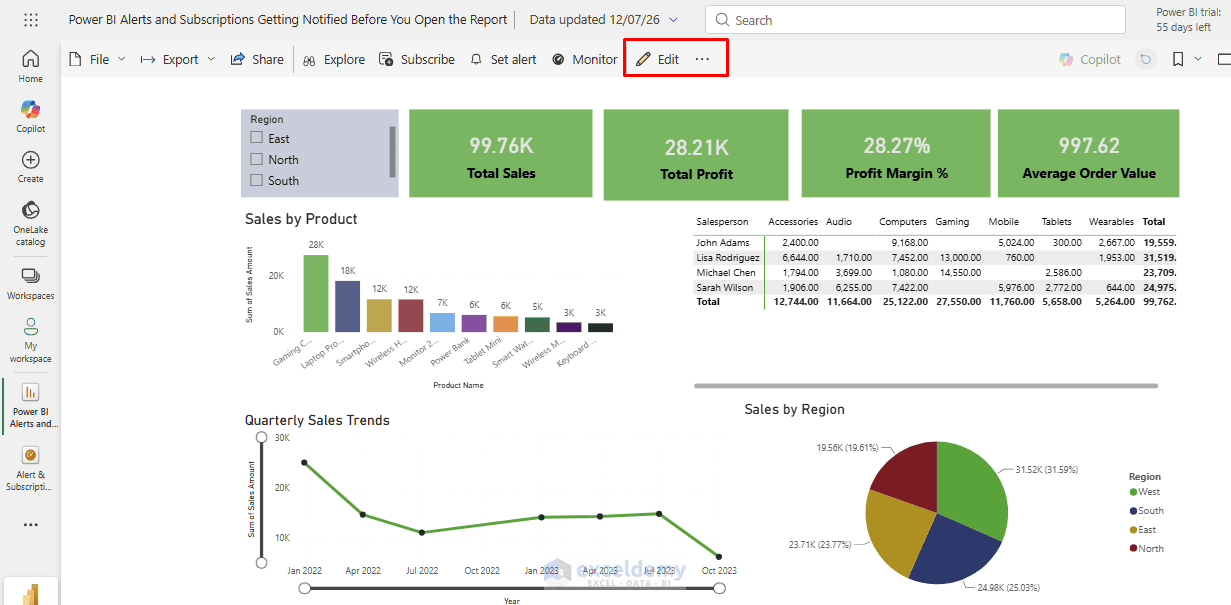
Step 1: Open the Report in the Power BI Service
- Publish the report from Power BI Desktop and open it in the Power BI service
- Make sure the report is open in Edit view
- Report-level alerts are not created in Power BI Desktop
- At the top of the report, you should see the Set alert command
Step 2: Create the Alert
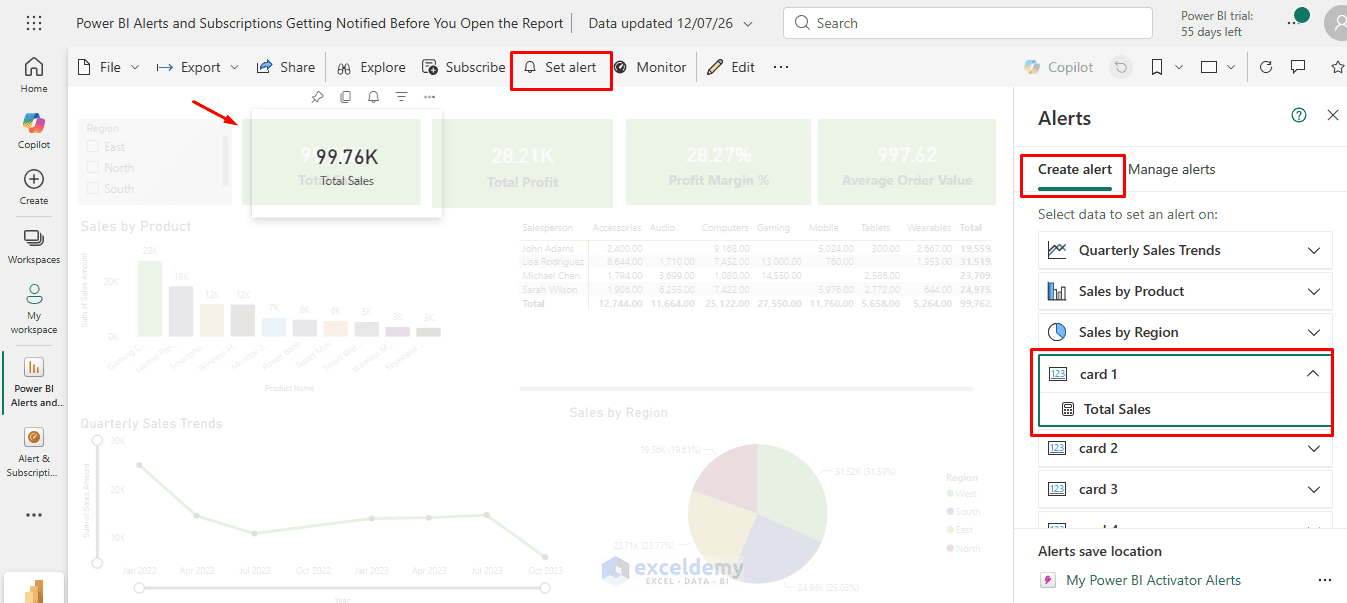
- Select Set alert from the top toolbar
- Or select the three-dot menu of the Card visual >> select Add alert
- From Create Alert >> select the Total Sales Card
- Configure:
- Use Changes when you want the alert to react to movement in the value
- For example: Increases by 50%
- Use Becomes when you want the alert to compare the value against a specific threshold or range
- For example: Becomes greater than $100,000
- Toggle Notification Options:
- In Via, select Email or Microsoft Teams
- In Send to, enter the address
- Click Apply
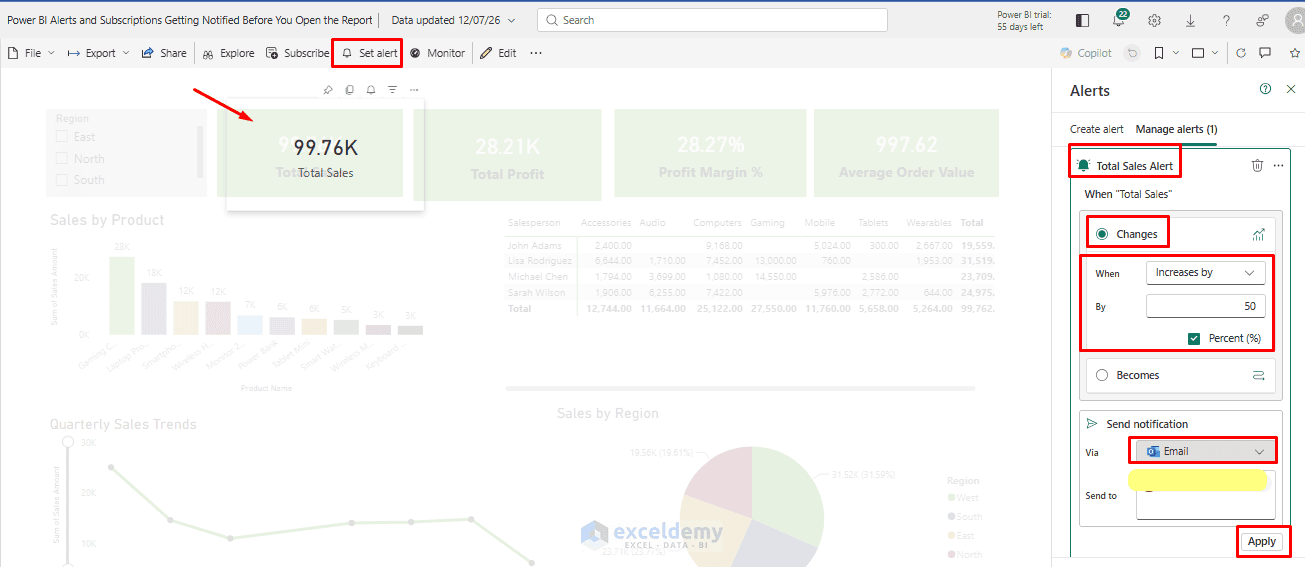
Power BI creates or updates the Activator item, connects it to the report’s semantic model, and begins monitoring the selected data.
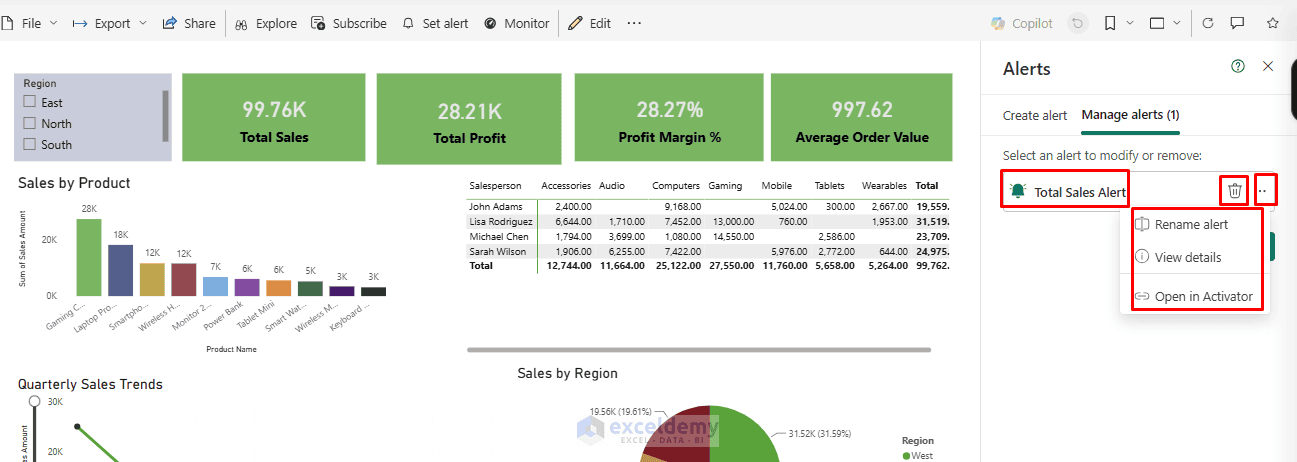
Step 3: Manage Existing Report Alerts
- Open the report >> select Set alert
- Open the Manage alerts tab to view the alerts associated with that report
- From there, you can edit or delete the alerts
- Review the condition
- Change the threshold
- Change the notification recipient
- Delete an alert
- Open the alert in Fabric Activator
Step 4: Understand How Report Filters Affect the Alert
Activator saves the filters that are active when you create the alert. Suppose you select East in the Region slicer before creating the Total Sales alert. The alert monitors Total Sales for the East region. Changing the slicer to North after creating the alert does not change the existing rule.
- Use Show applied filters in the alert pane to verify which filters the alert is using
- You could therefore create separate alerts, such as:
- East Sales becomes less than $20,000
- North Sales becomes less than $25,000
- South Sales becomes less than $18,000
Apply the appropriate Region filter before creating each alert.
Report Alert Considerations: Activator supports many Power BI visual types, including Cards, KPIs, Gauges, line charts, bar and column charts, pie charts, donut charts, tables, and matrices. Keep these behaviors in mind:
- For a visual with multiple series, the condition is applied to each series
- For a table, the rule is evaluated for each row
- For a matrix, it can be evaluated for each cell
- For a time-axis visual, Activator uses the time axis when evaluating the rule
- Filters are captured when the alert is created and do not change automatically afterward
Create a Traditional Alert from a Dashboard Tile
The alert shown in a dashboard’s Manage Alerts pane is the older Power BI alert system. It is simpler than Fabric Activator and supports only Card, KPI, and Gauge tiles. The tile must be on a Power BI dashboard.
Step 1: Pin the Visual to a Dashboard
Move your pointer over the Card visual.
- Select the Card visual or any KPI
- Select the Pin visual icon >> choose New dashboard or an Existing dashboard
- Enter a name such as: Alert & Subscriptions
- Click Pin
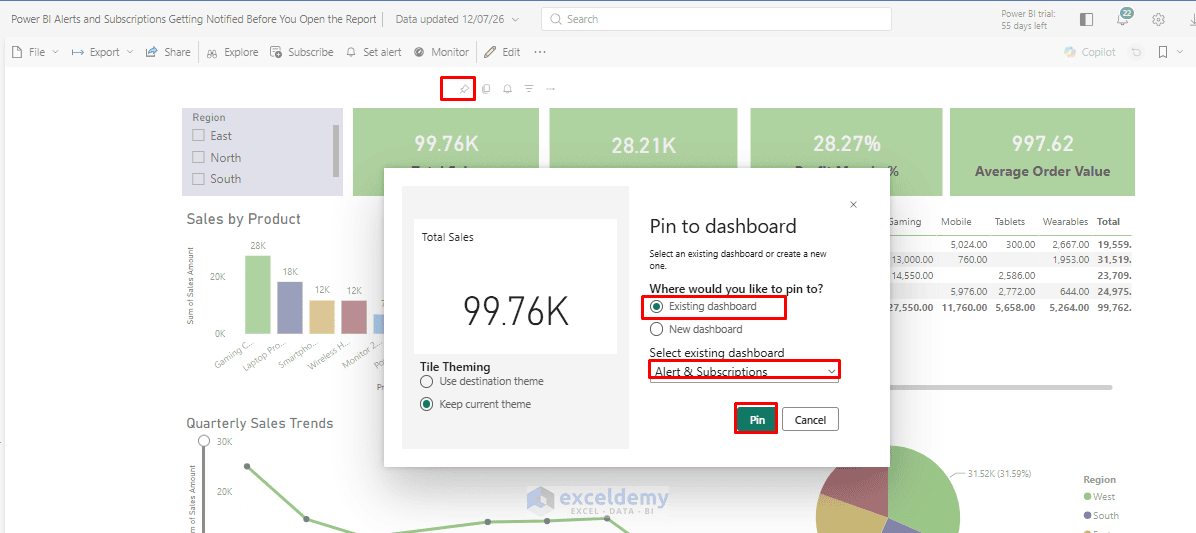
The report visual now appears as a dashboard tile.
Step 2: Create the Alert
On the Card, KPI, or Gauge tile:
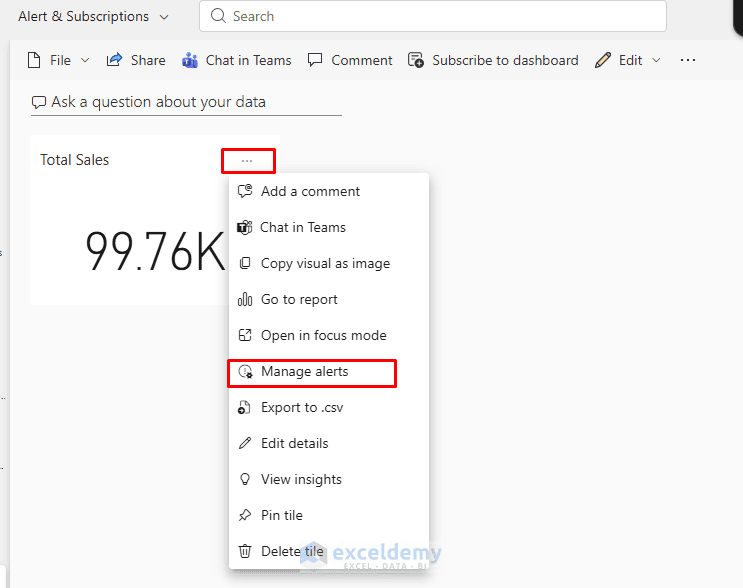
Access Alert Settings:
- Click the ellipsis (…) in the top-right corner of the tile
- Select Manage alerts (or Add alert)
Create a New Alert Rule:
- Click + Add alert rule
- Toggle Active to On
- Give it a clear Title (e.g. “Total Sales Exceeded”)
- Configure:
- Condition: Above, Below, or a range (some visuals support only Above/Below)
- Threshold value: 100000
- Maximum Notification Frequency: At most every 24 hours or At most once an hour
- Enable Send me email too for inbox notifications
- Click Save and close
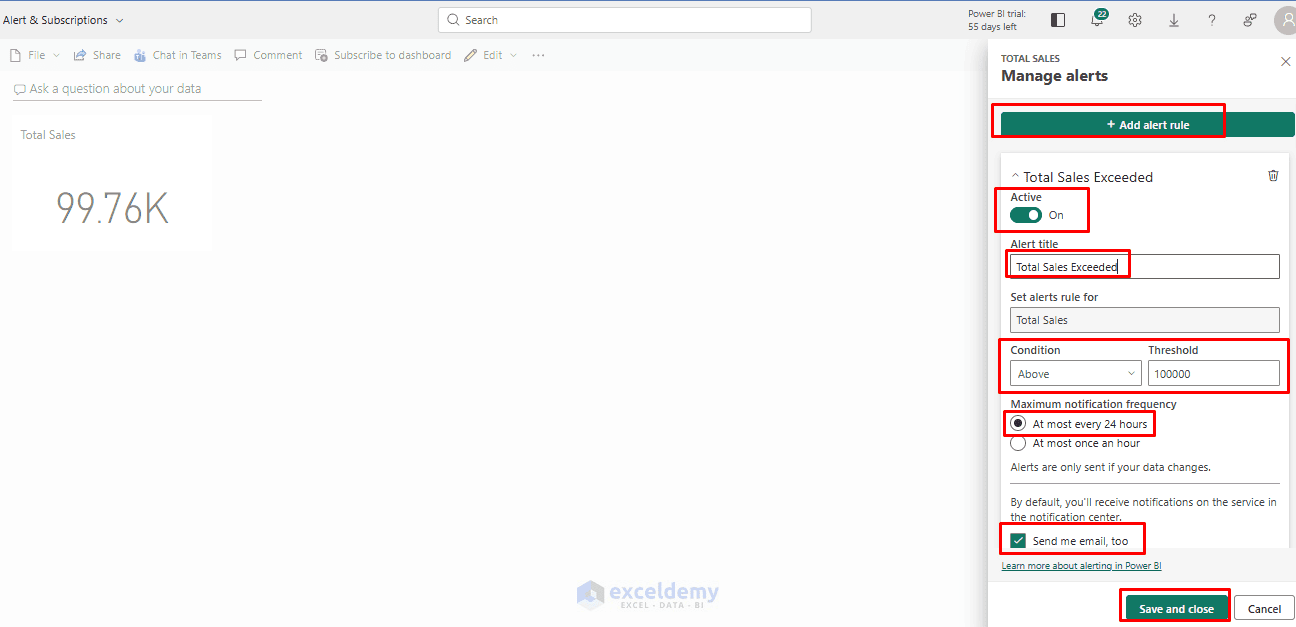
Turn on the email option if you want Power BI to send an email in addition to a Notification Center message. When refreshed data passes the threshold, Power BI checks whether the selected one-hour or 24-hour notification interval has passed. It then sends a Notification Center alert and, when selected, an email.
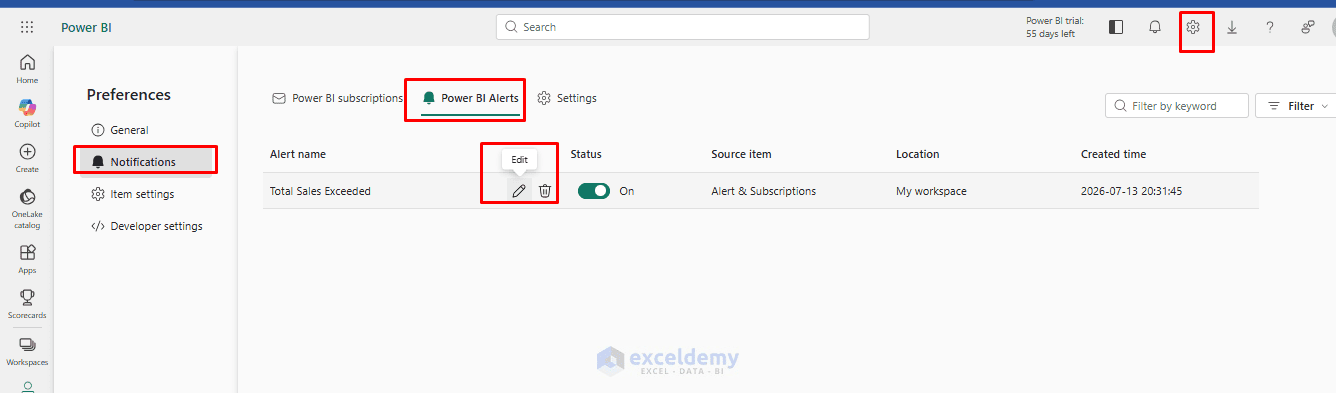
Step 3: Managing Alerts
- Go to the gear icon (Settings) >> select Alerts to view, edit, or disable all your alerts
- Alerts appear in the Notification center (bell icon)
- They are personal; only you see your alerts, even on shared dashboards
Step 4: Understand How the Trigger Evaluates
This is a common point of confusion: the alert only re-evaluates when the underlying dataset refreshes, not continuously in real time. If your dataset refreshes once nightly, your alert can fire at most once a day, regardless of the frequency setting you chose. The frequency setting caps how often you are notified if the condition remains true across multiple refreshes; it does not cause Power BI to poll the data more frequently than the refresh schedule allows.
Traditional Dashboard Alerts Behavior:
- Work only when the underlying data refreshes
- Support only the Above and Below conditions
- Are personal to the person who creates them
- Do not become visible to other users when the dashboard is shared
- Can send Notification Center and optional email notifications
Use a report alert when you need more flexible conditions, report filters, multiple recipients, or automation. Use a dashboard alert when you need a simple personal alert for a headline Card, KPI, or Gauge value.
Create a Power BI Email Subscription
Subscriptions are fundamentally different: instead of watching for a threshold, they email a static snapshot (image and link) of a report or dashboard on a recurring schedule — daily at 7 AM, every Monday, etc. Power BI allows up to 24 subscriptions for each report or dashboard. Each subscription can use different recipients, schedules, and report settings.
Check the Subscription Requirements: To subscribe, you need access to the report or dashboard and either Power BI Pro, Premium Per User, or access to content in a paid Premium-capacity workspace. The Fabric administrator must also enable subscriptions for the tenant. Subscribing on behalf of other people requires additional permissions and licensing.
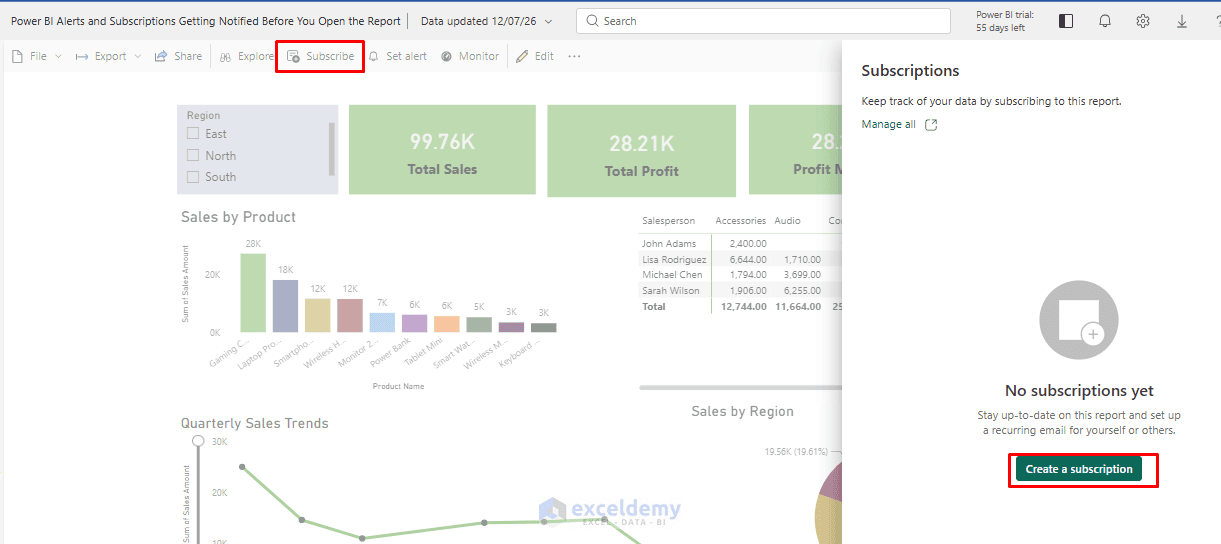
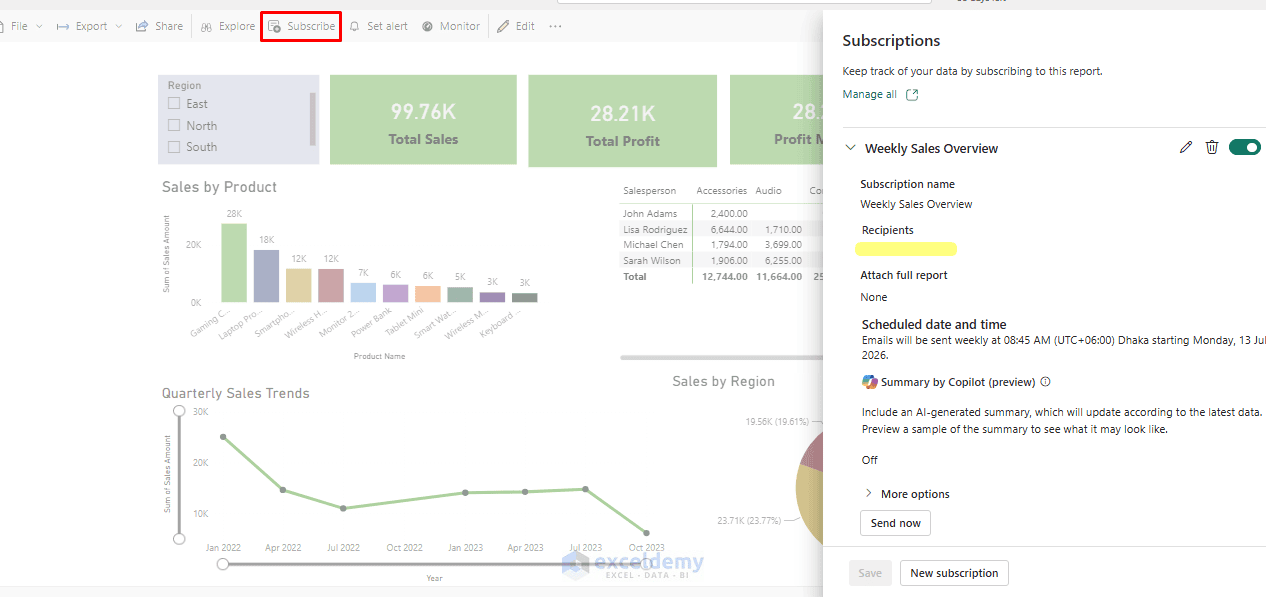
Step 1: Open the Subscription Pane
- Open the report or dashboard you want to subscribe to
- Click Subscribe in the top menu bar >> select Create a subscription
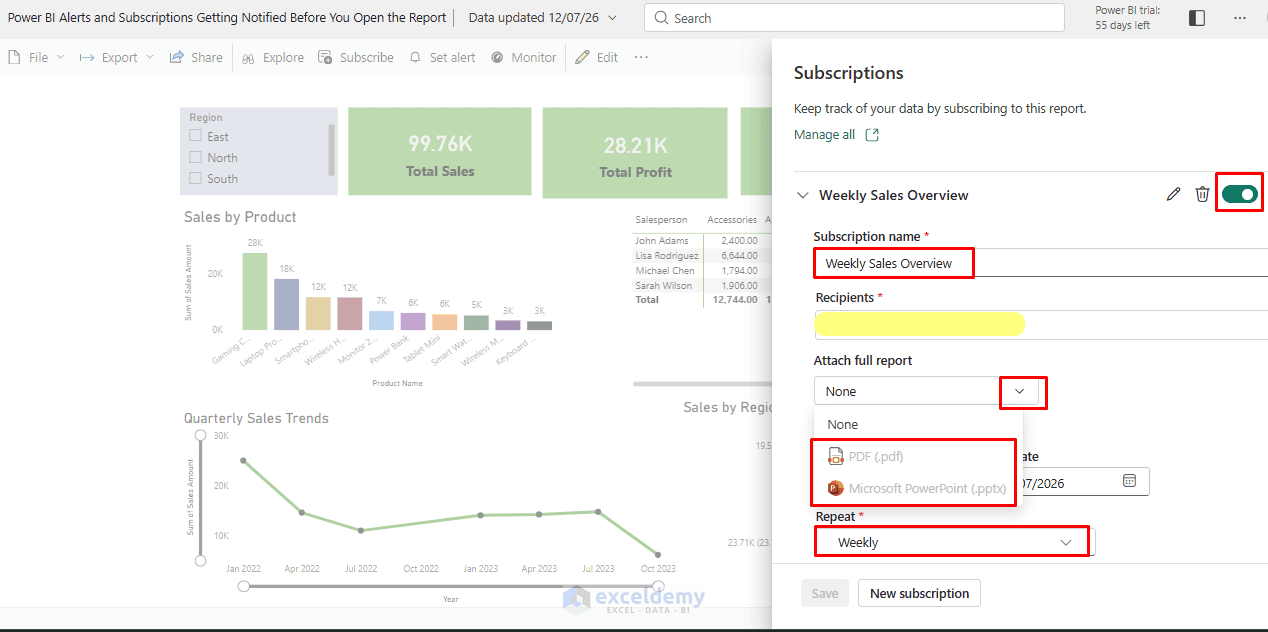
Step 2: Configure the Subscription
- Give it a Name (e.g. “Weekly Sales Overview”)
- Use the subscription slider to turn it On
- Add Recipients (email addresses, yourself and others)
- Choose one of these formats:
- PowerPoint
Full-report attachments are available for reports in Premium or Premium Per User workspaces. The attachment must contain no more than 20 pages and must be smaller than 25 MB.
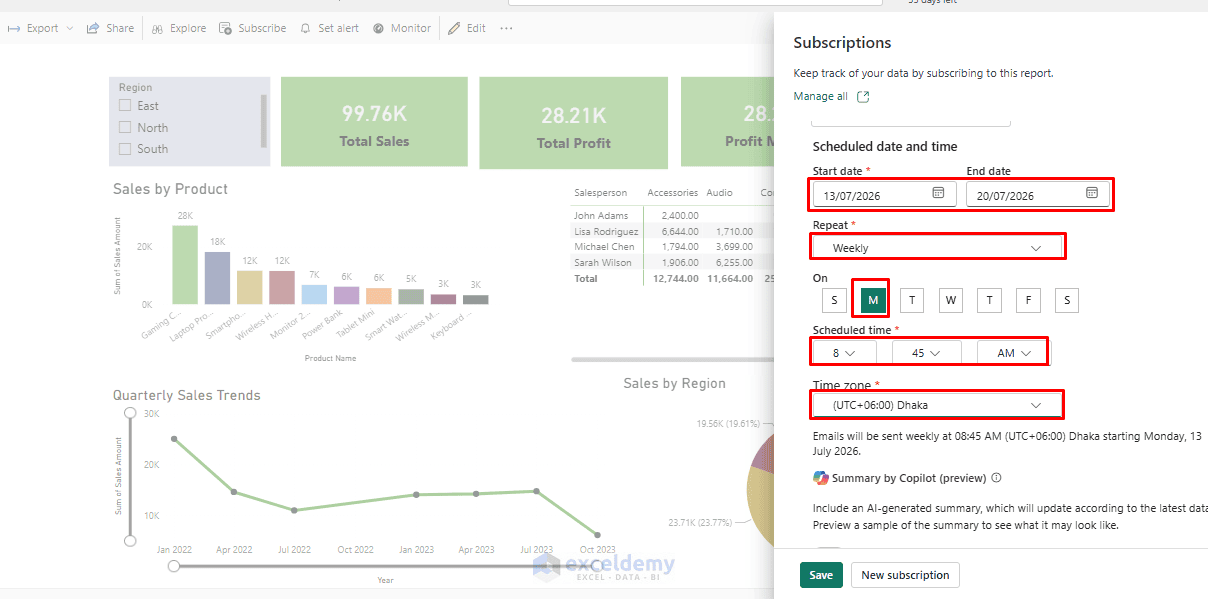
- Start date / End date: Useful for time-boxed reporting (e.g. stop after a project wraps)
- Frequency: Daily, Weekly (pick days), or Monthly
- Time: Specify the send time and time zone
- Click Save
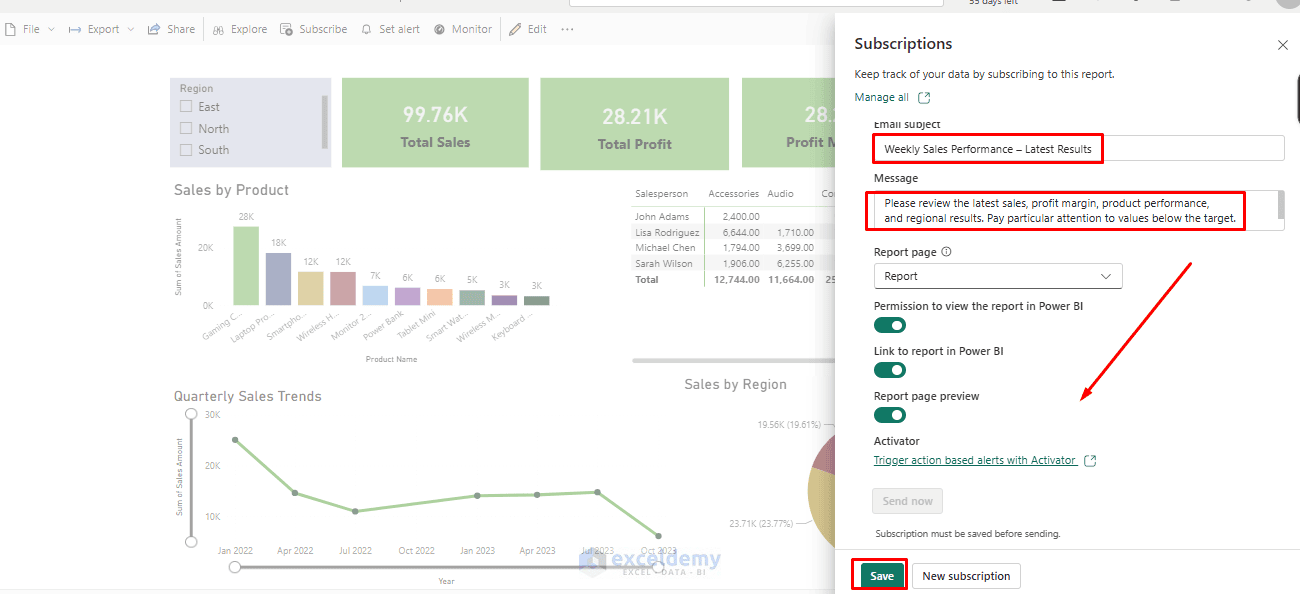
Step 3: Customize the Email
- Expand More options
- Enter an email subject: Weekly Sales Performance – Latest Results
- Add a message:
Please review the latest sales, profit margin, product performance, and regional results.
Pay particular attention to values below the target.
- Click Save
For report subscriptions, the message appears above the preview image. For dashboard subscriptions, it appears below the preview.
Preview Subscription:
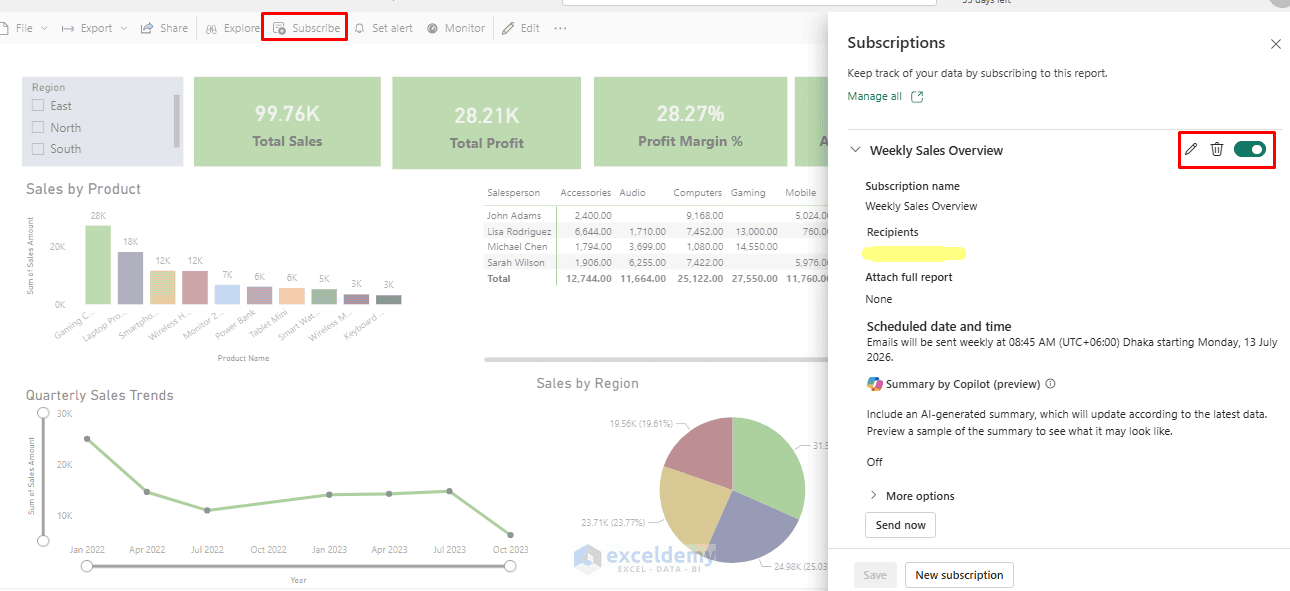
Step 4: Manage Subscriptions
- Open the dashboard >> select Subscribe
- Expand the rule >> click Edit to change its condition, threshold, or frequency
- Turn off the toggle icon to pause it
- Use the trash-can icon to Delete it
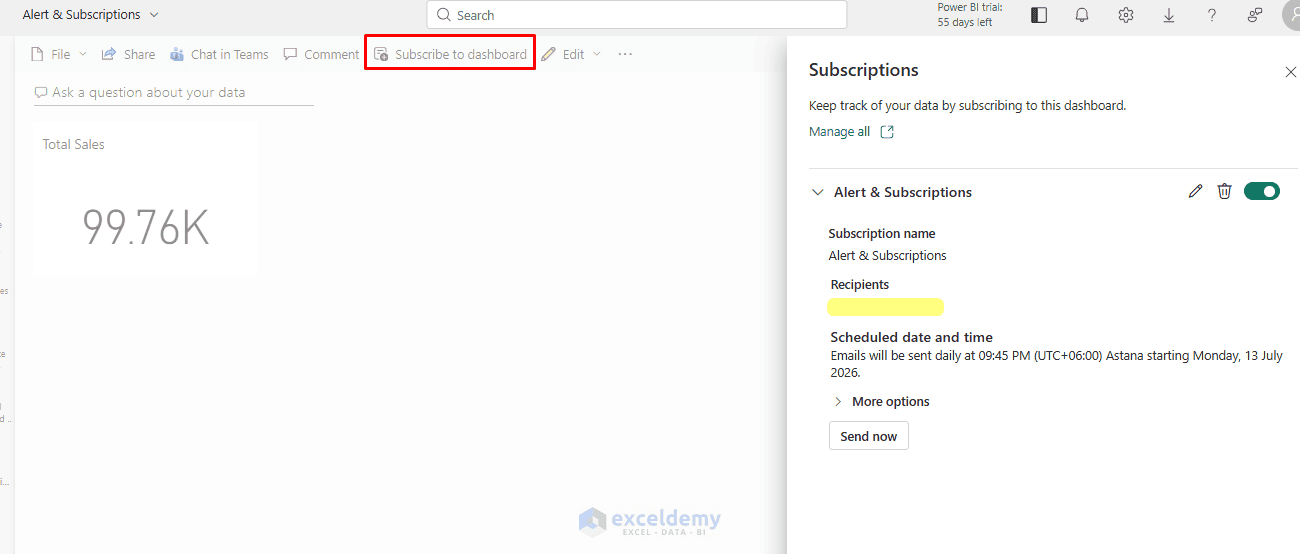
Subscribe to Dashboard:
- Go to the pinned dashboard
- Click Subscribe to dashboard
- Follow the same procedure as the report subscription
Best Practices and Troubleshooting
- Combine Both: Use alerts for immediate issues and subscriptions for routine overviews.
- Performance: Frequent checks and subscriptions can impact capacity; monitor usage in Premium workspaces.
- Governance: Share responsibly; use row-level security (RLS) so recipients see only their data.
- Common Issues:
- No email? Check spam, tenant settings, or refresh schedules.
- Alerts not firing? Ensure the tile supports them and data has refreshed.
- Mobile: Set and view alerts in the Power BI mobile apps.
- Security: Subscriptions respect sharing permissions and RLS.
Conclusion
By following this tutorial, you can use Power BI alerts and subscriptions to get notified before you open the report. Power BI alerts and subscriptions help users monitor data without repeatedly opening a report. Use a Fabric Activator report alert when you need to detect changes, percentages, ranges, or filtered report conditions. Use a traditional dashboard alert when you need a simple Above or Below threshold for a pinned Card, KPI, or Gauge tile. Use a subscription when you want a report or dashboard delivered by email on a regular schedule. Together, these features turn Power BI from a report that users must remember to check into a monitoring system that delivers important information when it is needed.
Get FREE Advanced Excel Exercises with Solutions!

